Home > Analyses > Healthcare > Johnson & Johnson
Johnson & Johnson transforms healthcare with groundbreaking medicines and cutting-edge medical devices that touch millions of lives daily. Its leadership in innovative treatments for complex diseases and advanced surgical technologies sets the industry standard. After spinning off its Consumer Health division, JNJ now sharpens focus on high-growth, science-driven segments. The key question for investors: do JNJ’s robust fundamentals still justify its premium valuation and growth prospects in today’s evolving healthcare landscape?

Table of contents
Business Model & Company Overview
Johnson & Johnson, founded in 1886 and headquartered in New Brunswick, NJ, commands a dominant position in healthcare. Its ecosystem centers on two pillars: Innovative Medicine, tackling complex diseases, and MedTech, offering cutting-edge medical devices. This focus emerged after spinning off Consumer Health in 2023, sharpening its innovation-driven mission across pharmaceuticals and advanced surgical solutions.
The company generates value through a balanced mix of prescription drugs and medical devices, serving hospitals, healthcare professionals, and retailers worldwide. Its footprint spans the Americas, Europe, and Asia, leveraging scale to optimize product reach. Johnson & Johnson’s economic moat lies in its integrated healthcare platform and relentless R&D, shaping the future of medical innovation globally.
Financial Performance & Fundamental Metrics
I will analyze Johnson & Johnson’s income statement, key financial ratios, and dividend payout policy to assess its overall financial health and shareholder value.
Income Statement
The following table summarizes Johnson & Johnson’s key income statement figures for fiscal years 2023 to 2025, highlighting revenue, expenses, profits, and earnings per share.
| 2023 | 2024 | 2025 | |
|---|---|---|---|
| Revenue | 85.2B | 88.8B | 94.2B |
| Cost of Revenue | 26.6B | 27.5B | 25.6B |
| Operating Expenses | 35.2B | 39.2B | 43.0B |
| Gross Profit | 58.6B | 61.4B | 68.6B |
| EBITDA | 23.3B | 24.8B | 32.6B |
| EBIT | 15.8B | 17.4B | 32.6B |
| Interest Expense | 772M | 755M | 971M |
| Net Income | 35.2B | 14.1B | 26.8B |
| EPS | 13.88 | 5.84 | 11.03 |
| Filing Date | 2024-02-16 | 2025-02-13 | 2026-02-11 |
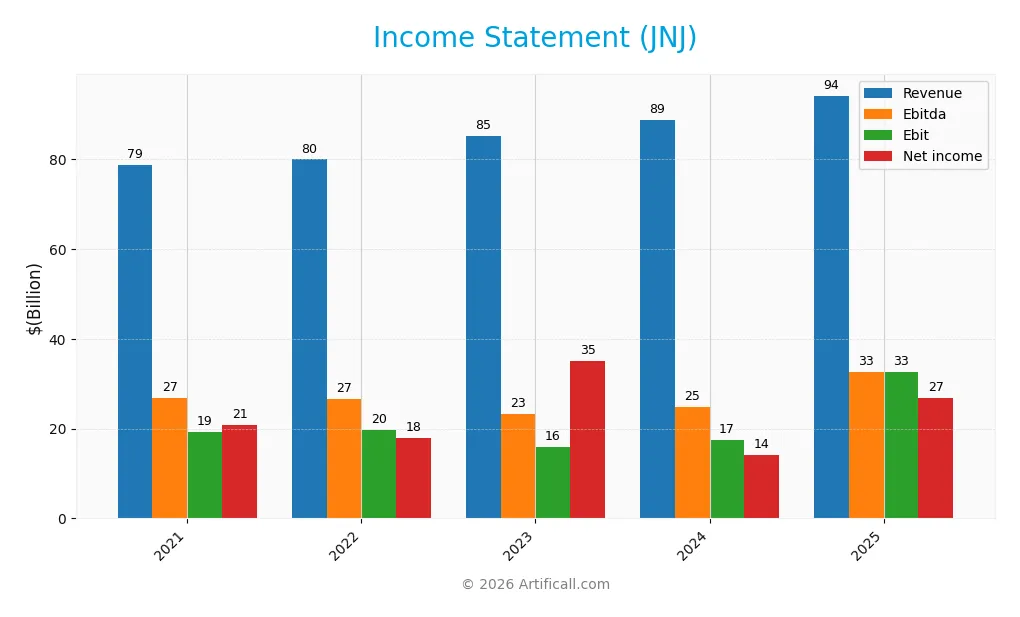
Income Statement Evolution
Johnson & Johnson’s revenue increased steadily from $78.7B in 2021 to $94.2B in 2025, reflecting a 19.6% growth overall. Net income showed a more moderate 28.4% rise over the period, with net margins improving by 7.3%. Gross margins remained strong and stable around 72.8%, while EBIT margins expanded significantly in 2025, signaling enhanced operational efficiency.
Is the Income Statement Favorable?
The 2025 income statement reveals favorable fundamentals. Revenue grew 6% year-over-year, while gross profit rose 11.7%, outpacing cost growth. EBIT surged nearly 87%, lifting operating margins to 34.6%. Net margin expanded to 28.5%, supported by low interest expense of just 1%. These factors, combined with a 90.5% EPS growth, highlight strong profitability and disciplined cost management.
Financial Ratios
The following table summarizes key financial ratios for Johnson & Johnson over the past five fiscal years, providing a snapshot of its profitability, liquidity, leverage, and valuation metrics:
| Ratios | 2021 | 2022 | 2023 | 2024 | 2025 |
|---|---|---|---|---|---|
| Net Margin | 26.5% | 22.4% | 41.3% | 15.8% | 28.5% |
| ROE | 28.2% | 23.4% | 51.1% | 19.7% | 1848.6% |
| ROIC | 13.8% | 12.3% | 16.6% | 13.8% | 2366.0% |
| P/E | 21.6 | 25.7 | 11.3 | 24.5 | 18.8 |
| P/B | 6.1 | 6.0 | 5.8 | 4.8 | 34764.2 |
| Current Ratio | 1.35 | 0.99 | 1.16 | 1.11 | 0.0 |
| Quick Ratio | 1.12 | 0.81 | 0.91 | 0.86 | 0.0 |
| D/E | 0.46 | 0.52 | 0.43 | 0.51 | 0.0 |
| Debt-to-Assets | 18.5% | 21.2% | 17.5% | 20.3% | 0.0 |
| Interest Coverage | 114.4 | 76.1 | 30.3 | 29.3 | 26.4 |
| Asset Turnover | 0.43 | 0.43 | 0.51 | 0.49 | 5382.5 |
| Fixed Asset Turnover | 4.15 | 4.45 | 4.28 | 4.33 | 0.0 |
| Dividend Yield | 2.45% | 2.53% | 3.0% | 3.43% | 2.46% |
Evolution of Financial Ratios
Johnson & Johnson’s Return on Equity surged dramatically in 2025, reflecting exceptional profitability growth. The Current Ratio fell to zero, signaling a loss of liquidity compared to prior years. Debt-to-Equity Ratio improved to zero, indicating a significant reduction in leverage. Overall, profitability showed a robust upward trend, while liquidity weakened substantially.
Are the Financial Ratios Favorable?
In 2025, profitability metrics like net margin (28.46%) and ROE (184,855%) are highly favorable, indicating strong returns. Leverage ratios, including debt-to-equity and debt-to-assets, stand at zero, suggesting minimal debt risk. However, liquidity ratios are unfavorable due to zero current and quick ratios. Market valuation is mixed: P/E is neutral, but the price-to-book ratio is excessively high and unfavorable. Overall, the financial ratios lean favorably despite liquidity concerns.
Shareholder Return Policy
Johnson & Johnson maintains a consistent dividend policy with a payout ratio around 46%, supported by robust free cash flow coverage above 80%. The dividend per share has steadily increased, yielding approximately 2.5%, supplemented by ongoing share buybacks, reinforcing capital return to shareholders.
This balanced approach aligns with sustainable long-term value creation, as dividends remain comfortably covered by cash flow and capital expenditures. The combination of dividends and buybacks reflects prudent capital allocation without risking excessive leverage or unsustainable distributions.
Score analysis
The following radar chart illustrates Johnson & Johnson’s key valuation and performance scores:
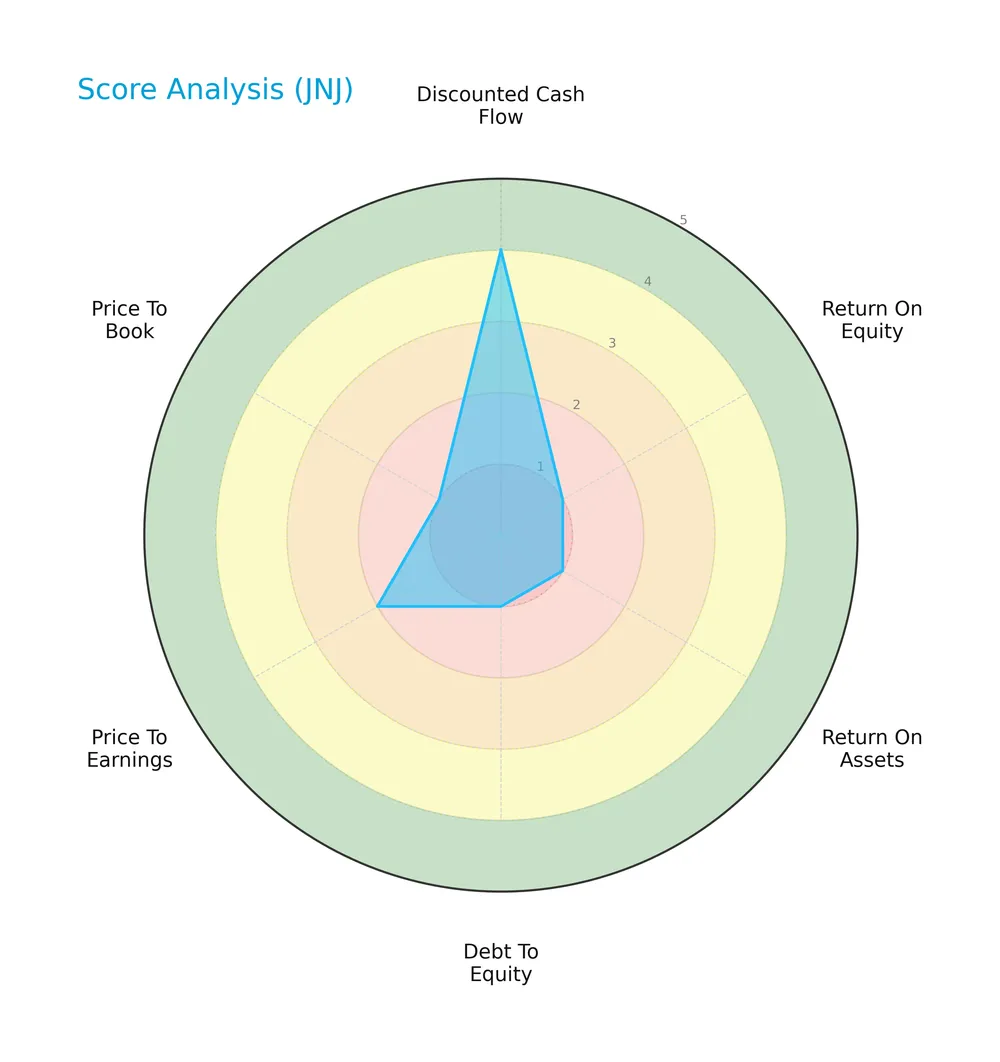
The discounted cash flow score appears favorable at 4, but profitability metrics ROE and ROA score very low at 1 each. Debt to equity and price to book ratios also rate very unfavorable at 1, indicating leverage and valuation concerns. The price to earnings score is slightly better but still unfavorable at 2.
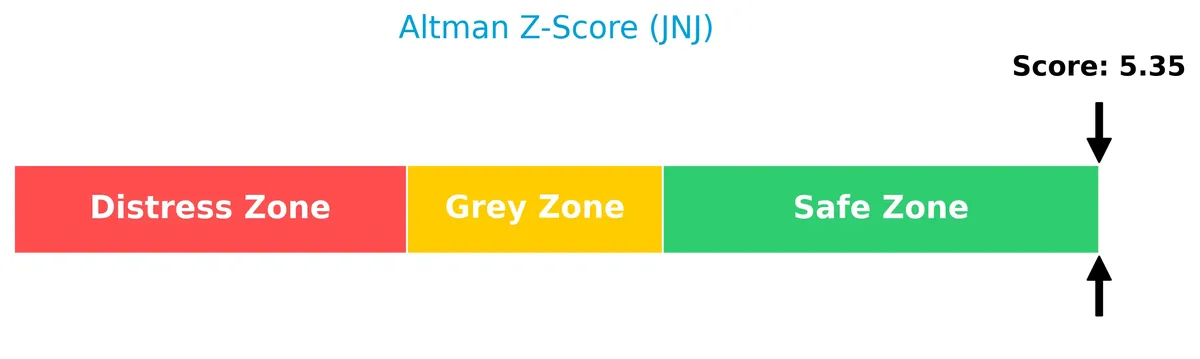
Analysis of the company’s bankruptcy risk
Johnson & Johnson’s Altman Z-Score places it securely in the safe zone, signaling very low bankruptcy risk:
Is the company in good financial health?
This Piotroski diagram highlights Johnson & Johnson’s moderate financial strength:

With a Piotroski score of 4, the company’s financial health is average. This suggests mixed signals on profitability, leverage, and operational efficiency, reflecting neither strong nor weak fundamentals at this time.
Competitive Landscape & Sector Positioning
This section examines Johnson & Johnson’s strategic positioning, revenue segmentation, and key products in the healthcare sector. I will assess whether Johnson & Johnson holds a competitive advantage over its main industry rivals.
Strategic Positioning
Johnson & Johnson divested its Consumer Health segment in 2023, sharpening focus on Innovative Medicine and MedTech. Its revenue is well diversified geographically, with significant exposure to the U.S. (50B), Europe (20B), and Asia-Pacific/Africa (13.6B), targeting hospitals and healthcare professionals globally.
Revenue by Segment
This pie chart illustrates Johnson & Johnson’s revenue distribution by segment for fiscal year 2024, highlighting the company’s primary business drivers.
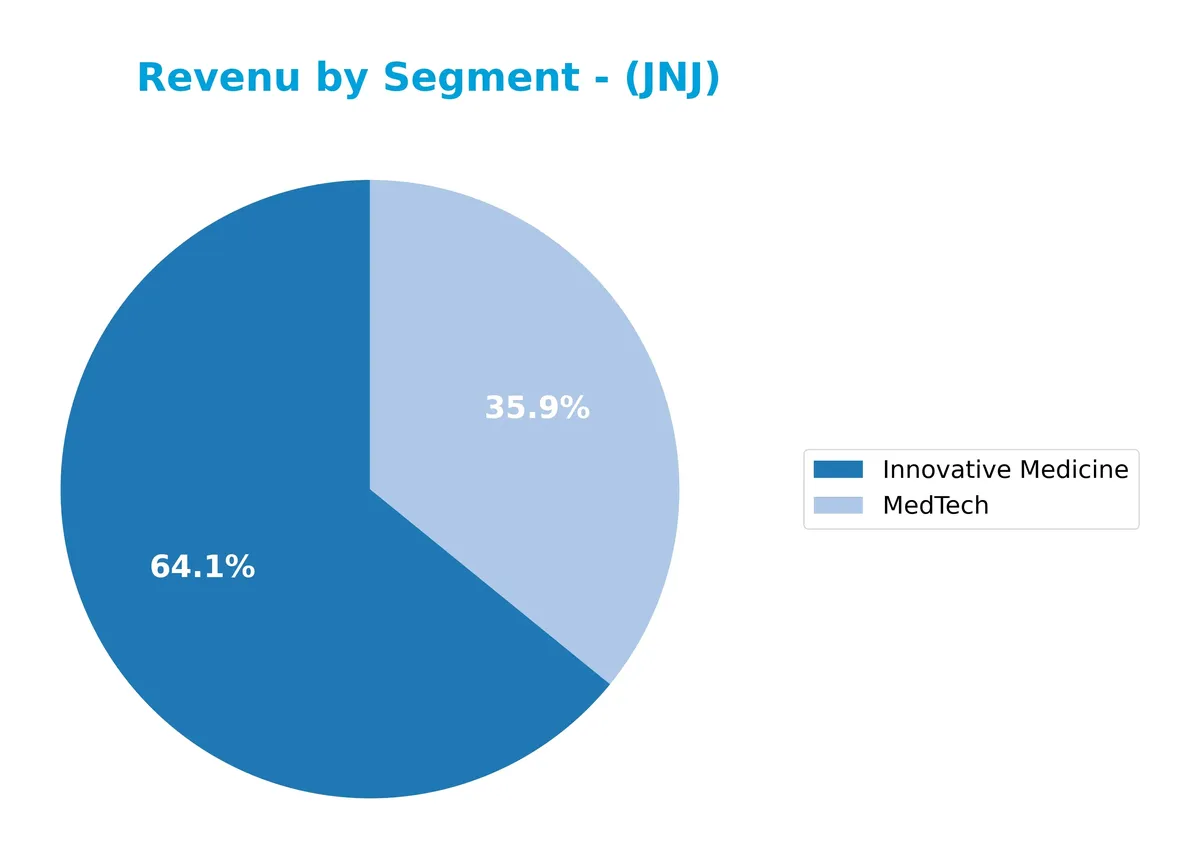
In 2024, Innovative Medicine leads with $57B, followed by MedTech at $32B. These two segments dominate JNJ’s revenue mix, showing steady growth. The absence of Consumer segment data in recent years suggests a strategic focus shift. Innovative Medicine’s acceleration outpaces MedTech’s moderate rise, signaling increasing reliance on pharmaceutical innovation and potential concentration risk in this segment.
Key Products & Brands
The table below outlines Johnson & Johnson’s main products and brands across its current operational segments:
| Product | Description |
|---|---|
| Innovative Medicine | Prescription drugs targeting complex diseases such as rheumatoid arthritis, cancers, HIV/AIDS, and neurodegenerative disorders. |
| MedTech | Medical devices including electrophysiology products, neurovascular care, orthopaedics (hips, knees, spine), advanced surgery solutions, and ACUVUE disposable contact lenses. |
Johnson & Johnson’s portfolio now centers on Innovative Medicine and MedTech segments after spinning off Consumer Health brands. These segments address critical healthcare needs with prescription medicines and advanced medical technologies.
Main Competitors
The Healthcare sector includes 10 main competitors, with this table showing the top 10 leaders by market capitalization:
| Competitor | Market Cap. |
|---|---|
| Eli Lilly and Company | 970B |
| Johnson & Johnson | 500B |
| AbbVie Inc. | 405B |
| AstraZeneca PLC | 285B |
| Merck & Co., Inc. | 268B |
| Amgen Inc. | 176B |
| Gilead Sciences, Inc. | 151B |
| Pfizer Inc. | 143B |
| Bristol-Myers Squibb Company | 109B |
| Biogen Inc. | 26B |
Johnson & Johnson ranks 2nd among its competitors, holding about 60% of the market cap of Eli Lilly, the sector leader. It sits above both the average market cap of the top 10 (303B) and the median of the sector (222B). The company maintains a 67% market cap advantage over its closest rival, AbbVie, illustrating a strong second-place position in this competitive landscape.
Comparisons with competitors
Check out how we compare the company to its competitors:
Does JNJ have a competitive advantage?
Johnson & Johnson demonstrates a very favorable competitive advantage, consistently creating value with a ROIC far exceeding its WACC and a growing ROIC trend. Its strong profitability and efficient capital use underline a sustainable moat in the drug manufacturing and medical devices sectors.
Looking ahead, JNJ focuses on innovation-driven segments like pharmaceuticals for complex diseases and advanced MedTech solutions, positioning itself to capitalize on emerging healthcare needs and expanding global markets.
SWOT Analysis
This analysis highlights Johnson & Johnson’s key strategic factors to inform investment decisions.
Strengths
- strong global brand
- high ROIC well above WACC
- diversified healthcare segments
Weaknesses
- weak liquidity ratios (current and quick)
- high price-to-book ratio
- slower revenue growth recently
Opportunities
- growth in Innovative Medicine
- expansion in emerging markets
- advancements in MedTech technologies
Threats
- regulatory risks in pharmaceuticals
- intense industry competition
- patent expirations on key drugs
Johnson & Johnson’s robust profitability and moat support long-term value creation. However, weak liquidity and valuation metrics require cautious monitoring. Strategic focus on innovation and emerging markets can drive future growth.
Stock Price Action Analysis
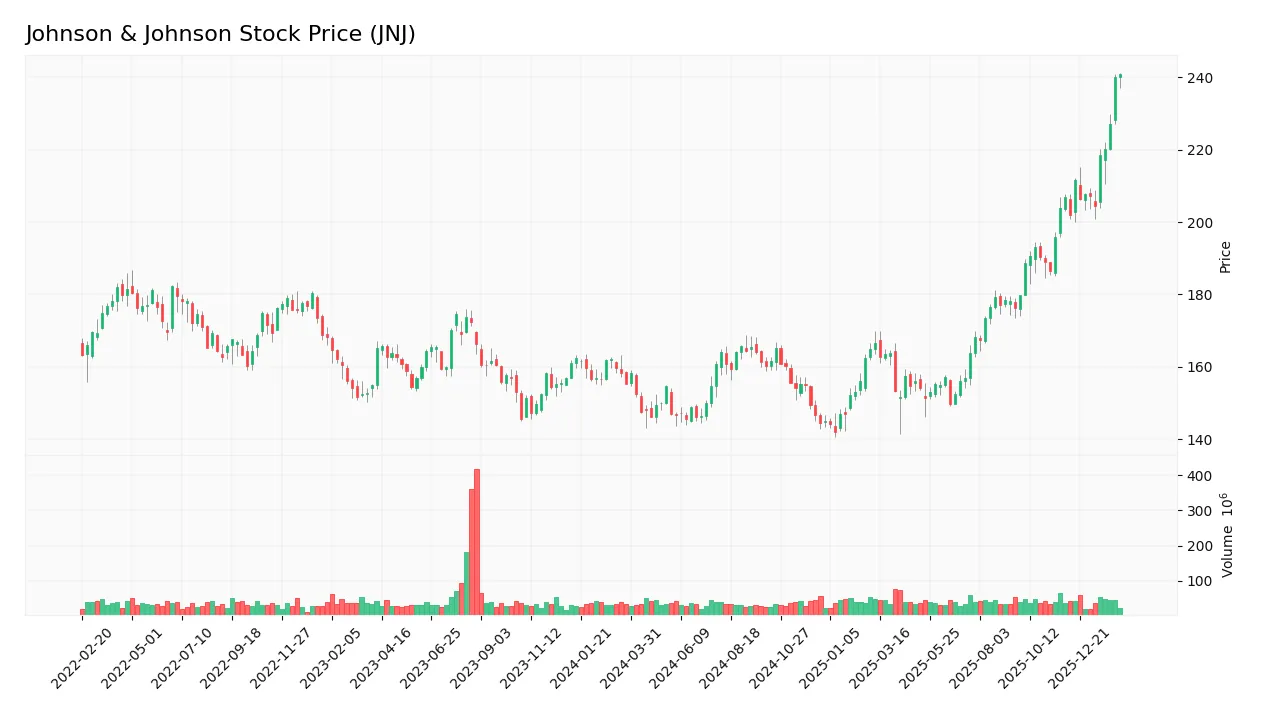
The upcoming weekly chart displays Johnson & Johnson’s stock price movement over the past 12 months, highlighting key trend patterns and volatility:
Trend Analysis
Over the past year, JNJ’s stock price rose by 55.16%, confirming a bullish trend with accelerating momentum. The price fluctuated between 142.06 and 240.86, reflecting significant volatility (std. dev. 22.48). Recent three-month data show a 16.4% gain and a positive slope of 3.23, sustaining upward acceleration.
Volume Analysis
Trading volume has increased, with buyers dominating 66.63% of activity in the last three months. Buyer volume reached 315M versus seller volume of 158M, signaling strong investor demand and heightened market participation favoring accumulation.
Target Prices
Analysts set a solid target consensus for Johnson & Johnson, reflecting moderate upside potential.
| Target Low | Target High | Consensus |
|---|---|---|
| 190 | 265 | 229.33 |
The target range signals cautious optimism, with the consensus suggesting a 10-15% upside from current levels.

Don’t Let Luck Decide Your Entry Point
Optimize your entry points with our advanced ProRealTime indicators. You’ll get efficient buy signals with precise price targets for maximum performance. Start outperforming now!
Analyst & Consumer Opinions
This section examines recent analyst ratings and consumer feedback to provide insight into Johnson & Johnson’s market perception.
Stock Grades
Here are the latest verified stock grades for Johnson & Johnson from leading financial institutions:
| Grading Company | Action | New Grade | Date |
|---|---|---|---|
| RBC Capital | Maintain | Outperform | 2026-02-03 |
| Morgan Stanley | Upgrade | Overweight | 2026-01-28 |
| Freedom Capital Markets | Maintain | Hold | 2026-01-27 |
| Guggenheim | Maintain | Buy | 2026-01-23 |
| Citigroup | Maintain | Buy | 2026-01-22 |
| Wells Fargo | Maintain | Overweight | 2026-01-22 |
| TD Cowen | Maintain | Buy | 2026-01-22 |
| Scotiabank | Maintain | Sector Outperform | 2026-01-22 |
| Morgan Stanley | Maintain | Equal Weight | 2026-01-22 |
| Stifel | Maintain | Hold | 2026-01-22 |
The grades show a predominantly positive outlook, with most firms maintaining Buy or Outperform ratings. Morgan Stanley’s recent upgrade to Overweight highlights growing confidence, while a balanced mix of Hold ratings reflects measured caution.
Consumer Opinions
Consumers often express strong loyalty to Johnson & Johnson, praising product quality and trustworthiness.
| Positive Reviews | Negative Reviews |
|---|---|
| “Reliable healthcare products that work effectively.” | “Pricing feels steep for some over-the-counter items.” |
| “Excellent customer service and fast responses.” | “Occasional delays in product availability.” |
| “Trusted brand with consistent product safety.” | “Packaging could be more environmentally friendly.” |
Overall, consumers appreciate Johnson & Johnson’s consistent quality and reliability. However, concerns about pricing and sustainability appear repeatedly, signaling areas for improvement.
Risk Analysis
Below is a summary of key risks facing Johnson & Johnson to consider in your investment analysis:
| Category | Description | Probability | Impact |
|---|---|---|---|
| Valuation Risk | Extremely high price-to-book ratio signals possible overvaluation | Medium | High |
| Liquidity Risk | Zero current and quick ratios indicate potential short-term liquidity issues | Low | Medium |
| Operational Risk | Dependence on innovation in pharmaceuticals and medical devices | Medium | High |
| Market Risk | Low beta (0.35) suggests limited downside volatility in market downturns | Low | Medium |
| Credit Risk | Strong interest coverage ratio (33.55) reduces default risk | Low | Low |
| Financial Health | Piotroski score of 4 reflects average financial strength | Medium | Medium |
Valuation risk is the most pressing concern due to the unusually high price-to-book ratio, which could signal overpricing. Liquidity metrics are unfavorable but balanced by a safe Altman Z-score, indicating low bankruptcy risk. I monitor J&J’s innovation pipeline closely as it drives sustainable growth in a competitive healthcare sector.
Should You Buy Johnson & Johnson?
Johnson & Johnson appears to be creating strong value with a durable competitive moat and growing profitability. Despite a very favorable moat and safe Altman Z-Score, its overall rating at C suggests operational and leverage profiles could invite caution.
Strength & Efficiency Pillars
Johnson & Johnson exhibits robust profitability with a net margin of 28.46% and a return on equity (ROE) soaring at 184,855%. The return on invested capital (ROIC) stands at an extraordinary 236,601%, vastly exceeding the weighted average cost of capital (WACC) of 5.39%. This clearly marks the company as a value creator. Its operational efficiency shines through favorable gross margin (72.78%) and EBIT margin (34.59%), underpinning a sustainable competitive advantage with growing profitability.
Weaknesses and Drawbacks
Despite strong operational metrics, Johnson & Johnson’s valuation signals caution. The price-to-book ratio is an extreme 34,764, presenting a severe overvaluation risk. Additionally, liquidity ratios such as the current and quick ratios are both zero, indicating potential short-term liquidity stress. Although its debt-to-equity and debt-to-assets ratios are favorable, the imbalance in liquidity and valuation metrics could pressure the stock, especially if market sentiment shifts.
Our Final Verdict about Johnson & Johnson
The company’s long-term fundamentals appear robust, supported by a strong moat and excellent profitability metrics. Its bullish overall trend and buyer-dominant recent period reinforce positive momentum. However, the stretched valuation and liquidity concerns suggest a cautious stance. Johnson & Johnson’s profile might appear attractive for long-term exposure but could require a selective entry point given the valuation extremes and liquidity red flags.
Disclaimer: This content is for informational purposes only and does not constitute financial, investment, or other professional advice. Investing in financial markets involves a significant risk of loss, and past performance is not indicative of future results.
Additional Resources
- Johnson on calls for Lutnick to resign over Epstein ties: ‘Absurd’ – The Hill (Feb 11, 2026)
- U.S. Olympic skier Breezy Johnson has plans for her broken and repaired gold medal – CBS News (Feb 11, 2026)
- Johnson says he has urged Florida Republican to stay in Congress – Politico (Feb 11, 2026)
- GOP defectors help spike House measure to block tariff disapproval votes – CNBC (Feb 10, 2026)
- Mitch Johnson says 2-seed Spurs should’ve had more All-Stars – ESPN (Feb 11, 2026)
For more information about Johnson & Johnson, please visit the official website: jnj.com