In the ever-evolving landscape of industrial machinery, two companies stand out: Hillenbrand, Inc. (HI) and Kadant Inc. (KAI). Both firms operate within the same industry, providing innovative solutions and equipment to a diverse range of sectors. Hillenbrand focuses on advanced process solutions and molding technology, while Kadant excels in fluid-handling systems and industrial processing. As investors, understanding their strategies and market positions is crucial. Join me as we explore which of these companies presents the most compelling opportunity for investment.

Table of contents
Company Overview
Hillenbrand, Inc. Overview
Hillenbrand, Inc. operates as a diversified industrial company, focusing on providing advanced process solutions and molding technology. Founded in 1906 and headquartered in Batesville, Indiana, Hillenbrand serves a wide array of industries, including plastics, pharmaceuticals, and funeral services. The company is structured into three segments: Advanced Process Solutions, Molding Technology Solutions, and Batesville, which specializes in funeral products. With a market capitalization of approximately $2.23B, Hillenbrand emphasizes innovation and customer service, making it a key player in the industrial machinery sector.
Kadant Inc. Overview
Kadant Inc., incorporated in 1991 and based in Westford, Massachusetts, specializes in engineered systems and technologies for diverse industrial applications. Its operations are segmented into Flow Control, Industrial Processing, and Material Handling, providing fluid-handling systems, recycling equipment, and biodegradable absorbent materials, among others. With a market cap of around $3.27B, Kadant is recognized for its focus on sustainability and efficiency, catering primarily to the packaging and tissue industries.
Key Similarities and Differences
Both Hillenbrand and Kadant operate in the industrial machinery sector, focusing on advanced technologies and systems. However, while Hillenbrand has a notable emphasis on funeral services alongside its industrial offerings, Kadant is more focused on fluid handling and materials processing. Additionally, Hillenbrand’s larger employee base indicates a broader operational scope compared to Kadant’s more specialized approach.
Income Statement Comparison
The following table compares the most recent income statements of Hillenbrand, Inc. (HI) and Kadant Inc. (KAI), highlighting their revenue, profitability, and earnings metrics.
| Metric | Hillenbrand, Inc. (HI) | Kadant Inc. (KAI) |
|---|---|---|
| Revenue | 2.67B | 1.05B |
| EBITDA | 230M | 223M |
| EBIT | 92M | 173M |
| Net Income | 43M | 112M |
| EPS | 0.74 | 9.51 |
Interpretation of Income Statement
In the most recent year, Hillenbrand, Inc. experienced a decline in revenue to 2.67B, down from 3.18B the previous year, resulting in a lower EBITDA of 230M. Conversely, Kadant Inc. reported strong revenue growth to 1.05B with steady EBITDA margins of 21%. While Hillenbrand’s net income fell to 43M, Kadant’s net income increased to 112M, reflecting stronger operational efficiency and effective cost management. Overall, Kadant appears to be in a more favorable position, demonstrating growth in both revenue and profitability, while Hillenbrand needs to address the decline in margins and income stability.
Financial Ratios Comparison
The following table compares key financial ratios for Hillenbrand, Inc. (HI) and Kadant Inc. (KAI) as of the latest fiscal year.
| Metric | Hillenbrand, Inc. (HI) | Kadant Inc. (KAI) |
|---|---|---|
| ROE | 3.66% | 13.17% |
| ROIC | -32.60% | 10.08% |
| P/E | 36.69 | 28.26 |
| P/B | 1.34 | 4.24 |
| Current Ratio | 1.22 | 2.31 |
| Quick Ratio | 0.88 | 1.55 |
| D/E | 1.12 | 0.38 |
| Debt-to-Assets | 35.86% | 11.57% |
| Interest Coverage | 0.55 | 8.55 |
| Asset Turnover | 0.60 | 0.74 |
| Fixed Asset Turnover | 7.80 | 6.18 |
| Payout Ratio | 121.69% | 13.15% |
| Dividend Yield | 3.32% | 0.36% |
Interpretation of Financial Ratios
Hillenbrand’s financial ratios indicate underlying weaknesses, particularly in return metrics (ROE and ROIC), suggesting inefficiency in generating profits from equity and invested capital. The high debt-to-equity ratio and low interest coverage raise concerns about financial stability. In contrast, Kadant shows strong performance, especially in profitability and liquidity, evidenced by a higher ROE and lower debt levels, making it a more attractive investment choice.
Dividend and Shareholder Returns
Hillenbrand, Inc. (HI) offers a dividend with a payout ratio of 121.69%, reflecting a trend of increasing dividends per share, currently at $0.90. Despite this, the high payout raises concerns over sustainability given negative net income margins. Meanwhile, Kadant Inc. (KAI) also pays dividends, but with a more conservative payout ratio of 13.15%, aligning with its solid growth strategy. Both companies demonstrate a commitment to shareholder returns; however, HI’s unsustainable distribution poses risks, whereas KAI’s approach appears more aligned with long-term value creation.
Strategic Positioning
Hillenbrand, Inc. (HI) holds a market cap of $2.23B, focusing on diverse industrial solutions across various sectors. Its Advanced Process Solutions segment is gaining traction, which is crucial in a market characterized by rapid technological disruption. Kadant Inc. (KAI), with a market cap of $3.27B, leads in flow control and material handling, showcasing robust competitive pressure. Both companies must navigate evolving market dynamics and technological advancements to maintain their positions effectively.
Stock Comparison
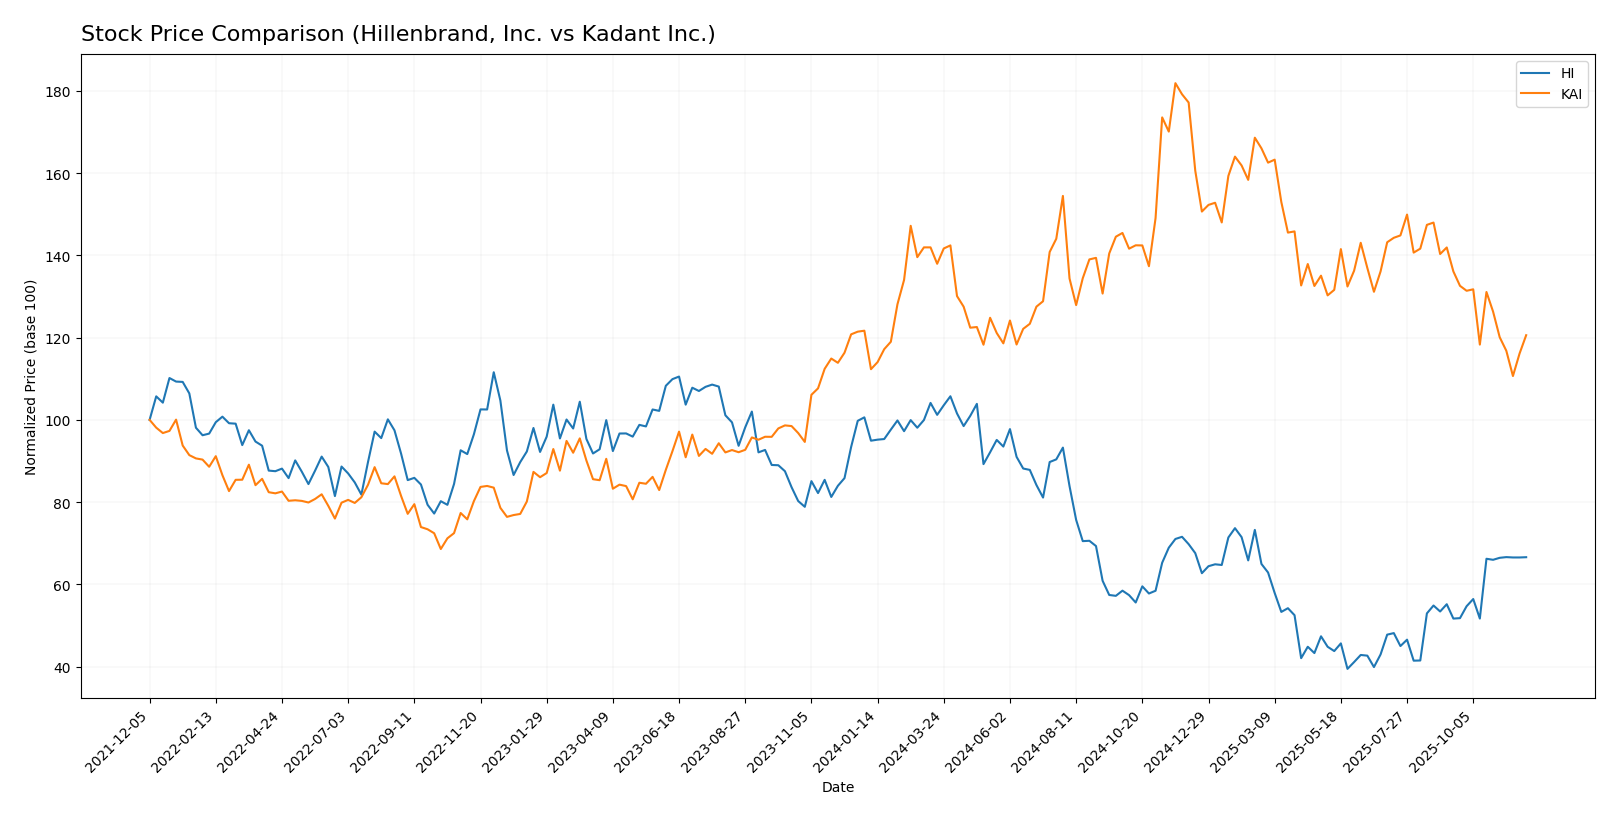
In this section, I will analyze the weekly stock price movements for Hillenbrand, Inc. (HI) and Kadant Inc. (KAI) over the past year, highlighting key price dynamics and trading behaviors.

Trend Analysis
Hillenbrand, Inc. (HI) Over the past year, HI has experienced a significant percentage change of -29.86%, indicating a bearish trend. Despite a recent uptick of 28.9% from mid-September to late November 2025, the overall trend shows acceleration in the downward movement. The stock reached a high of 50.29 and a low of 18.75, with a standard deviation of 9.44, suggesting notable volatility in its price movements.
Kadant Inc. (KAI) In contrast, KAI has shown a positive percentage change of 7.36% over the past year, marking a bullish trend. However, the recent trend indicates a decline of -11.4% from September 14 to November 30, 2025, with a trend slope of -4.34, suggesting deceleration in its upward trajectory. The stock has fluctuated between a high of 419.01 and a low of 254.91, with a standard deviation of 35.6, reflecting considerable price volatility as well.
Both stocks exhibit distinct trading patterns, with HI currently facing challenges and KAI showing resilience, although its recent performance warrants caution.
Analyst Opinions
Recent recommendations for Hillenbrand, Inc. (HI) and Kadant Inc. (KAI) show a consensus rating of B+. Analysts highlight solid discounted cash flow scores (4) and strong return on assets (5) for both companies. However, concerns about debt-to-equity ratios and price-to-earnings ratios remain. Analysts suggest a “hold” strategy, indicating caution in the current market environment. Notably, both companies exhibit strong fundamentals but suggest potential for improvement in risk areas. Overall, the consensus leans towards a cautious buy for 2025.
Stock Grades
In the current market landscape, it’s important to keep an eye on stock ratings from reliable sources. Here are the latest grades for Hillenbrand, Inc. and Kadant Inc.
Hillenbrand, Inc. Grades
| Grading Company | Action | New Grade | Date |
|---|---|---|---|
| DA Davidson | Maintain | Neutral | 2025-11-20 |
| DA Davidson | Maintain | Neutral | 2025-10-16 |
| CJS Securities | Downgrade | Market Perform | 2025-10-16 |
| Keybanc | Downgrade | Sector Weight | 2025-05-08 |
| DA Davidson | Maintain | Neutral | 2025-05-01 |
| DA Davidson | Maintain | Neutral | 2024-11-15 |
| Keybanc | Maintain | Overweight | 2024-11-14 |
| DA Davidson | Downgrade | Neutral | 2024-08-12 |
| DA Davidson | Maintain | Buy | 2021-02-08 |
| DA Davidson | Maintain | Buy | 2021-02-07 |
Kadant Inc. Grades
| Grading Company | Action | New Grade | Date |
|---|---|---|---|
| Barrington Research | Maintain | Outperform | 2025-10-30 |
| Barrington Research | Maintain | Outperform | 2025-10-29 |
| Barrington Research | Maintain | Outperform | 2025-10-27 |
| Barrington Research | Maintain | Outperform | 2025-10-10 |
| Barrington Research | Maintain | Outperform | 2025-09-23 |
| DA Davidson | Maintain | Neutral | 2025-08-04 |
| Barrington Research | Maintain | Outperform | 2025-07-30 |
| Barrington Research | Maintain | Outperform | 2025-07-29 |
| Barrington Research | Maintain | Outperform | 2025-05-01 |
| DA Davidson | Maintain | Neutral | 2025-05-01 |
Overall, both companies show a mix of maintenance and downgrades in their grades, with Hillenbrand experiencing some downward adjustments while Kadant maintains a strong “Outperform” rating from Barrington Research. This suggests that while Kadant may present a more favorable investment opportunity currently, Hillenbrand’s outlook remains stable but cautious.
Target Prices
The consensus target prices for Hillenbrand, Inc. (HI) and Kadant Inc. (KAI) indicate a cautious outlook from analysts.
| Company | Target High | Target Low | Consensus |
|---|---|---|---|
| Hillenbrand, Inc. | 32 | 32 | 32 |
| Kadant Inc. | 410 | 275 | 342.5 |
For Hillenbrand, the consensus target price aligns closely with its current stock price of 31.67, suggesting limited upside. Conversely, Kadant’s consensus of 342.5 is significantly higher than its current price of 277.79, indicating potential for growth in the future.
Strengths and Weaknesses
Below is a comparison of the strengths and weaknesses of Hillenbrand, Inc. (HI) and Kadant Inc. (KAI).
| Criterion | Hillenbrand, Inc. (HI) | Kadant Inc. (KAI) |
|---|---|---|
| Diversification | Moderate (3 segments) | Strong (3 segments) |
| Profitability | Low (Net margin: 2%) | High (Net margin: 10%) |
| Innovation | Moderate investment | High investment |
| Global presence | Limited (US focus) | Strong (Global) |
| Market Share | Moderate | High |
| Debt level | High (Debt/Equity: 1.12) | Low (Debt/Equity: 0.38) |
Key takeaways indicate that while both companies operate in the industrial machinery sector, Kadant Inc. shows stronger profitability, lower debt levels, and a broader global presence compared to Hillenbrand, Inc.
Risk Analysis
In this section, I present a risk analysis for two companies, Hillenbrand, Inc. (HI) and Kadant Inc. (KAI). The table highlights key risks associated with each company.
| Metric | Hillenbrand, Inc. | Kadant Inc. |
|---|---|---|
| Market Risk | Medium | Medium |
| Regulatory Risk | High | Medium |
| Operational Risk | Medium | Low |
| Environmental Risk | Medium | Low |
| Geopolitical Risk | High | Medium |
Both companies face significant market and regulatory risks, particularly as they operate within the industrial sector, which is highly influenced by economic conditions and regulatory changes. As of 2024, rising global tensions and regulatory scrutiny pose substantial challenges.
Which one to choose?
When comparing Hillenbrand, Inc. (HI) and Kadant Inc. (KAI), both companies exhibit solid fundamentals but diverge in growth potential and risk factors. HI has a market cap of $1.91B, with a recent net income of $43.1M and a bearish stock trend (-29.86%). Its profitability ratios show struggles, particularly with a net profit margin of 1.9%, and it faces significant debt challenges. Conversely, KAI boasts a market cap of $4.12B, with a net income of $111.6M and a bullish stock trend (7.36%). KAI’s profitability is stronger, reflected in higher margins and lower debt ratios.
For investors focused on growth and higher returns, KAI appears favorable due to its upward trend and better profitability metrics, while those prioritizing stability might find HI appealing, albeit with caution due to its debt levels. However, investors should be wary of KAI’s recent price fluctuations and HI’s dependence on market conditions.
Disclaimer: This article is not financial advice. Each investor is responsible for their own investment decisions.
Go further
I encourage you to read the complete analyses of Hillenbrand, Inc. and Kadant Inc. to enhance your investment decisions:


