Hillenbrand, Inc. and JBT Marel Corporation are two prominent players in the industrial machinery sector, offering innovative solutions across process and material handling industries. While Hillenbrand focuses on diversified industrial equipment and funeral services products, JBT Marel specializes in advanced food and beverage processing technologies. This comparison explores their market positions and innovation strategies to help you identify which company presents the most compelling investment opportunity today.
Table of contents
Companies Overview
I will begin the comparison between Hillenbrand, Inc. and JBT Marel Corporation by providing an overview of these two companies and their main differences.
Hillenbrand, Inc. Overview
Hillenbrand, Inc. is a diversified industrial company operating in the United States and internationally. It serves multiple sectors through three segments: Advanced Process Solutions, Molding Technology Solutions, and Batesville, which focuses on funeral services products. The company designs and manufactures equipment for industries including plastics, food, pharmaceuticals, automotive, and memorialization, positioning itself as a multi-industry machinery provider.
JBT Marel Corporation Overview
JBT Marel Corporation specializes in technology solutions for the global food and beverage industry, offering processing and packaging equipment. Its portfolio includes systems for chilling, mixing, forming, cooking, and packaging across a variety of food sectors such as meat, seafood, bakery, and pharmaceuticals. The company also provides automated material handling solutions and serves diverse markets including manufacturing and healthcare.
Key similarities and differences
Both companies operate within the industrial machinery sector with a focus on providing equipment and systems that enhance production processes. Hillenbrand has a more diversified business model with a notable segment in funeral services, while JBT Marel is more specialized in food and beverage processing technology. JBT Marel also extends into automated material handling, contrasting with Hillenbrand’s broader range of industrial applications.
Income Statement Comparison
The following table compares key income statement metrics for Hillenbrand, Inc. and JBT Marel Corporation for their most recent fiscal years, providing a concise financial snapshot.
| Metric | Hillenbrand, Inc. (2025) | JBT Marel Corporation (2024) |
|---|---|---|
| Market Cap | 2.23B | 8.02B |
| Revenue | 2.67B | 1.72B |
| EBITDA | 231M | 204M |
| EBIT | 92.1M | 115M |
| Net Income | 43.1M | 85.4M |
| EPS | 0.74 | 2.67 |
| Fiscal Year | 2025 | 2024 |
Income Statement Interpretations
Hillenbrand, Inc. experienced a revenue decline of nearly 16% from 2024 to 2025, with net income turning positive after a significant loss the previous year. Gross margin remained stable at 33.7%, while EBIT margin was neutral at 3.44%. The most recent year showed a strong rebound in EBIT and net margin growth, indicating improved profitability despite lower sales.
JBT Marel Corporation’s revenue showed slight growth of 3.1% from 2023 to 2024, with gross margin improving to 36.5%. However, EBIT declined by over 35%, and net income and EPS dropped sharply by around 85%, reflecting margin pressures. The company’s net margin remained neutral but deteriorated sharply in the latest year, signaling challenges in controlling costs or other expenses.
Which one has the stronger fundamentals?
Hillenbrand demonstrates stronger fundamentals with a favorable overall income statement evaluation, marked by margin stability and significant profit recovery despite revenue decline. In contrast, JBT Marel shows mixed signals, including modest revenue growth but deteriorating profitability and unfavorable net margin trends. Hillenbrand’s recent earnings improvement outweighs JBT Marel’s margin contraction in this comparison.
Financial Ratios Comparison
The table below presents a side-by-side comparison of key financial ratios for Hillenbrand, Inc. (HI) and JBT Marel Corporation (JBTM) for their most recent fiscal year, 2024, allowing investors to assess operational efficiency, profitability, liquidity, leverage, and dividend metrics.
| Ratios | Hillenbrand, Inc. (HI) 2024 | JBT Marel Corporation (JBTM) 2024 |
|---|---|---|
| ROE | -14.83% | 5.53% |
| ROIC | 8.82% | 3.65% |
| P/E | -9.28 | 47.63 |
| P/B | 1.38 | 2.63 |
| Current Ratio | 1.27 | 3.48 |
| Quick Ratio | 0.83 | 3.04 |
| D/E (Debt-to-Equity) | 1.44 | 0.81 |
| Debt-to-Assets | 39.25% | 36.68% |
| Interest Coverage | 2.03 | 6.10 |
| Asset Turnover | 0.61 | 0.50 |
| Fixed Asset Turnover | 6.56 | 7.34 |
| Payout Ratio | -29.62% | 15.34% |
| Dividend Yield | 3.19% | 0.32% |
Interpretation of the Ratios
Hillenbrand, Inc. shows several unfavorable ratios, including a low net margin of 1.95% and negative return on invested capital at -32.6%, reflecting challenges in profitability and capital efficiency. The company maintains a reasonable price-to-book ratio of 1.34 and a stable dividend yield of 3.32%, supported by dividend payments, though high debt-equity and weak interest coverage ratios suggest financial risk.
JBT Marel Corporation exhibits similarly mixed metrics with a net margin of 4.98% and modest return on equity at 5.53%, both marked unfavorable. Its current ratio is very high at 3.48, rated unfavorable, but interest coverage and quick ratio are favorable, indicating sound liquidity management. The dividend yield is low at 0.32%, suggesting limited shareholder returns through dividends.
Which one has the best ratios?
Both Hillenbrand and JBT Marel have an identical ratio profile distribution with 28.57% favorable, 42.86% unfavorable, and 28.57% neutral metrics, and both are rated globally unfavorable. Hillenbrand’s stronger dividend yield contrasts with JBT’s better interest coverage and quick ratio. Each displays strengths and weaknesses, with no clear overall superior ratio profile.
Strategic Positioning
I will now compare Hillenbrand and JBT Marel’s positioning to understand their respective business strategies better.
Hillenbrand Positioning
Hillenbrand operates as a diversified industrial company with three segments: Process Equipment, Milacron, and Batesville, targeting multiple industries such as plastics, food, and funeral services. The Process Equipment Group leads revenue, though its contribution fluctuated, with a peak at 2.29B in 2024 and a decline to 2.07B in 2025. Milacron showed a sharp revenue drop from 894M in 2024 to 604M in 2025. Batesville was a smaller but steady contributor in prior years. The recent year saw a slowdown in Milacron’s performance and a decrease in Process Equipment sales.
JBT Marel Positioning
JBT Marel specializes in technology solutions for food and beverage processing, covering a broad range of industries including pharmaceuticals and manufacturing. Despite its significant market cap of 8B, no segmented revenue data was provided, indicating less transparency or a different reporting style. JBT Marel’s product portfolio spans from processing to packaging with a global footprint. The company’s recent performance shows a price increase of 1.7%, reflecting positive investor sentiment amid steady sector engagement.
Hillenbrand vs JBT Marel Positioning
Hillenbrand pursues a diversified product portfolio across industrial machinery and funeral products, which spreads risk but may dilute focus. JBT Marel appears concentrated on food and beverage processing technology with extensive sector coverage, potentially benefiting from specialization but facing sector-specific risks. Each approach balances breadth and depth differently, influencing competitive and technological adaptability.
Stock Comparison
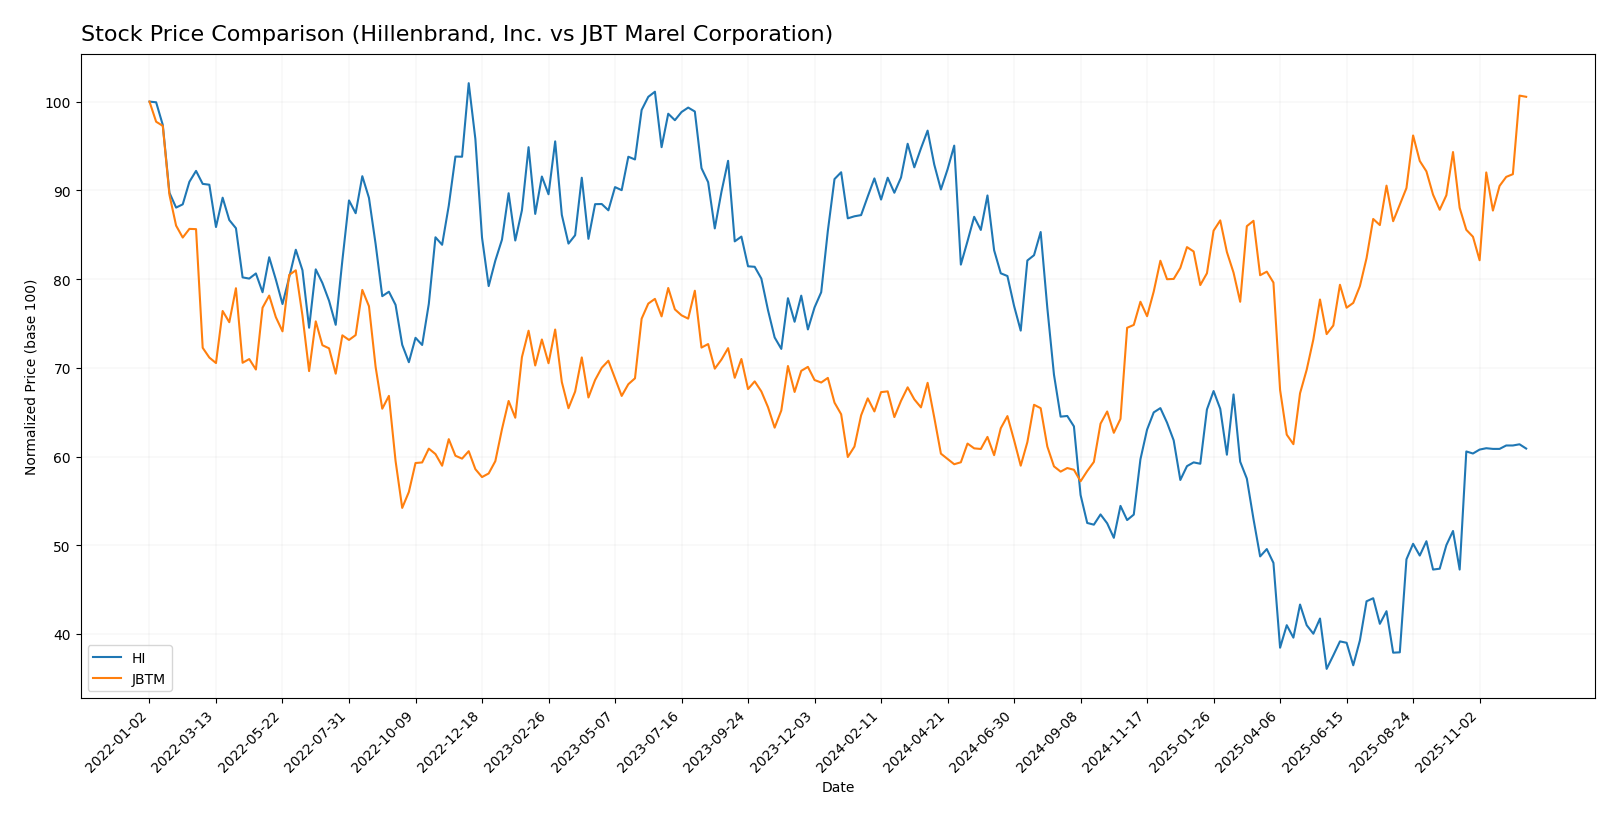
The stock price movements over the past 12 months reveal contrasting dynamics, with Hillenbrand, Inc. experiencing a significant decline followed by recent recovery, while JBT Marel Corporation maintains a strong upward trajectory marked by accelerating gains.
Trend Analysis
Hillenbrand, Inc. shows a bearish trend over the past year with a price decrease of 31.81%, accompanied by accelerating downward momentum and notable volatility (std deviation 9.19). Recent months indicate a strong rebound with an 18.0% increase.
JBT Marel Corporation exhibits a bullish trend with a 51.07% price rise over the past year, supported by acceleration and higher volatility (std deviation 18.23). The recent 6.6% gain continues this upward momentum, reflecting solid market confidence.
Comparing the two, JBT Marel Corporation has delivered the highest market performance with a 51.07% increase, outperforming Hillenbrand’s overall decline despite its recent recovery phase.
Analyst Opinions Comparison
I will now compare Hillenbrand, Inc. and JBT Marel Corporation’s ratings, grades, and price targets to gauge analysts’ opinions.
HI Rating
Hillenbrand, Inc. holds a B+ rating with an overall score of 3, showing strong return on assets at 5 but a weak debt-to-equity score of 1, reflecting mixed financial strengths.
JBTM Rating
JBT Marel Corporation has a C rating with an overall score of 2, indicating generally weaker financial metrics, including low return on equity and assets, both rated at 1.
Which one is the best rated?
Hillenbrand, Inc. is the best rated with a higher overall score and better financial metrics compared to JBTM, whose scores indicate more risks and lower profitability.
Hillenbrand, Inc. Grades
The following table summarizes recent grades assigned to Hillenbrand, Inc. by reputable grading companies.
| Grading Company | Action | New Grade | Date |
|---|---|---|---|
| DA Davidson | Maintain | Neutral | 2025-11-20 |
| DA Davidson | Maintain | Neutral | 2025-10-16 |
| CJS Securities | Downgrade | Market Perform | 2025-10-16 |
| Keybanc | Downgrade | Sector Weight | 2025-05-08 |
| DA Davidson | Maintain | Neutral | 2025-05-01 |
| DA Davidson | Maintain | Neutral | 2024-11-15 |
| Keybanc | Maintain | Overweight | 2024-11-14 |
| DA Davidson | Downgrade | Neutral | 2024-08-12 |
| DA Davidson | Maintain | Buy | 2021-02-08 |
| DA Davidson | Maintain | Buy | 2021-02-07 |
Overall, the grades for Hillenbrand, Inc. have shown a trend towards neutrality with recent downgrades from more optimistic ratings.
JBT Marel Corporation Grades
This table presents recent grades awarded to JBT Marel Corporation from recognized grading firms.
| Grading Company | Action | New Grade | Date |
|---|---|---|---|
| Jefferies | Upgrade | Buy | 2025-12-10 |
| William Blair | Upgrade | Outperform | 2025-08-06 |
JBT Marel Corporation has experienced recent upgrades, moving from hold or market perform ratings to buy and outperform, indicating increasing analyst confidence.
Grades Comparison of Hillenbrand, Inc. and JBT Marel Corporation
JBT Marel Corporation has received stronger and more recent upgrades compared to Hillenbrand, Inc.’s neutral and downgraded ratings. This difference may influence investors’ perceptions of growth potential and risk profiles between the two.
Target Prices
Analyst consensus target prices indicate moderate upside potential for both companies.
| Company | Target High | Target Low | Consensus |
|---|---|---|---|
| Hillenbrand, Inc. | 32 | 32 | 32 |
| JBT Marel Corporation | 180 | 169 | 174.5 |
Hillenbrand’s target price matches closely with its current price of $31.66, suggesting limited near-term price appreciation. JBT Marel’s consensus target of $174.5 implies a significant upside from its current $154.39 price, reflecting stronger analyst confidence.
Strengths and Weaknesses
The table below provides a comparative overview of key strengths and weaknesses for Hillenbrand, Inc. (HI) and JBT Marel Corporation (JBTM) based on the latest financial and operational data for 2024-2025.
| Criterion | Hillenbrand, Inc. (HI) | JBT Marel Corporation (JBTM) |
|---|---|---|
| Diversification | Operates across industrial machinery and funeral services, with three distinct segments providing some buffer against sector volatility. | Focused on food and beverage technology solutions with a broad industry application but less diversified outside this niche. |
| Profitability | Modest net profit margin ~2.0% (2025), recently recovering from losses; moderate gross margin ~33.7%. | Higher net profit margin ~5.0% (2024), strong gross margin ~36.5%, indicating efficient operations. |
| Innovation | Provides advanced process and molding technologies; innovation focused on industrial machinery and materials handling. | Emphasizes automation and value-added processing in food tech, indicating strong innovation in automation and processing technology. |
| Global presence | International operations but less explicitly detailed; headquartered in the US with a solid domestic base. | Broad global footprint including North America, EMEA, Asia Pacific, and Latin America, supporting diverse market access. |
| Market Share | Mid-sized player with $2.2B market cap; niche segments but no clear market dominance. | Larger market cap $8.0B; well-positioned in food processing tech with strong industry presence. |
| Debt level | High leverage with debt-to-equity ratio >1.1 and debt-to-assets ~36%; financial leverage ~3.1, indicating higher financial risk. | Moderate debt with debt-to-equity ~0.81 and debt-to-assets ~37%; financial leverage ~2.2, reflecting more conservative capital structure. |
In summary, Hillenbrand offers diversification across industries but carries higher financial leverage and modest profitability. JBT Marel shows stronger profitability and innovation in its niche with a more prudent debt profile, benefiting from a broad global presence. Investors should weigh diversification against financial risk and growth potential in their portfolios.
Risk Analysis
Below is a comparative table of key risks for Hillenbrand, Inc. (HI) and JBT Marel Corporation (JBTM) based on the latest available data for 2025:
| Metric | Hillenbrand, Inc. (HI) | JBT Marel Corporation (JBTM) |
|---|---|---|
| Market Risk | Higher beta (1.40) indicates greater volatility; P/E at 36.7 suggests premium valuation with sensitivity to market swings. | Beta near 1.01 signals average market volatility; high P/E at 47.6 implies elevated valuation risk. |
| Regulatory Risk | Diverse industrial sectors expose HI to varying compliance standards, including environmental and safety regulations. | Extensive global operations in food tech subject JBTM to rigorous international food safety and trade regulations. |
| Operational Risk | Complex multi-segment operations with machinery and funeral services increase execution risks and supply chain dependencies. | Heavy reliance on technology innovation and global supply chains may cause disruptions and execution delays. |
| Environmental Risk | Moderate exposure due to industrial processes; focus on sustainability could impact costs and compliance. | Growing pressure in food processing sectors for eco-friendly solutions may affect capital spending and operations. |
| Geopolitical Risk | US-based but international sales mean some exposure to trade tensions and tariffs. | Broad global footprint, particularly in volatile regions, raises geopolitical risk and currency fluctuations. |
In synthesis, Hillenbrand faces significant market risk due to its higher beta and leverage, with operational complexity adding to execution uncertainty. JBT Marel carries elevated regulatory and geopolitical risks given its global reach, alongside market risk from a stretched valuation. Investors should weigh these factors carefully, prioritizing risk management in volatile macroeconomic conditions.
Which Stock to Choose?
Hillenbrand, Inc. (HI) shows a declining revenue with a -16% growth but a favorable global income statement evaluation at 50% positive. Its financial ratios reveal mixed results: 29% favorable but 43% unfavorable, with profitability challenged by a low 3.66% ROE and negative ROIC, and a B+ rating reflecting moderate confidence.
JBT Marel Corporation (JBTM) presents modest revenue growth of 3.1% but an unfavorable global income statement view at 40% negative. Its financial ratios are similarly mixed with 29% favorable and 43% unfavorable, modest profitability indicated by a 5.53% ROE, and a lower C rating suggesting greater caution.
Considering ratings alongside income and financial ratios, HI might appeal to investors seeking a company with improving income performance despite profitability concerns, while JBTM could seem suitable for those tolerating mixed signals amid modest growth. The choice could depend on whether an investor prioritizes income improvement or steadier growth metrics.
Disclaimer: Investment carries a risk of loss of initial capital. The past performance is not a reliable indicator of future results. Be sure to understand risks before making an investment decision.
Go Further
I encourage you to read the complete analyses of Hillenbrand, Inc. and JBT Marel Corporation to enhance your investment decisions: