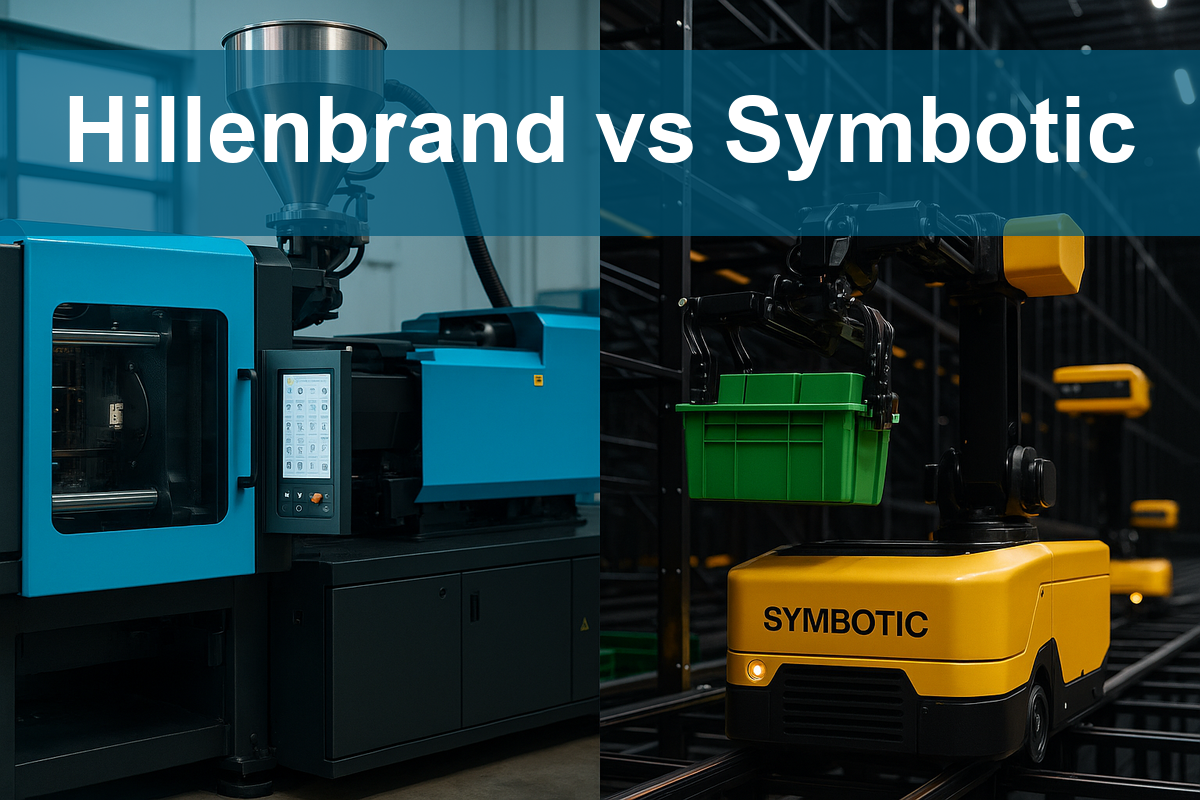
In the dynamic world of industrial machinery, two companies stand out for their unique approaches: Hillenbrand, Inc. (HI) and Symbotic Inc. (SYM). While both operate within the same industry, their strategies diverge significantly—Hillenbrand focuses on diverse manufacturing solutions, whereas Symbotic pioneers automation technology for warehouse efficiency. This article will explore these companies’ innovations and market positions, ultimately revealing which one may be the more intriguing investment opportunity for you.

Table of contents
Company Overview
Hillenbrand, Inc. Overview
Hillenbrand, Inc. operates as a diversified industrial company with a strong presence in the U.S. and international markets. Founded in 1906 and headquartered in Batesville, Indiana, the company is structured into three segments: Advanced Process Solutions, Molding Technology Solutions, and Batesville. Hillenbrand designs and manufactures equipment for various industries, including plastics, food, pharmaceuticals, and automotive. The Batesville segment focuses on funeral services products, including burial and cremation caskets. With a market capitalization of approximately $2.23B, Hillenbrand aims to provide innovative solutions that enhance customer operations and deliver value across its diverse sectors.
Symbotic Inc. Overview
Symbotic Inc. is an automation technology company based in Wilmington, Massachusetts, specializing in robotics and warehouse automation solutions for retailers and wholesalers. Established in 2021, Symbotic has rapidly scaled to provide a full-service automation system designed to optimize warehouse efficiency, reduce operational costs, and maximize inventory management. With a market capitalization of around $52.72B, the company is positioned at the forefront of the industrial technology sector, focusing on transforming supply chain operations through advanced robotics and innovative technology.
Key Similarities and Differences
Both companies operate within the industrial machinery sector, emphasizing efficiency and innovation. However, Hillenbrand offers a broader range of products across multiple industries, while Symbotic specifically focuses on warehouse automation technology. This distinction highlights Hillenbrand’s diversified approach compared to Symbotic’s specialization in robotics and automation solutions.
Income Statement Comparison
Below is a comparative analysis of the most recent Income Statements for Hillenbrand, Inc. and Symbotic Inc., highlighting their financial performance.
| Metric | Hillenbrand, Inc. | Symbotic Inc. |
|---|---|---|
| Revenue | 2.67B | 2.25B |
| EBITDA | 230.6M | -75.4M |
| EBIT | 92.1M | -115.0M |
| Net Income | 43.1M | -80.6M |
| EPS | 0.74 | -0.16 |
Interpretation of Income Statement
In 2025, Hillenbrand, Inc. reported a revenue of 2.67B, down from 3.18B in 2024, indicating a concerning decline. Conversely, Symbotic Inc. saw revenue grow from 1.78B in 2024 to 2.25B in 2025, suggesting positive momentum. Hillenbrand’s net income dropped significantly from a profit in 2024 to 43.1M, while Symbotic continued to report losses. Hillenbrand’s EBITDA margin improved, despite the decline in revenue, indicating better cost management, whereas Symbotic’s margins remain negative, reflecting ongoing operational challenges. Overall, Hillenbrand exhibits more stability, while Symbotic shows potential for growth despite current losses.
Financial Ratios Comparison
The table below summarizes the most recent financial ratios for Hillenbrand, Inc. (HI) and Symbotic Inc. (SYM), providing a clear comparison of their financial health.
| Metric | Hillenbrand, Inc. | Symbotic Inc. |
|---|---|---|
| ROE | 3.66% | -16.67% |
| ROIC | -32.60% | -17.47% |
| P/E | 36.69 | N/A |
| P/B | 1.34 | 11.73 |
| Current Ratio | 1.22 | 1.09 |
| Quick Ratio | 0.88 | 0.99 |
| D/E | 1.12 | 0.00 |
| Debt-to-Assets | 35.86% | 0.00% |
| Interest Coverage | 0.55 | N/A |
| Asset Turnover | 0.60 | 0.94 |
| Fixed Asset Turnover | 7.80 | 19.10 |
| Payout Ratio | 121.69% | 0.00% |
| Dividend Yield | 3.32% | 0.00% |
Interpretation of Financial Ratios
Hillenbrand, Inc. exhibits a moderate current ratio and a concerning high debt-to-equity ratio, indicating potential liquidity issues. Its P/E ratio suggests overvaluation despite positive revenue. In contrast, Symbotic Inc. shows extremely low profitability, highlighted by negative ROE and ROIC. Its high P/B ratio may reflect overvaluation, and the absence of dividends indicates a lack of shareholder returns. Overall, both companies present significant financial risks that investors should consider carefully.
Dividend and Shareholder Returns
Hillenbrand, Inc. (HI) continues to provide dividends with a yield of 3.32% and a payout ratio of 121.7%, indicating a potential risk of unsustainable distributions. In contrast, Symbotic Inc. (SYM) does not pay dividends, focusing instead on reinvesting in growth and innovation, as reflected in its substantial cash reserves. While HI’s dividends offer immediate returns, SYM’s strategy may align with long-term value creation, though it carries inherent risks. Overall, careful evaluation of each company’s approach is crucial for sustainable shareholder returns.
Strategic Positioning
Hillenbrand, Inc. (HI) operates within the industrial machinery sector, holding a market cap of approximately 2.23B. Its diversified segments contribute to a moderate market share, facing competitive pressure primarily from automation firms like Symbotic Inc. (SYM), which boasts a significant market cap of 52.72B. Symbotic’s advanced robotics solutions pose a technological disruption, enhancing efficiency for wholesalers and retailers. Both companies are navigating a landscape characterized by rapid innovation and evolving consumer needs, necessitating agility and strategic foresight.
Stock Comparison
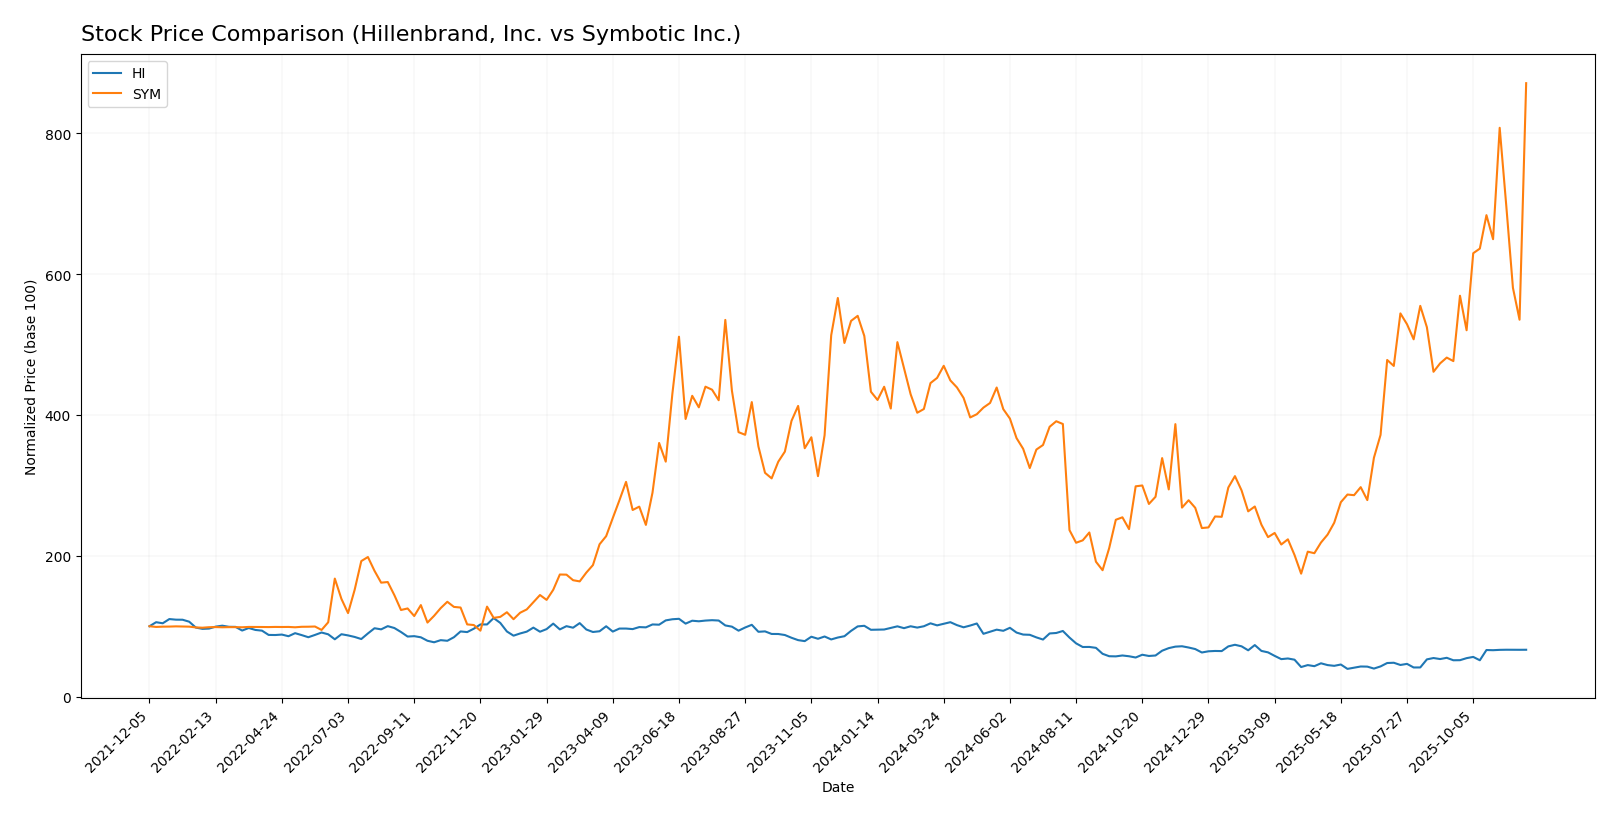
In this section, I will analyze the weekly stock price movements and trading dynamics of Hillenbrand, Inc. (HI) and Symbotic Inc. (SYM) over the past year, highlighting key price changes and trends.

Trend Analysis
Hillenbrand, Inc. (HI) Over the past year, HI has experienced a price change of -29.86%, indicating a bearish trend. The stock has shown notable volatility with a standard deviation of 9.44. The highest price reached was 50.29, while the lowest was 18.75. The trend has been characterized by acceleration, suggesting a significant downward movement.
Symbotic Inc. (SYM) In contrast, SYM has exhibited a remarkable price change of +101.2% over the same period, reflecting a bullish trend. The stock has also shown considerable volatility with a standard deviation of 14.13. The highest price observed was 87.3, and the lowest was 17.5. The trend is marked by acceleration, indicating robust upward momentum.
In summary, HI’s bearish trend contrasts sharply with SYM’s strong bullish performance, highlighting divergent trading dynamics within these two companies.
Analyst Opinions
Recent analyst recommendations indicate a mixed outlook for the two companies. Hillenbrand, Inc. (HI) received a “B+” rating, with analysts highlighting strong performance in discounted cash flow and return on assets, suggesting a “buy” consensus for 2025. On the other hand, Symbotic Inc. (SYM) holds a “C” rating, with analysts noting weaknesses in return on equity and price-to-earnings metrics, leading to a “hold” consensus. I recommend focusing on HI for potential growth while being cautious with SYM due to its lower performance indicators.
Stock Grades
In evaluating the latest stock ratings for Hillenbrand, Inc. (HI) and Symbotic Inc. (SYM), I found several grade updates from credible grading agencies. Below are the detailed grades for each company.
Hillenbrand, Inc. Grades
| Grading Company | Action | New Grade | Date |
|---|---|---|---|
| DA Davidson | Maintain | Neutral | 2025-11-20 |
| DA Davidson | Maintain | Neutral | 2025-10-16 |
| CJS Securities | Downgrade | Market Perform | 2025-10-16 |
| Keybanc | Downgrade | Sector Weight | 2025-05-08 |
| DA Davidson | Maintain | Neutral | 2025-05-01 |
| DA Davidson | Maintain | Neutral | 2024-11-15 |
| Keybanc | Maintain | Overweight | 2024-11-14 |
| DA Davidson | Downgrade | Neutral | 2024-08-12 |
| DA Davidson | Maintain | Buy | 2021-02-08 |
| DA Davidson | Maintain | Buy | 2021-02-07 |
Symbotic Inc. Grades
| Grading Company | Action | New Grade | Date |
|---|---|---|---|
| Baird | Maintain | Neutral | 2025-11-26 |
| Barclays | Maintain | Underweight | 2025-11-26 |
| Craig-Hallum | Upgrade | Buy | 2025-11-25 |
| Citigroup | Maintain | Buy | 2025-11-25 |
| Cantor Fitzgerald | Maintain | Overweight | 2025-11-25 |
| DA Davidson | Maintain | Neutral | 2025-11-25 |
| Northland Capital Markets | Maintain | Outperform | 2025-11-25 |
| UBS | Downgrade | Sell | 2025-09-23 |
| DA Davidson | Downgrade | Neutral | 2025-08-25 |
| Needham | Maintain | Buy | 2025-08-07 |
Overall, the trend for Hillenbrand, Inc. shows a shift towards more cautious ratings, particularly with recent downgrades from “Overweight” to “Neutral.” In contrast, Symbotic Inc. displays a mixed sentiment, with notable upgrades amidst a few downgrades, indicating a more dynamic outlook for this stock.
Target Prices
Recent analyses indicate a consensus on target prices for both Hillenbrand, Inc. (HI) and Symbotic Inc. (SYM).
| Company | Target High | Target Low | Consensus |
|---|---|---|---|
| Hillenbrand, Inc. | 32 | 32 | 32 |
| Symbotic Inc. | 83 | 41 | 67.38 |
For Hillenbrand, the consensus target aligns closely with its current price of 31.67, reflecting stability. In contrast, Symbotic’s target consensus of 67.38 suggests significant upside potential compared to its current price of 87.3.
Strengths and Weaknesses
The following table outlines the strengths and weaknesses of Hillenbrand, Inc. (HI) and Symbotic Inc. (SYM) based on their most recent performance metrics.
| Criterion | Hillenbrand, Inc. (HI) | Symbotic Inc. (SYM) |
|---|---|---|
| Diversification | Strong across multiple segments | Limited focus on automation technology |
| Profitability | Positive net margin of 1.95% | Negative net margin of -3.59% |
| Innovation | Active in various industrial solutions | High emphasis on robotics and automation |
| Global presence | Established international operations | Primarily US-centric |
| Market Share | Moderate within industrial machinery | Emerging in warehouse automation |
| Debt level | Moderate debt-to-equity ratio of 1.12 | No debt reported |
Key takeaways indicate that Hillenbrand, Inc. exhibits greater diversification and profitability compared to Symbotic Inc., which, despite its innovative approach, faces challenges in profitability and market presence. Investors should weigh these factors carefully when considering investments in these companies.
Risk Analysis
The following table summarizes the key risks associated with Hillenbrand, Inc. (HI) and Symbotic Inc. (SYM) for the most recent year.
| Metric | Hillenbrand, Inc. (HI) | Symbotic Inc. (SYM) |
|---|---|---|
| Market Risk | Moderate | High |
| Regulatory Risk | Moderate | High |
| Operational Risk | High | Moderate |
| Environmental Risk | Low | Moderate |
| Geopolitical Risk | Moderate | High |
In summary, Symbotic faces significant challenges, particularly in market and regulatory risks, as its operational metrics reflect instability, indicated by negative margins. Hillenbrand, while also facing risks, shows more resilience in profitability metrics.
Which one to choose?
When comparing Hillenbrand, Inc. (HI) and Symbotic Inc. (SYM), the fundamentals suggest a marked difference in profitability and market performance. Hillenbrand presents a B+ rating, with a net profit margin of 1.9% and a market cap of $1.91B, while Symbotic, rated C, reports a negative net profit margin and a staggering market cap of approximately $31.49B. In terms of stock trends, HI shows a bearish trend with a recent price drop of 29.86%, whereas SYM has experienced a bullish trend, gaining 101.2%. Analysts tend to favor HI for long-term stability and reasonable growth potential, while SYM may attract investors seeking aggressive growth despite its riskier profile.
Recommendation: Investors seeking steady performance may prefer Hillenbrand, while those targeting high-growth potential might lean towards Symbotic.
Competition in their respective markets poses risks, particularly for Symbotic, which faces significant operational challenges.
Disclaimer: This article is not financial advice. Each investor is responsible for their own investment decisions.
Go further
I encourage you to read the complete analyses of Hillenbrand, Inc. and Symbotic Inc. to enhance your investment decisions:


