Investors seeking growth opportunities often face the challenge of choosing between companies with distinct yet overlapping technological innovations. Teradyne, Inc. (TER) is a leader in semiconductor testing and industrial automation, while JBT Marel Corporation (JBTM) excels in advanced machinery solutions for the food and beverage sector. Both companies leverage cutting-edge technology to drive efficiency in their industries. In this article, I will analyze their strengths and risks to identify the most promising investment for your portfolio.
Table of contents
Companies Overview
I will begin the comparison between Teradyne and JBT Marel by providing an overview of these two companies and their main differences.
Teradyne Overview
Teradyne, Inc. specializes in designing and manufacturing automatic test equipment globally. Operating through segments like Semiconductor Test, System Test, Industrial Automation, and Wireless Test, it serves semiconductor manufacturers, fabless companies, and industrial clients. Teradyne’s products support diverse applications including automotive, communications, consumer electronics, and wireless devices. Founded in 1960 and based in North Reading, Massachusetts, the company holds a strong position in the semiconductor and automation technology markets.
JBT Marel Overview
JBT Marel Corporation provides technology solutions primarily to the food and beverage industry across multiple regions including North America, Europe, and Asia Pacific. Its offerings cover value-added processing and automated guided vehicle systems for various sectors such as food production, pharmaceuticals, and manufacturing. Formerly John Bean Technologies Corporation, JBT Marel was renamed in 2025 and is headquartered in Chicago, Illinois. The company focuses on industrial machinery with a broad customer base ranging from food to life sciences industries.
Key similarities and differences
Both Teradyne and JBT Marel operate in technology-driven industries but serve distinctly different markets: Teradyne focuses on semiconductor testing and industrial automation, while JBT Marel targets food processing and industrial machinery. Each company offers specialized equipment and automation solutions, though Teradyne’s scope includes electronics and wireless testing, contrasting with JBT Marel’s emphasis on food and beverage industry technologies. Their business models revolve around high-tech equipment sales and service support, yet their sector focus and end-user applications diverge significantly.
Income Statement Comparison
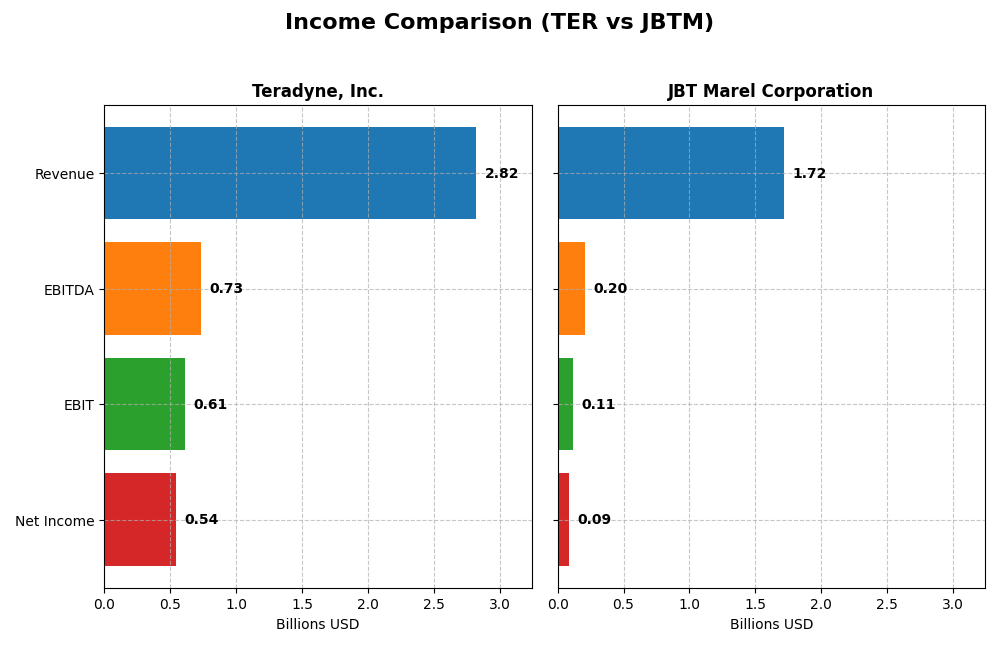
This table provides a clear comparison of key income statement metrics for Teradyne, Inc. and JBT Marel Corporation for the fiscal year 2024.
| Metric | Teradyne, Inc. (TER) | JBT Marel Corporation (JBTM) |
|---|---|---|
| Market Cap | 33.3B | 7.8B |
| Revenue | 2.82B | 1.72B |
| EBITDA | 732M | 204M |
| EBIT | 613M | 115M |
| Net Income | 542M | 85.4M |
| EPS | 3.41 | 2.67 |
| Fiscal Year | 2024 | 2024 |
Income Statement Interpretations
Teradyne, Inc.
Teradyne’s revenue declined by 9.66% over 2020-2024, with net income dropping 30.83%, reflecting some challenges. However, margins remain strong, with a gross margin of 58.48% and a net margin at 19.23%, both favorable. The 2024 year saw revenue growth slow to 5.36%, but net margin improved by 14.71%, indicating operational efficiency gains.
JBT Marel Corporation
JBT Marel showed a nearly flat revenue trend with a slight 0.68% decline over the period and a 21.51% decrease in net income. Margins are thinner, with a gross margin of 36.51% but only a 4.98% net margin, reflecting more pressure on profitability. In 2024, revenue grew modestly by 3.1%, while net margin and EPS suffered significant declines, signaling margin compression.
Which one has the stronger fundamentals?
Teradyne demonstrates stronger fundamentals with higher and improving margins alongside favorable growth in profitability metrics despite revenue contraction. In contrast, JBT Marel faces narrower margins and unfavorable growth trends, including marked declines in net margin and EPS. Teradyne’s overall income statement evaluation is favorable, whereas JBT Marel’s is unfavorable, highlighting a more robust income profile for Teradyne.
Financial Ratios Comparison
The table below presents a side-by-side comparison of key financial ratios for Teradyne, Inc. (TER) and JBT Marel Corporation (JBTM) based on their most recent fiscal year data from 2024.
| Ratios | Teradyne, Inc. (TER) | JBT Marel Corporation (JBTM) |
|---|---|---|
| ROE | 19.2% | 5.53% |
| ROIC | 17.2% | 3.65% |
| P/E | 36.9 | 47.6 |
| P/B | 7.11 | 2.63 |
| Current Ratio | 2.91 | 3.48 |
| Quick Ratio | 1.84 | 3.04 |
| D/E | 0.027 | 0.811 |
| Debt-to-Assets | 2.07% | 36.7% |
| Interest Coverage | 166 | 6.10 |
| Asset Turnover | 0.76 | 0.50 |
| Fixed Asset Turnover | 4.88 | 7.34 |
| Payout ratio | 14.1% | 15.3% |
| Dividend yield | 0.38% | 0.32% |
Interpretation of the Ratios
Teradyne, Inc.
Teradyne’s 2024 financial ratios are largely strong, with favorable net margin (19.23%), ROE (19.24%), and ROIC (17.25%), indicating efficient profitability and capital use. The company shows solid liquidity and low leverage, though its valuation multiples (PE 36.93, PB 7.11) and low dividend yield (0.38%) are less attractive. Teradyne pays dividends with modest yield, supported by free cash flow but faces risks from high payout ratios.
JBT Marel Corporation
JBTM’s ratios reveal weaker profitability, with net margin at 4.98%, ROE 5.53%, and ROIC 3.65%, all unfavorable. Its WACC (7.47%) and interest coverage are positive, but valuation and liquidity metrics are mixed. The dividend yield is low (0.32%) and not well supported by earnings, reflecting cautious shareholder returns. The company’s financial health appears more constrained compared to peers.
Which one has the best ratios?
Teradyne exhibits a more favorable overall ratio profile, with a majority of profitability, liquidity, and leverage metrics rated positively. In contrast, JBT Marel shows several unfavorable profitability ratios and mixed liquidity status. Teradyne’s higher efficiency and stronger returns position it ahead in terms of ratio strength for 2024.
Strategic Positioning
This section compares the strategic positioning of Teradyne, Inc. and JBT Marel Corporation, focusing on Market position, Key segments, and Exposure to technological disruption:
Teradyne, Inc.
- Leading semiconductor and automation equipment provider with significant competitive pressure in tech industry.
- Diverse segments: Semiconductor Test, System Test, Industrial Automation, Wireless Test driving revenue growth.
- Exposure to rapid tech changes in semiconductors, wireless, and industrial automation sectors.
JBT Marel Corporation
- Mid-sized industrial machinery firm facing moderate competitive pressure in food processing technology.
- Focused on food and beverage processing technology with extensive automation and material handling solutions.
- Moderate exposure to technological disruption through automation in food and beverage industry processes.
Teradyne, Inc. vs JBT Marel Corporation Positioning
Teradyne’s strategy is diversified across several high-tech segments including semiconductor testing and industrial automation, offering broader market coverage. JBT Marel is more concentrated in food processing technology, which may limit market scope but focuses expertise. Teradyne’s broader footprint could imply varied growth drivers, while JBT’s focus may expose it to industry-specific risks.
Which has the best competitive advantage?
Teradyne shows a slightly favorable moat, creating value despite declining profitability, indicating a modest competitive advantage. JBT Marel’s very unfavorable moat signifies value destruction and weaker competitive positioning relative to Teradyne.
Stock Comparison
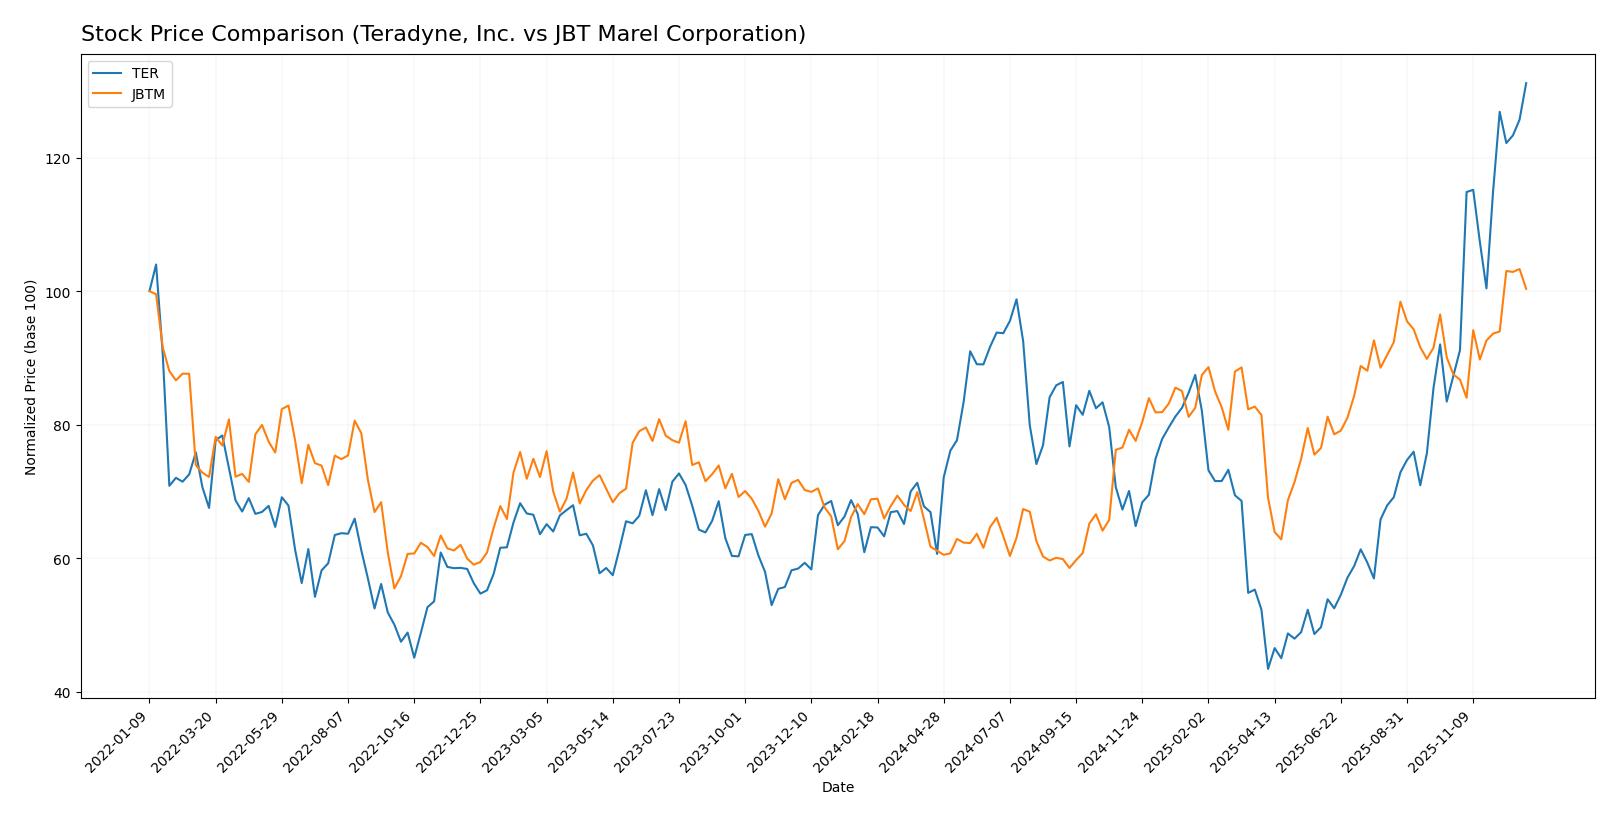
The stock price chart highlights significant bullish trends for Teradyne, Inc. (TER) and JBT Marel Corporation (JBTM) over the past year, with TER showing a notably stronger price appreciation and trading momentum.
Trend Analysis
Teradyne, Inc. (TER) exhibited a strong bullish trend over the past 12 months with a 102.87% price increase and accelerating momentum, reaching a high of 207.56 and a low of 68.72, supported by high volatility (std deviation 30.21).
JBT Marel Corporation (JBTM) also showed a bullish trend over the same period with a 45.81% price increase and acceleration, hitting a high of 155.05 and a low of 87.85, but with lower volatility (std deviation 18.87).
Comparing the two, TER delivered the highest market performance with more than double the price appreciation of JBTM over the past year.
Target Prices
The current analyst consensus presents a balanced outlook for Teradyne, Inc. and JBT Marel Corporation.
| Company | Target High | Target Low | Consensus |
|---|---|---|---|
| Teradyne, Inc. | 240 | 136 | 200.22 |
| JBT Marel Corporation | 180 | 169 | 174.5 |
Analysts expect Teradyne’s stock to trade slightly below its current price of 207.56 USD, while JBT Marel’s consensus target of 174.5 USD suggests upside potential from its current 150.59 USD level.
Analyst Opinions Comparison
This section compares analysts’ ratings and grades for Teradyne, Inc. and JBT Marel Corporation:
Rating Comparison
Teradyne, Inc. Rating
- Rating: B, considered Very Favorable
- Discounted Cash Flow Score: 3, Moderate
- Return on Equity Score: 4, Favorable
- Return on Assets Score: 5, Very Favorable
- Debt To Equity Score: 3, Moderate
- Overall Score: 3, Moderate
JBT Marel Corporation Rating
- Rating: C, considered Very Favorable
- Discounted Cash Flow Score: 3, Moderate
- Return on Equity Score: 1, Very Unfavorable
- Return on Assets Score: 1, Very Unfavorable
- Debt To Equity Score: 2, Moderate
- Overall Score: 2, Moderate
Which one is the best rated?
Teradyne holds a higher overall rating of B compared to JBT Marel’s C, with notably better scores in return on equity and assets. Both companies have moderate DCF and debt-to-equity scores, but Teradyne is generally better rated based on the provided data.
Scores Comparison
Here is a comparison of the financial health scores of Teradyne, Inc. and JBT Marel Corporation:
TER Scores
- Altman Z-Score of 14.74, placing TER well in the safe zone
- Piotroski Score of 5, reflecting an average financial strength
JBTM Scores
- Altman Z-Score of 1.75, indicating JBTM is in distress zone
- Piotroski Score of 2, showing very weak financial strength
Which company has the best scores?
Based strictly on the provided scores, TER demonstrates a significantly stronger financial position with a very high Altman Z-Score and an average Piotroski Score, while JBTM shows financial distress and very weak strength.
Grades Comparison
Here is the comparison of the latest reliable grades assigned to Teradyne, Inc. and JBT Marel Corporation:
Teradyne, Inc. Grades
The table below summarizes recent grades from recognized financial institutions for Teradyne, Inc.:
| Grading Company | Action | New Grade | Date |
|---|---|---|---|
| Goldman Sachs | Upgrade | Buy | 2025-12-16 |
| Stifel | Upgrade | Buy | 2025-12-02 |
| Citigroup | Maintain | Buy | 2025-11-12 |
| Goldman Sachs | Maintain | Sell | 2025-10-30 |
| UBS | Maintain | Buy | 2025-10-30 |
| Evercore ISI Group | Maintain | Outperform | 2025-10-30 |
| JP Morgan | Maintain | Neutral | 2025-10-30 |
| Evercore ISI Group | Maintain | Outperform | 2025-10-28 |
| Stifel | Maintain | Hold | 2025-10-28 |
| UBS | Maintain | Buy | 2025-10-20 |
Teradyne’s recent grades show a positive shift with several upgrades to Buy and Outperform, though some firms maintain Neutral or Sell ratings, indicating mixed sentiment.
JBT Marel Corporation Grades
The table below shows recent grades from recognized financial institutions for JBT Marel Corporation:
| Grading Company | Action | New Grade | Date |
|---|---|---|---|
| Jefferies | Upgrade | Buy | 2025-12-10 |
| William Blair | Upgrade | Outperform | 2025-08-06 |
JBT Marel received upgrades from Hold and Market Perform to Buy and Outperform, signaling an improving outlook from these analysts.
Which company has the best grades?
Comparing both companies, Teradyne, Inc. has a broader set of grades with a mix of Buy and Outperform ratings alongside some Hold and Sell, while JBT Marel Corporation shows a clear improvement to Buy and Outperform but from fewer sources. Teradyne’s more extensive analyst coverage with several Buy and Outperform grades may suggest stronger market confidence, potentially attracting a wider range of investors.
Strengths and Weaknesses
Below is a comparison of key strengths and weaknesses for Teradyne, Inc. (TER) and JBT Marel Corporation (JBTM) based on their latest financial and operational data.
| Criterion | Teradyne, Inc. (TER) | JBT Marel Corporation (JBTM) |
|---|---|---|
| Diversification | Strong product and service mix with $2.29B in products and $525M in services (2024). | Less diversified, primarily focused on food processing equipment. |
| Profitability | High profitability: net margin 19.23%, ROE 19.24%, ROIC 17.25%. | Low profitability: net margin 4.98%, ROE 5.53%, ROIC 3.65%. |
| Innovation | Solid innovation evidenced by strong fixed asset turnover (4.88) and industrial automation roots. | Moderate innovation, with higher fixed asset turnover (7.34) but weaker returns. |
| Global presence | Well-established global presence supporting significant revenues. | Global reach but less efficient capital usage and profitability. |
| Market Share | Consistently creates value with ROIC > WACC by 4.8%, though ROIC trend is declining. | Destroying value with ROIC below WACC by -3.8% and sharply declining ROIC. |
Key takeaways: Teradyne demonstrates strong profitability and value creation despite a slight decline in ROIC, supported by diversified revenues. JBT Marel faces challenges with low profitability and value destruction, signaling caution for investors.
Risk Analysis
Below is a comparative table of key risks for Teradyne, Inc. (TER) and JBT Marel Corporation (JBTM) based on 2024 data and recent financial evaluations:
| Metric | Teradyne, Inc. (TER) | JBT Marel Corporation (JBTM) |
|---|---|---|
| Market Risk | High (Beta 1.85, tech sector volatility) | Moderate (Beta 1.01, industrial stability) |
| Debt Level | Very Low (Debt/Equity 0.03, strong balance sheet) | Moderate-High (Debt/Equity 0.81, caution advised) |
| Regulatory Risk | Moderate (Tech industry regulations) | Moderate (Food & machinery regulations) |
| Operational Risk | Moderate (Complex semiconductor and automation operations) | Moderate-High (Diverse food processing tech, supply chain exposure) |
| Environmental Risk | Low (Industrial automation focus, less direct environmental impact) | Moderate (Food processing and packaging have environmental scrutiny) |
| Geopolitical Risk | Moderate (Global supply chains in semiconductors) | Moderate (Global operations across multiple regions) |
The most likely and impactful risks are Teradyne’s market volatility indicated by its high beta and valuation concerns (high P/E and P/B ratios), despite solid financial stability and low debt. JBT Marel faces higher operational and debt-related risks, with a distress-level Altman Z-score signaling potential financial vulnerability. Investors should weigh Teradyne’s growth potential against its valuation risk and JBT Marel’s financial fragility amid industrial sector challenges.
Which Stock to Choose?
Teradyne, Inc. (TER) shows a favorable income evolution with strong profitability metrics, including a net margin of 19.23% and a return on equity of 19.24%. The company maintains low debt levels and favorable financial ratios, supported by a very favorable rating and a safe-zone Altman Z-Score.
JBT Marel Corporation (JBTM) presents a less favorable income evolution, with a modest net margin of 4.98% and lower returns on equity and invested capital. The company has higher debt ratios and mixed financial ratios, reflected in a very favorable rating but a distress-zone Altman Z-Score and a weak Piotroski score.
From an investor’s perspective, TER might appear more suitable for those prioritizing quality and stable profitability, given its strong income statement and favorable financial ratios. Conversely, JBTM could be of interest to investors with a higher risk tolerance seeking potential turnaround opportunities despite its current challenges.
Disclaimer: Investment carries a risk of loss of initial capital. The past performance is not a reliable indicator of future results. Be sure to understand risks before making an investment decision.
Go Further
I encourage you to read the complete analyses of Teradyne, Inc. and JBT Marel Corporation to enhance your investment decisions: