Home > Comparison > Technology > TER vs SYM
The strategic rivalry between Teradyne, Inc. and Symbotic Inc. defines the current trajectory of advanced automation technologies. Teradyne, a technology sector leader, excels in semiconductor and industrial test equipment, while Symbotic, grounded in industrial machinery, focuses on warehouse automation for retailers. This analysis pits capital-intensive innovation against operational efficiency, aiming to identify which company’s path promises superior risk-adjusted returns for a diversified portfolio.
Table of contents
Companies Overview
Teradyne, Inc. and Symbotic Inc. both drive innovation in automation but serve distinct industrial frontiers with broad market impact.
Teradyne, Inc.: Leader in Automated Testing Solutions
Teradyne stands as a semiconductor test equipment giant. It generates revenue by designing and selling automatic test systems for chips, industrial robots, and wireless devices. In 2026, Teradyne sharpened its strategic focus on expanding industrial automation and wireless test segments to meet rising demands in 5G and IoT technologies.
Symbotic Inc.: Warehouse Automation Innovator
Symbotic excels in industrial machinery automation, delivering robotics that optimize warehouse operations. It monetizes through The Symbotic System, a comprehensive automation suite that cuts costs and boosts inventory efficiency for retailers and wholesalers. In 2026, Symbotic prioritized scaling its system deployment to capture growing logistics automation needs in the U.S.
Strategic Collision: Similarities & Divergences
Teradyne and Symbotic both leverage automation but diverge in sector focus—Teradyne emphasizes semiconductor and wireless testing, while Symbotic targets warehouse logistics. Their competitive battleground centers on industrial automation, where cost efficiency and technological integration drive market share. Teradyne offers diversified tech exposure with a mature footprint, contrasting Symbotic’s growth-oriented, niche warehouse robotics profile.
Income Statement Comparison
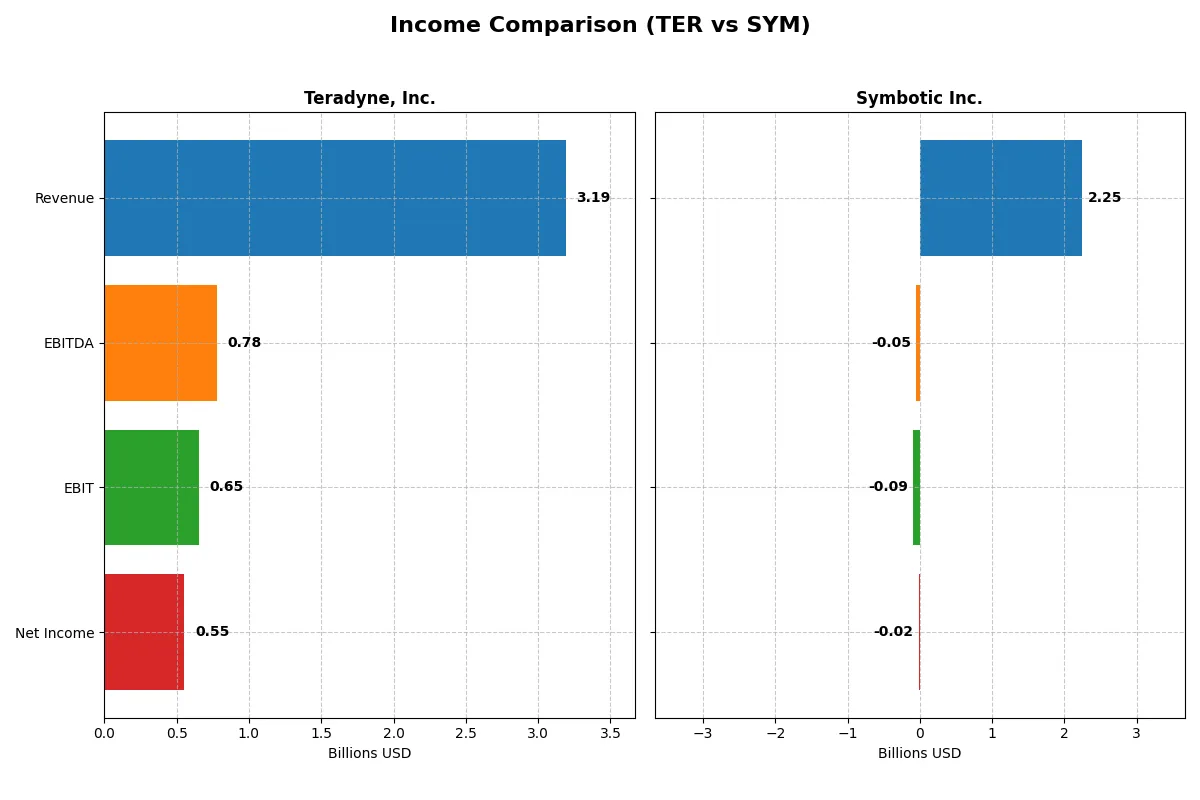
The following data dissects the core profitability and scalability of both corporate engines to reveal who dominates the bottom line:
| Metric | Teradyne, Inc. (TER) | Symbotic Inc. (SYM) |
|---|---|---|
| Revenue | 3.19B | 2.25B |
| Cost of Revenue | 1.32B | 1.82B |
| Operating Expenses | 1.17B | 538M |
| Gross Profit | 1.87B | 423M |
| EBITDA | 780M | -48M |
| EBIT | 653M | -92M |
| Interest Expense | 8.02M | 0 |
| Net Income | 554M | -17M |
| EPS | 3.49 | -0.16 |
| Fiscal Year | 2025 | 2025 |
Income Statement Analysis: The Bottom-Line Duel
This income statement comparison exposes which company runs its business engine with greater efficiency and financial discipline over recent years.
Teradyne, Inc. Analysis
Teradyne’s revenue climbed from $2.67B in 2023 to $3.19B in 2025, showing solid growth despite a slight overall decline since 2021. Net income rose to $554M in 2025, though down from a peak of $1.01B in 2021. Margins remain robust, with a gross margin near 59% and a net margin of 17.4%, signaling strong operational efficiency and cost control.
Symbotic Inc. Analysis
Symbotic’s revenue surged impressively from $252M in 2021 to $2.25B in 2025, reflecting rapid expansion. However, net income remained negative, at -$17M in 2025 despite significant top-line growth. Gross margins linger around 19%, and the negative EBIT margin of -4.1% points to ongoing challenges in scaling profitably amid rising operating expenses.
Margin Power vs. Rapid Growth
Teradyne dominates on profitability with stable, high margins and positive net income, while Symbotic leads in explosive revenue growth but struggles to convert it into profits. For investors prioritizing earnings stability and margin discipline, Teradyne’s profile appears more attractive. Symbotic’s rapid scale-up carries higher risk without current profit delivery.
Financial Ratios Comparison
These vital ratios act as a diagnostic tool to expose the underlying fiscal health, valuation premiums, and capital efficiency of the companies compared below:
| Ratios | Teradyne, Inc. (TER) | Symbotic Inc. (SYM) |
|---|---|---|
| ROE | 19.8% | -7.7% |
| ROIC | 18.4% | -16.6% |
| P/E | 54.6 | -334.5 |
| P/B | 10.8 | 25.6 |
| Current Ratio | 1.76 | 1.08 |
| Quick Ratio | 1.41 | 0.99 |
| D/E (Debt-to-Equity) | 0.12 | 0.14 |
| Debt-to-Assets | 8.3% | 1.3% |
| Interest Coverage | 86.4 | 0 |
| Asset Turnover | 0.76 | 0.94 |
| Fixed Asset Turnover | 4.99 | 15.9 |
| Payout ratio | 13.8% | 0 |
| Dividend yield | 0.25% | 0 |
| Fiscal Year | 2025 | 2025 |
Efficiency & Valuation Duel: The Vital Signs
Financial ratios act as a company’s DNA, exposing hidden risks and revealing operational strengths critical for investment decisions.
Teradyne, Inc.
Teradyne posts strong profitability with a 19.8% ROE and a robust 17.4% net margin, indicating efficient capital use. However, its valuation appears stretched, with a high 54.6 P/E and 10.8 P/B ratio. The firm offers a modest 0.25% dividend yield, balancing shareholder returns with significant R&D investment fueling growth.
Symbotic Inc.
Symbotic struggles with profitability, showing negative ROE at -7.65% and a -0.75% net margin, signaling operational challenges. It trades at a negative P/E but an expensive 25.6 P/B ratio, reflecting market skepticism. The company pays no dividend, focusing on reinvesting cash flow into R&D and scaling its business model.
Premium Valuation vs. Operational Safety
Teradyne delivers a favorable ratio profile with solid returns but trades at a premium, while Symbotic faces profitability headwinds despite lower earnings multiples. Teradyne offers balanced risk with operational strength, suiting cautious investors; Symbotic fits those seeking high growth amid uncertainty.
Which one offers the Superior Shareholder Reward?
I compare Teradyne, Inc. (TER) and Symbotic Inc. (SYM) on shareholder returns. Teradyne delivers a modest dividend yield near 0.38% with a conservative payout ratio around 14%. Its buyback programs are steady, supported by strong free cash flow of ~2.9/share in 2025. Symbotic pays no dividends, reinvesting heavily in growth, with a robust free cash flow of 7.25/share, yet suffers persistent net losses. Teradyne’s balanced dividend and buybacks reflect disciplined capital allocation and sustainable shareholder returns. Symbotic’s strategy bets on growth over income but carries higher risk. Given 2026’s market context, I favor Teradyne for superior total return, combining income and disciplined buybacks, offering more predictable long-term value.
Comparative Score Analysis: The Strategic Profile
The radar chart reveals the fundamental DNA and trade-offs of Teradyne, Inc. and Symbotic Inc., highlighting their core financial strengths and vulnerabilities:
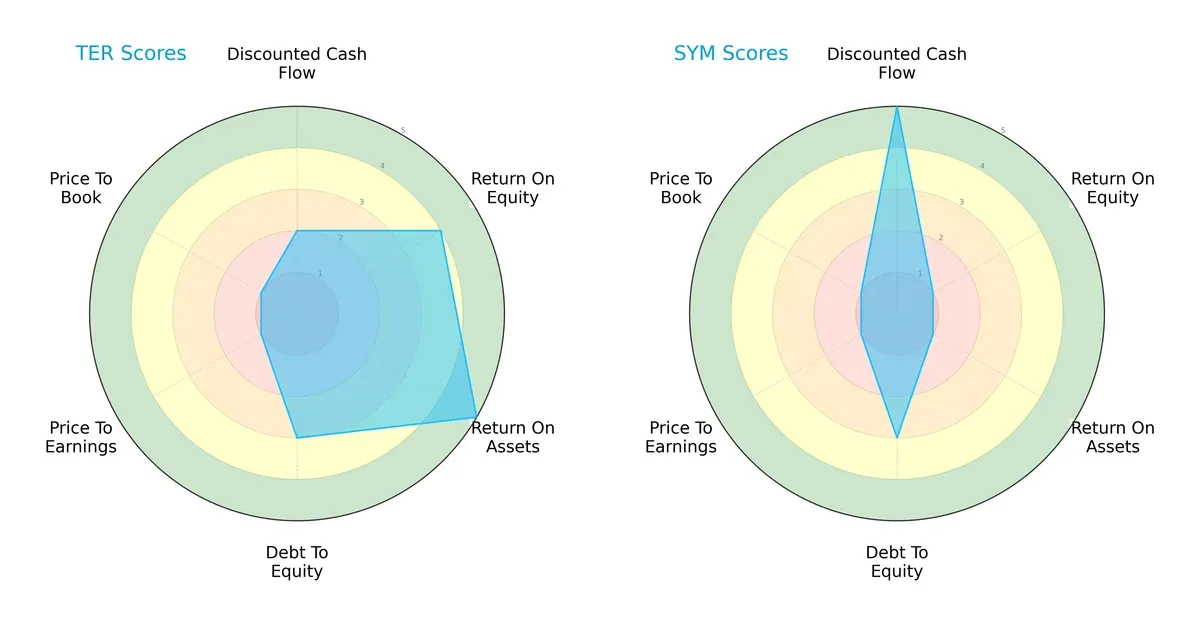
Teradyne displays a balanced profile with solid ROE (4) and ROA (5) scores, reflecting efficient asset utilization and profitability. Symbotic relies heavily on a strong DCF score (5), indicating optimistic future cash flows but suffers on ROE (1) and ROA (1), signaling operational inefficiency. Both share moderate debt-to-equity risk (3) and very unfavorable valuation scores (PE/PB = 1), which warrants caution. Teradyne’s diversified strengths make it the more stable choice, while Symbotic leans on growth potential.
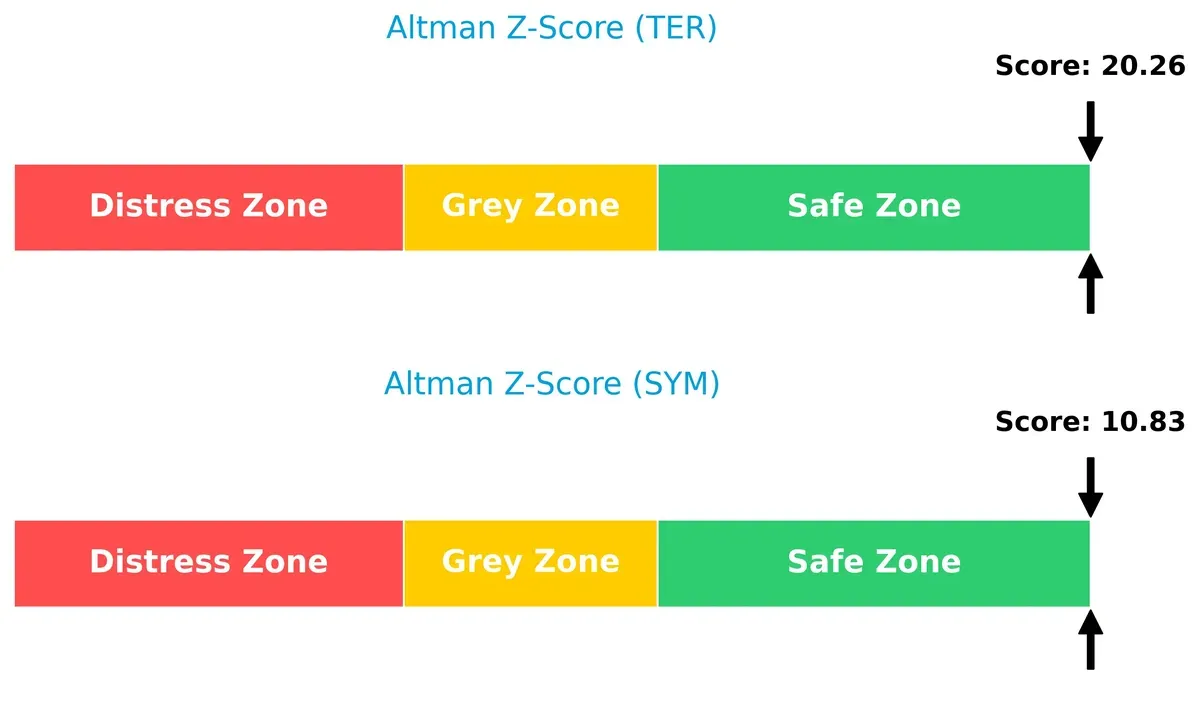
Bankruptcy Risk: Solvency Showdown
Teradyne’s Altman Z-Score of 20.3 far exceeds Symbotic’s 10.8, placing both comfortably in the safe zone. This gap underscores Teradyne’s superior financial resilience and lower bankruptcy risk during volatile cycles:
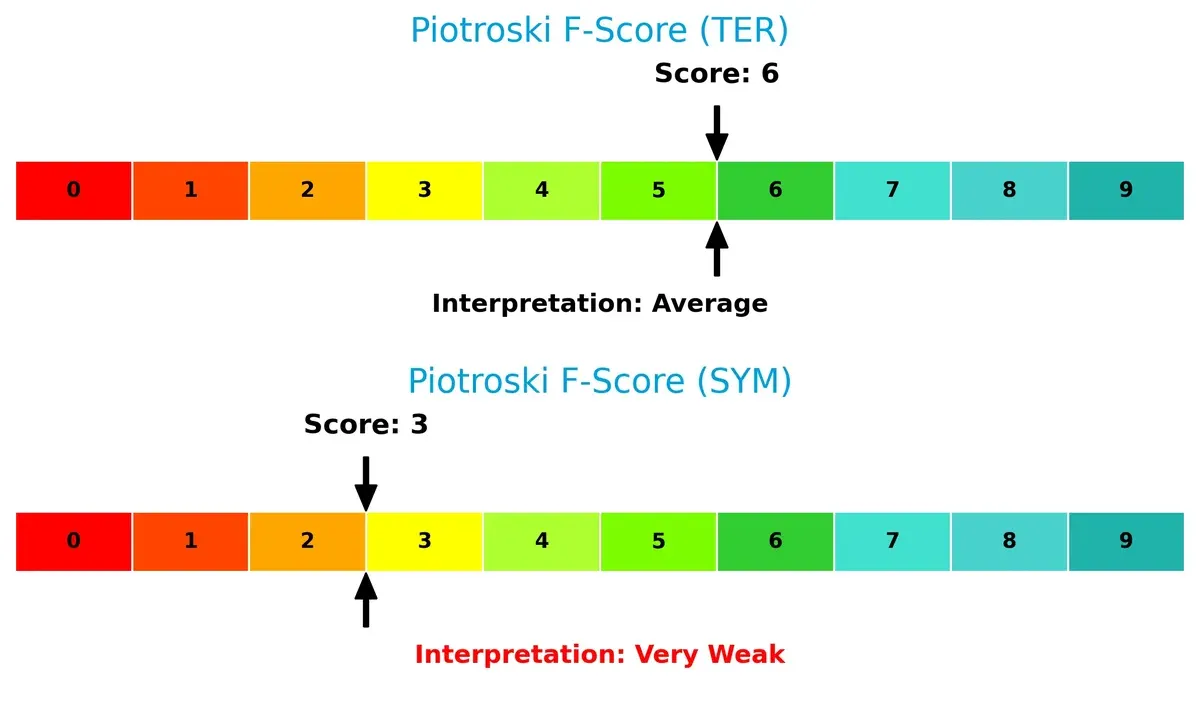
Financial Health: Quality of Operations
Teradyne’s Piotroski F-Score of 6 indicates average but solid financial health. Symbotic’s weaker score of 3 raises red flags about its operational stability and internal financial metrics, highlighting potential risk:
How are the two companies positioned?
This section dissects the operational DNA of Teradyne and Symbotic by comparing their revenue distribution and internal strengths and weaknesses. The goal is to confront their economic moats and identify which model offers the most resilient competitive advantage today.
Revenue Segmentation: The Strategic Mix
This visual comparison dissects how Teradyne, Inc. and Symbotic Inc. diversify their income streams and reveals where their primary sector bets lie:
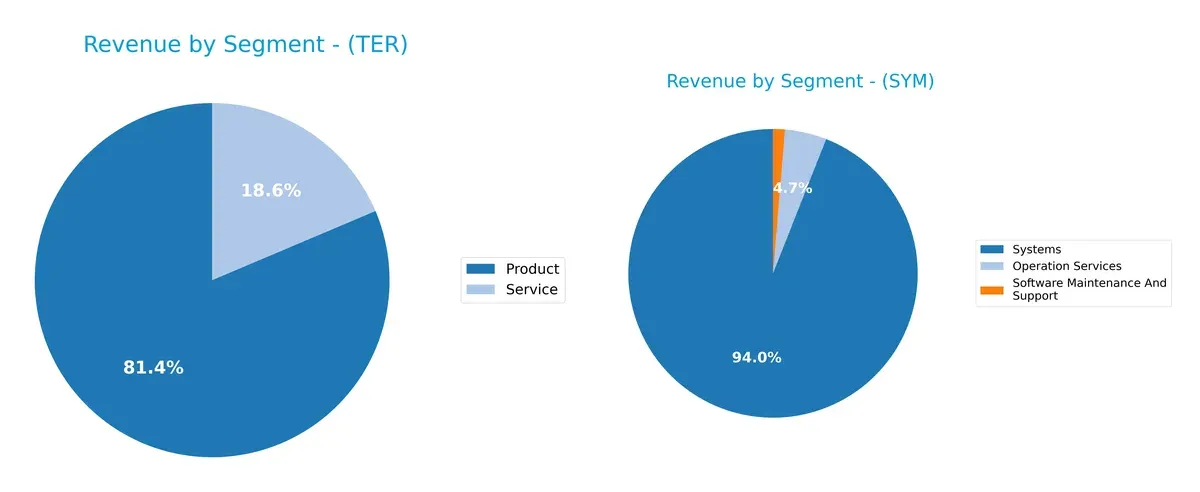
Teradyne anchors revenue in Products at $2.29B, with Services contributing $525M, showing moderate diversification. Symbotic pivots heavily on Systems at $2.12B, with smaller Operation Services ($105M) and Software Maintenance ($30M). Teradyne’s balanced mix reduces concentration risk, while Symbotic’s Systems dominance signals infrastructure leadership but higher dependency on one segment. Investors should weigh diversified resilience against concentrated market power here.
Strengths and Weaknesses Comparison
This table compares the Strengths and Weaknesses of Teradyne, Inc. and Symbotic Inc.:
Teradyne Strengths
- Favorable net margin (17.37%) and ROE (19.82%)
- Strong ROIC (18.45%) above WACC
- Low debt-to-assets (8.32%) and high interest coverage (81.43)
- Solid current (1.76) and quick ratios (1.41)
- Diversified global revenue across Asia, US, and EMEA
- Consistent product and service revenue streams
Symbotic Strengths
- Favorable fixed asset turnover (15.92) indicating efficient asset use
- Low debt-to-assets (1.32%) and favorable debt-to-equity ratio (0.14)
- Concentrated US market presence with growing systems revenue
- Favorable PE ratio despite losses, reflecting market expectations
Teradyne Weaknesses
- Unfavorable high WACC (12.35%) eroding value
- Elevated P/E (54.64) and P/B (10.83) ratios may indicate overvaluation
- Low dividend yield (0.25%) limits income for investors
- Neutral asset turnover (0.76) could hamper efficiency gains
Symbotic Weaknesses
- Negative profitability metrics: net margin (-0.75%), ROE (-7.65%), ROIC (-16.63%)
- Unfavorable interest coverage (0) signals financial stress
- Neutral current (1.08) and quick ratios (0.99) hint weak liquidity
- High P/B (25.6) and zero dividend yield reflect risk profile
Teradyne demonstrates solid profitability and strong global diversification but faces valuation and capital cost challenges. Symbotic shows operational efficiency in asset use with low leverage but struggles with profitability and liquidity. These contrasts define their strategic priorities in market positioning and financial health.
The Moat Duel: Analyzing Competitive Defensibility
A structural moat is the only reliable shield protecting long-term profits from relentless competitive erosion. Here’s how Teradyne and Symbotic stack up:
Teradyne, Inc.: Intangible Assets and Scale Economies
Teradyne’s moat stems from advanced test technology and scale in semiconductors. This delivers a strong 6% ROIC premium over WACC, with stable margins near 20%. Yet, its declining ROIC trend warns of emerging pressures by 2026.
Symbotic Inc.: Innovative Automation with Early-Stage Challenges
Symbotic’s automation platform offers cost advantages disrupting warehousing. However, it posts negative ROIC versus WACC and shrinking profitability. Rapid revenue growth signals potential, but profitability must improve to deepen its moat.
Verdict: Proven Tech Scale vs. Nascent Automation Disruption
Teradyne holds the deeper moat with consistent value creation through proprietary tech and scale. Symbotic’s innovation shows promise but struggles financially. Teradyne is better positioned to defend market share amidst intensifying competition.
Which stock offers better returns?
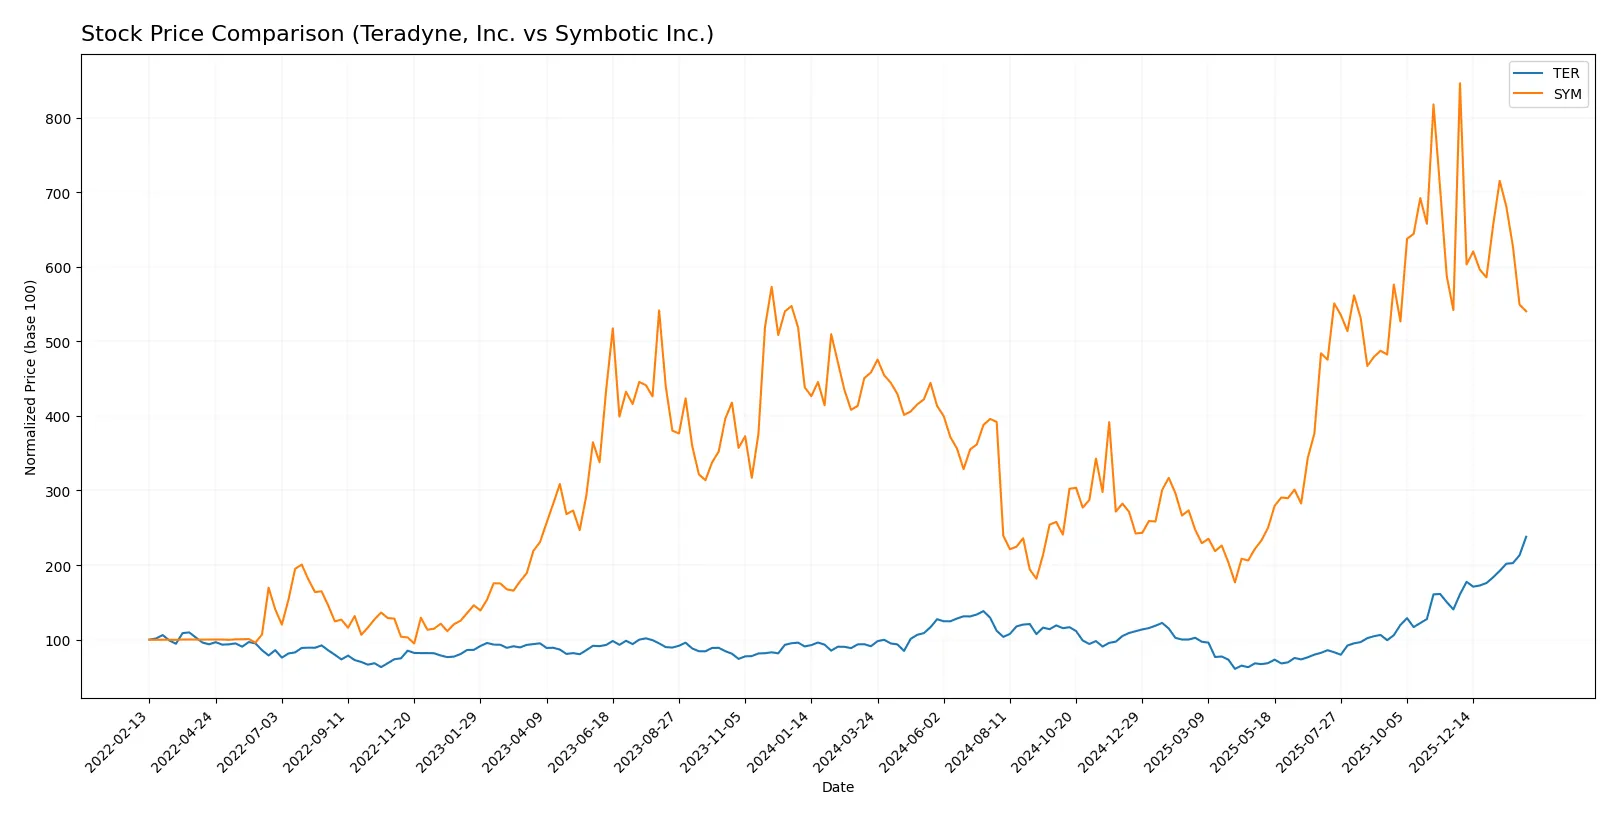
Over the past year, Teradyne, Inc. and Symbotic Inc. exhibited distinct price trajectories, with Teradyne showing rapid gains and strong buyer dominance, while Symbotic’s gains slowed amid seller pressure.
Trend Comparison
Teradyne, Inc. surged 161.08% over 12 months, marking a bullish trend with accelerating momentum and high volatility, peaking at $269.07 and bottoming at $68.72.
Symbotic Inc. gained 17.9% over the same period, showing a bullish but decelerating trend with moderate volatility, reaching a high of $83.77 and a low of $17.50.
Teradyne clearly outperformed Symbotic, delivering substantially higher returns and stronger upward momentum throughout the year.
Target Prices
Analysts show a bullish consensus for Teradyne, Inc. and Symbotic Inc., reflecting confidence in their growth prospects.
| Company | Target Low | Target High | Consensus |
|---|---|---|---|
| Teradyne, Inc. | 175 | 335 | 276.08 |
| Symbotic Inc. | 42 | 83 | 65.56 |
Teradyne’s consensus target of 276.08 sits slightly above its current 269.07 price, signaling moderate upside. Symbotic’s 65.56 consensus target implies significant growth potential from its 53.48 current price.

Don’t Let Luck Decide Your Entry Point
Optimize your entry points with our advanced ProRealTime indicators. You’ll get efficient buy signals with precise price targets for maximum performance. Start outperforming now!
How do institutions grade them?
The following presents the latest institutional grades for Teradyne, Inc. and Symbotic Inc.:
Teradyne, Inc. Grades
This table summarizes recent grades from reputable financial institutions for Teradyne, Inc.:
| Grading Company | Action | New Grade | Date |
|---|---|---|---|
| Cantor Fitzgerald | Maintain | Overweight | 2026-02-04 |
| Goldman Sachs | Maintain | Buy | 2026-02-04 |
| Stifel | Maintain | Buy | 2026-02-04 |
| Evercore ISI Group | Maintain | Outperform | 2026-02-04 |
| Citigroup | Maintain | Buy | 2026-02-04 |
| Evercore ISI Group | Maintain | Outperform | 2026-02-03 |
| Cantor Fitzgerald | Maintain | Overweight | 2026-02-02 |
| Stifel | Maintain | Buy | 2026-01-30 |
| UBS | Maintain | Buy | 2026-01-26 |
| B of A Securities | Maintain | Buy | 2026-01-22 |
Symbotic Inc. Grades
This table summarizes recent grades from reputable financial institutions for Symbotic Inc.:
| Grading Company | Action | New Grade | Date |
|---|---|---|---|
| Barclays | Maintain | Underweight | 2026-01-12 |
| Goldman Sachs | Downgrade | Sell | 2025-12-02 |
| Barclays | Maintain | Underweight | 2025-11-26 |
| Baird | Maintain | Neutral | 2025-11-26 |
| DA Davidson | Maintain | Neutral | 2025-11-25 |
| Cantor Fitzgerald | Maintain | Overweight | 2025-11-25 |
| Needham | Maintain | Buy | 2025-11-25 |
| Craig-Hallum | Upgrade | Buy | 2025-11-25 |
| Citigroup | Maintain | Buy | 2025-11-25 |
| Northland Capital Markets | Maintain | Outperform | 2025-11-25 |
Which company has the best grades?
Teradyne consistently receives strong positive grades such as Buy and Outperform from top-tier firms. Symbotic’s ratings display a mix, including Underweight and Sell from major banks. Teradyne’s superior grades suggest stronger institutional confidence, which may influence investor sentiment and stock performance.
Risks specific to each company
The following categories identify critical pressure points and systemic threats facing Teradyne, Inc. and Symbotic Inc. in the 2026 market environment:
1. Market & Competition
Teradyne, Inc.
- Operates in semiconductors, facing intense innovation and pricing pressure. Strong legacy but high P/E signals overvaluation risk.
Symbotic Inc.
- Industrial automation sector with growth potential but negative margins indicate competitive struggles and early-stage challenges.
2. Capital Structure & Debt
Teradyne, Inc.
- Low debt-to-equity (0.12) and strong interest coverage (81.43) ensure financial stability.
Symbotic Inc.
- Low debt-to-equity (0.14) but zero interest coverage signals potential liquidity risks.
3. Stock Volatility
Teradyne, Inc.
- Beta at 1.82 shows above-market volatility; price range wide but recent price drop suggests market sensitivity.
Symbotic Inc.
- Even higher beta at 2.14, reflecting greater risk and price swings typical for a younger firm.
4. Regulatory & Legal
Teradyne, Inc.
- Subject to semiconductor export controls and tech regulations; historically compliant but geopolitical tensions remain a risk.
Symbotic Inc.
- Faces industrial safety and automation standards; emerging regulatory scrutiny as technology adoption grows.
5. Supply Chain & Operations
Teradyne, Inc.
- Complex global supply chains in semiconductor manufacturing pose disruption risks; has diversified manufacturing footprint.
Symbotic Inc.
- Reliant on advanced robotics components; supply chain resilience less proven given smaller scale.
6. ESG & Climate Transition
Teradyne, Inc.
- Increasing focus on energy-efficient products; ESG initiatives underway but semiconductor sector faces scrutiny on resource use.
Symbotic Inc.
- Automation promises efficiency gains, but carbon footprint and labor displacement concerns present reputational risks.
7. Geopolitical Exposure
Teradyne, Inc.
- High exposure to US-China tensions impacting semiconductor supply and demand cycles.
Symbotic Inc.
- Primarily US-focused but global supply chain links could be vulnerable to trade disruptions.
Which company shows a better risk-adjusted profile?
Teradyne’s most impactful risk is market overvaluation amid semiconductor cyclicality. Symbotic’s critical risk lies in its negative profitability and operational liquidity. Teradyne’s robust balance sheet and safer Altman Z-Score indicate a better risk-adjusted profile. Symbotic’s early-stage losses and weak Piotroski Score heighten caution, despite promising automation growth.
Final Verdict: Which stock to choose?
Teradyne, Inc. excels as a cash-generating powerhouse with robust operational efficiency and a proven track record of value creation. Its declining ROIC signals a point of vigilance, warranting attention to profitability trends. Teradyne suits investors seeking steady growth within a disciplined capital allocation framework.
Symbotic Inc. boasts a strategic moat rooted in innovation and rapid revenue expansion, reflecting its emerging position in automation technology. Its financial instability and negative returns highlight elevated risks compared to Teradyne. Symbotic aligns better with high-risk, high-reward portfolios targeting disruptive growth.
If you prioritize consistent value creation and financial resilience, Teradyne outshines as the compelling choice due to its superior profitability and balance sheet strength. However, if you seek aggressive growth fueled by innovation and can tolerate volatility, Symbotic offers superior upside potential despite its current financial challenges.
Disclaimer: Investment carries a risk of loss of initial capital. The past performance is not a reliable indicator of future results. Be sure to understand risks before making an investment decision.
Go Further
I encourage you to read the complete analyses of Teradyne, Inc. and Symbotic Inc. to enhance your investment decisions: