Home > Comparison > Technology > TER vs ATS
The strategic rivalry between Teradyne, Inc. and ATS Corporation shapes the automation and testing landscape across technology and industrial sectors. Teradyne operates as a technology powerhouse focused on semiconductor and wireless test equipment, while ATS delivers comprehensive industrial automation solutions. This analysis pits Teradyne’s innovation-driven growth against ATS’s diversified manufacturing services to determine which offers superior risk-adjusted returns for a balanced portfolio in 2026.
Table of contents
Companies Overview
Teradyne and ATS Corporation stand as pivotal players in automation and testing industries, serving diverse global markets.
Teradyne, Inc.: Semiconductor and Automation Powerhouse
Teradyne dominates the semiconductor test equipment market, generating revenue by designing and selling automatic test systems. Its strategic focus in 2026 targets expanding Industrial Automation with collaborative robotics and advancing wireless test solutions, maintaining leadership across semiconductor, system, and wireless test segments.
ATS Corporation: Comprehensive Automation Solutions Provider
ATS Corporation specializes in custom automation systems for manufacturing and assembly, driving revenue through engineering design, integration, and digital factory-floor solutions. Its 2026 strategy emphasizes connected software platforms and lifecycle services that enhance operational efficiency across industries from life sciences to energy.
Strategic Collision: Similarities & Divergences
Both companies prioritize automation but diverge in scope: Teradyne integrates hardware-heavy semiconductor testing with robotics, while ATS leans on bespoke automation and digital software services. They compete primarily in industrial automation, targeting manufacturing efficiency. Teradyne offers a hardware-software hybrid moat; ATS delivers tailored end-to-end automation, defining distinct investment profiles rooted in scale and specialization.
Income Statement Comparison
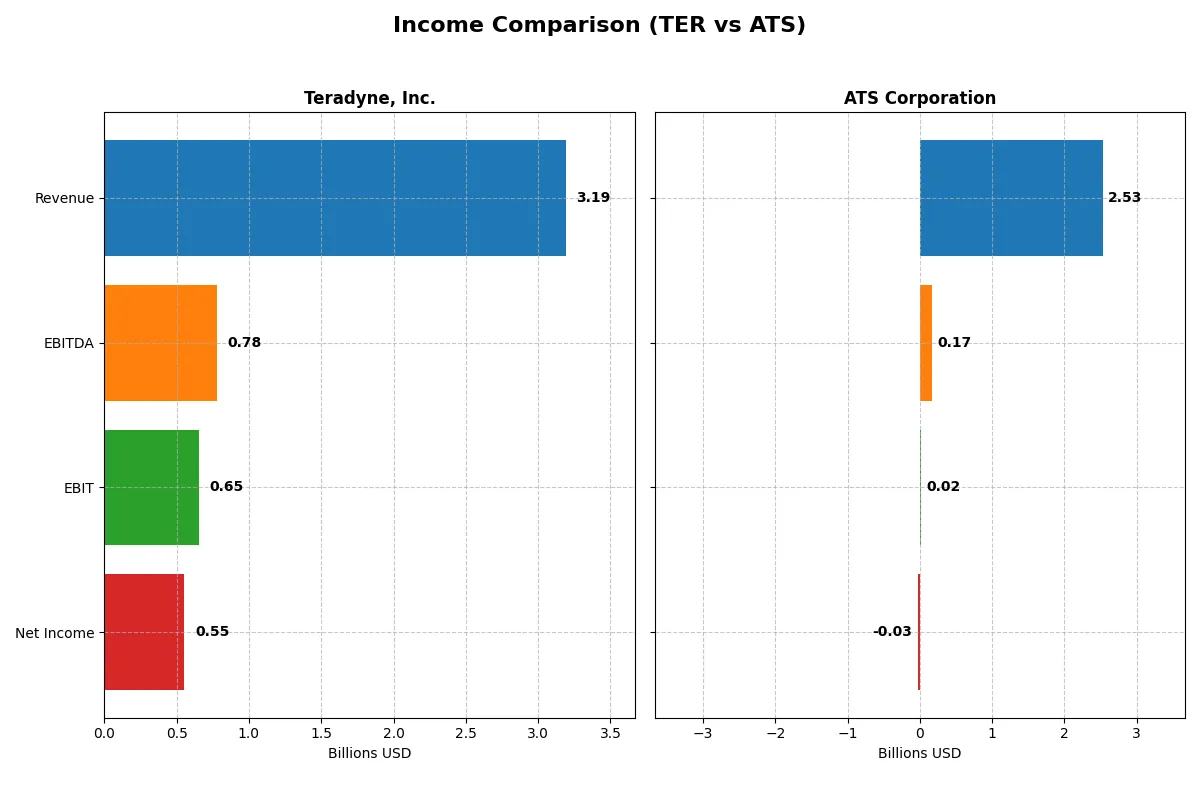
The following data dissects the core profitability and scalability of both corporate engines to reveal who dominates the bottom line:
| Metric | Teradyne, Inc. (TER) | ATS Corporation (ATS) |
|---|---|---|
| Revenue | 3.19B | 2.53B |
| Cost of Revenue | 1.32B | 1.89B |
| Operating Expenses | 1.17B | 637M |
| Gross Profit | 1.87B | 647M |
| EBITDA | 780M | 168M |
| EBIT | 653M | 15M |
| Interest Expense | 8M | 98M |
| Net Income | 554M | -28M |
| EPS | 3.49 | -0.29 |
| Fiscal Year | 2025 | 2025 |
Income Statement Analysis: The Bottom-Line Duel
This income statement comparison unveils how efficiently each company converts sales into profits amid changing market conditions.
Teradyne, Inc. Analysis
Teradyne’s revenue climbed steadily from 2.67B in 2023 to 3.19B in 2025, with net income rising from 449M to 554M. Its gross margin remains robust at 58.55%, and net margin holds a healthy 17.37%. In 2025, Teradyne sustained momentum with revenue growth of 13% and solid operating efficiency reflected in a 20.48% EBIT margin.
ATS Corporation Analysis
ATS’s revenue peaked at 3.03B in 2024 but slipped to 2.53B in 2025, with net income swinging from a positive 194M in 2024 to a loss of 28M in 2025. Gross margin weakened sharply to 25.53%, and net margin turned negative at -1.11%. The latest year shows a steep decline in profitability, with EBIT margin nearly flat at 0.6%, signaling operational challenges.
Margin Strength vs. Revenue Volatility
Teradyne outperforms ATS decisively in profitability and margin sustainability. Teradyne’s high and expanding margins contrast with ATS’s deteriorating net income and shrinking profitability despite sizable revenue. For investors, Teradyne’s profile offers stronger earnings resilience, making it the more attractive fundamental choice in this comparison.
Financial Ratios Comparison
These vital ratios act as a diagnostic tool to expose the underlying fiscal health, valuation premiums, and capital efficiency of the companies compared below:
| Ratios | Teradyne, Inc. (TER) | ATS Corporation (ATS) |
|---|---|---|
| ROE | 19.8% | -1.6% |
| ROIC | 18.4% | 0.09% |
| P/E | 54.6 | -125.3 |
| P/B | 10.8 | 2.06 |
| Current Ratio | 1.76 | 1.69 |
| Quick Ratio | 1.41 | 1.41 |
| D/E | 0.12 | 1.00 |
| Debt-to-Assets | 8.3% | 36.8% |
| Interest Coverage | 86.4 | 0.09 |
| Asset Turnover | 0.76 | 0.55 |
| Fixed Asset Turnover | 4.99 | 5.66 |
| Payout Ratio | 13.8% | 0 |
| Dividend Yield | 0.25% | 0 |
| Fiscal Year | 2025 | 2025 |
Efficiency & Valuation Duel: The Vital Signs
Ratios serve as a company’s DNA, uncovering hidden risks and revealing operational prowess that raw numbers alone cannot show.
Teradyne, Inc.
Teradyne demonstrates strong profitability with a 19.82% ROE and a healthy 17.37% net margin, signaling operational efficiency. Its valuation is stretched, marked by a high 54.64 P/E and elevated 10.83 P/B ratios. Shareholder returns are modest, with a low 0.25% dividend yield reflecting a reinvestment focus on R&D, which consumes 15.8% of revenue.
ATS Corporation
ATS shows weak profitability, with negative net margin (-1.11%) and ROE (-1.64%), signaling operational challenges. Despite a favorable negative P/E due to losses, its valuation appears more reasonable at a 2.06 P/B. ATS offers no dividend and faces high leverage and poor interest coverage, suggesting riskier capital structure and limited shareholder distributions.
Premium Valuation vs. Operational Safety
Teradyne leads with robust profitability but trades at a premium, reflecting growth expectations and solid capital allocation. ATS’s valuation is cheaper but masks fundamental weakness and financial stress. Investors prioritizing stability and returns may lean toward Teradyne, while those seeking turnaround potential might consider ATS’s riskier profile.
Which one offers the Superior Shareholder Reward?
I observe that Teradyne, Inc. (TER) offers a modest dividend yield near 0.25% with a conservative payout ratio around 14%. It covers dividends with strong free cash flow, supporting sustainability. TER also executes steady buybacks, enhancing total returns. ATS Corporation (ATS) pays no dividend and struggles with negative free cash flow and weak operating cash flow coverage. ATS relies on reinvestment but carries high debt and little buyback activity, raising risk. Historically, established dividend payers with balanced capital allocation like TER outperform peers during market cycles. I conclude TER offers the superior total shareholder reward in 2026 due to its sustainable distribution and disciplined buybacks.
Comparative Score Analysis: The Strategic Profile
The radar chart reveals the core financial DNA and strategic trade-offs of Teradyne, Inc. and ATS Corporation:
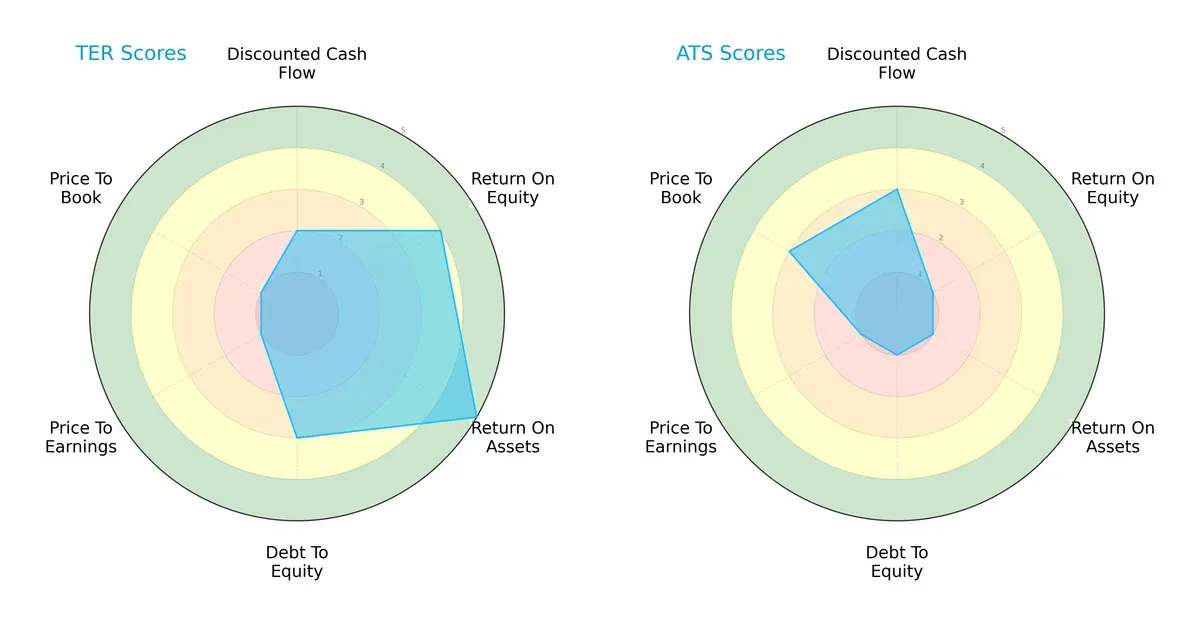
Teradyne shows a balanced strength in ROE (4) and ROA (5), indicating superior operational efficiency. ATS leans on a moderate DCF score (3) but suffers from weak profitability and financial stability metrics, including ROE (1) and Debt/Equity (1). Teradyne’s low valuation scores (PE/PB at 1) suggest potential market skepticism despite strong fundamentals. Overall, Teradyne offers a more balanced profile, while ATS relies heavily on discounted cash flow optimism.
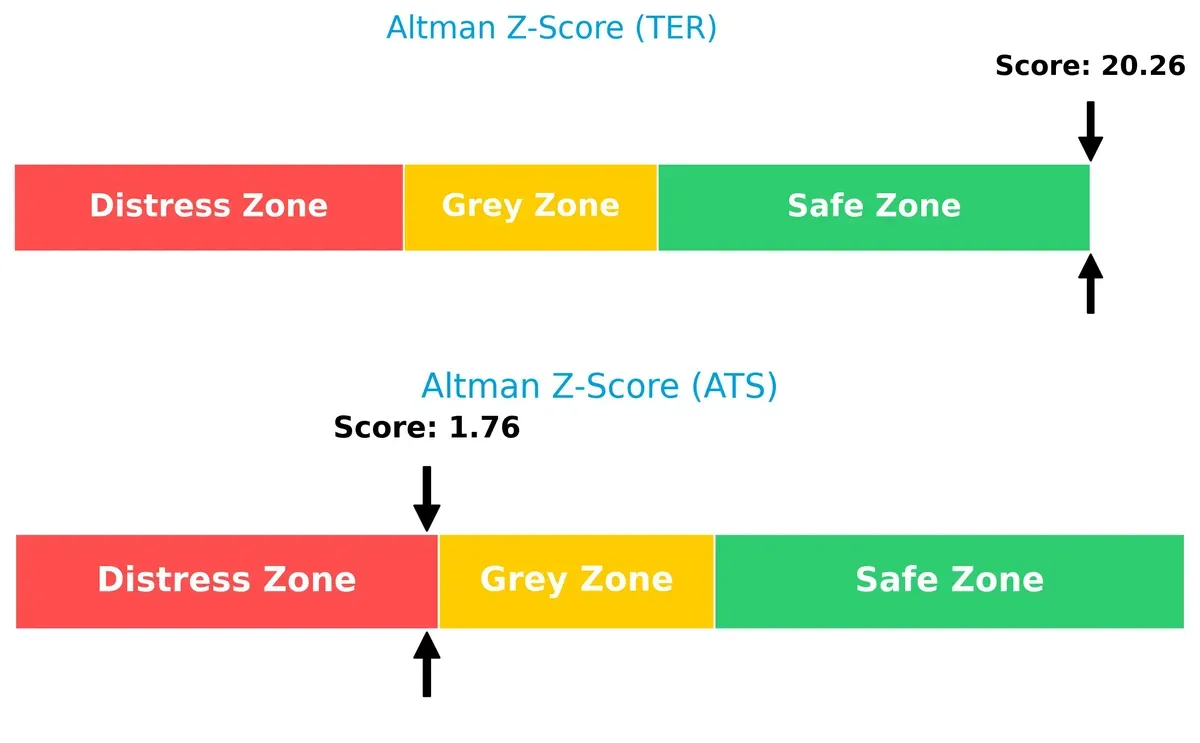
Bankruptcy Risk: Solvency Showdown
Teradyne’s Altman Z-Score at 20.3 places it firmly in the safe zone, signaling exceptional solvency. ATS’s score of 1.76 situates it in the distress zone, highlighting significant bankruptcy risk in this cycle:
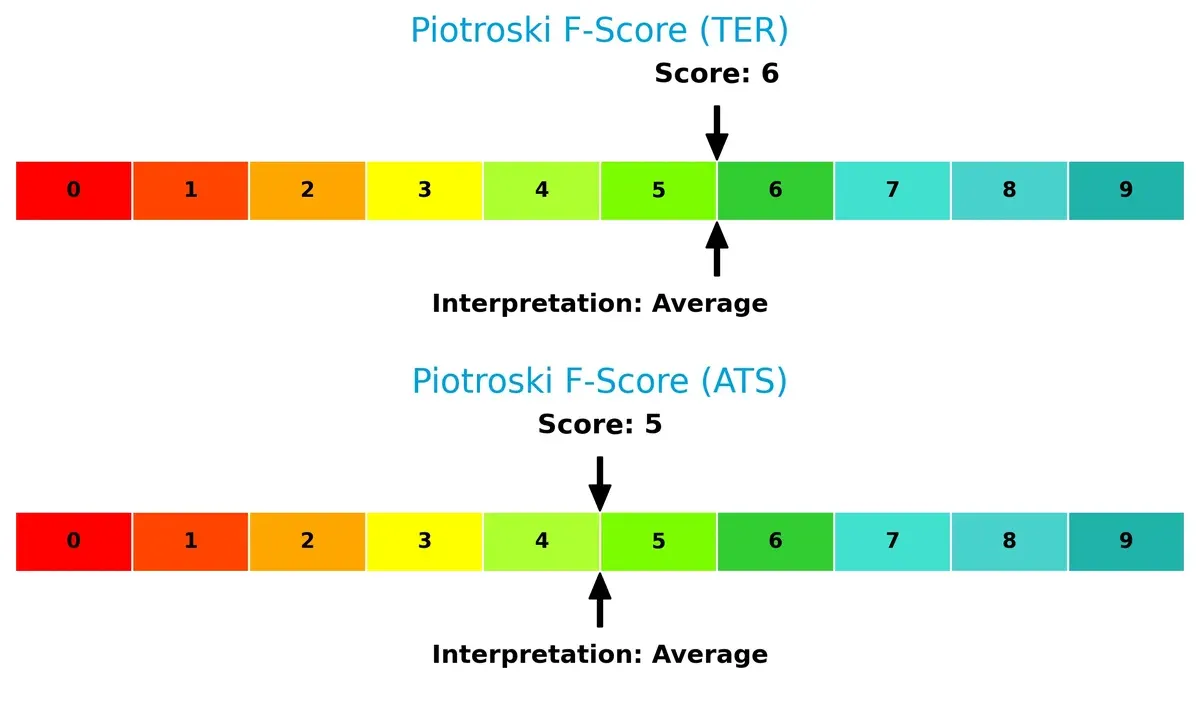
Financial Health: Quality of Operations
Teradyne’s Piotroski F-Score of 6 versus ATS’s 5 reflects a marginally stronger internal financial health. Neither firm hits peak quality, but ATS shows subtle red flags in operational metrics compared to Teradyne:
How are the two companies positioned?
This section dissects the operational DNA of Teradyne and ATS by comparing their revenue distribution by segment and internal dynamics. The final objective confronts their economic moats to identify which model offers the most resilient competitive advantage today.
Revenue Segmentation: The Strategic Mix
The following visual comparison dissects how Teradyne, Inc. and ATS Corporation diversify their income streams and where their primary sector bets lie:
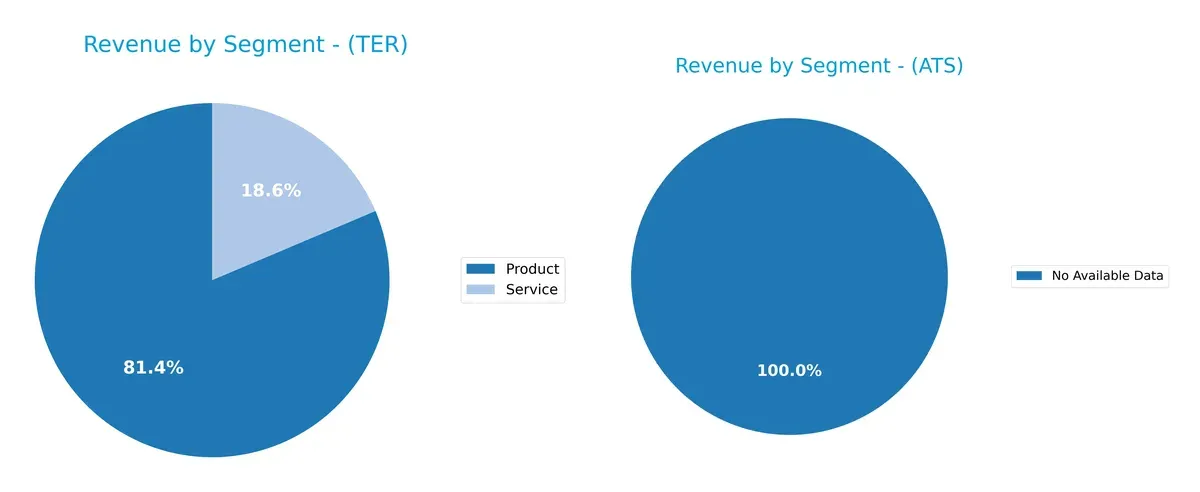
Teradyne, Inc. anchors its revenue predominantly in the Product segment, generating $2.3B in 2024, dwarfing its $525M Service revenue. ATS Corporation lacks available data for comparison. Teradyne’s heavy Product focus signals strong infrastructure dominance but raises concentration risk. Its Service arm provides some diversification but remains a smaller pillar. This split reflects a strategic bet on product innovation over service expansion.
Strengths and Weaknesses Comparison
This table compares the Strengths and Weaknesses of Teradyne, Inc. and ATS Corporation:
Teradyne, Inc. Strengths
- High profitability with 17.37% net margin
- Strong ROE at 19.82%
- Favorable ROIC at 18.45%
- Low debt-to-assets at 8.32%
- Solid current and quick ratios above 1.4
- Global presence in Asia, Europe, and US
ATS Corporation Strengths
- Favorable price-to-earnings due to negative net income
- Reasonable price-to-book at 2.06
- Adequate liquidity with current and quick ratios around 1.7
- Strong fixed asset turnover at 5.66
- Significant US and European revenue concentration
Teradyne, Inc. Weaknesses
- High valuation multiples (PE 54.64, PB 10.83) may pressure future returns
- Weighted average cost of capital higher than ROIC
- Low dividend yield at 0.25%
- Neutral asset turnover at 0.76
- Service segment slightly declining
ATS Corporation Weaknesses
- Negative profitability metrics: net margin -1.11%, ROE -1.64%, ROIC 0.09%
- High debt level with debt-to-equity at 1.0
- Poor interest coverage at 0.16
- No dividend yield
- Less diversified geographically, focused mainly in US and Europe
Teradyne exhibits robust profitability and strong balance sheet metrics but faces valuation risks and moderate asset efficiency. ATS struggles with profitability and leverage but maintains liquidity and asset utilization. Each company’s strengths and weaknesses suggest different strategic priorities in growth and financial management.
The Moat Duel: Analyzing Competitive Defensibility
A structural moat alone protects long-term profits from competition’s relentless erosion. Let’s dissect how Teradyne and ATS defend their turf:
Teradyne, Inc.: Technology-Driven Efficiency Moat
Teradyne leverages intangible assets and scale in semiconductor test equipment, reflected in a strong 20.5% EBIT margin and 6% ROIC premium over WACC. Despite a recent ROIC decline, new automation products and wireless test expansion could deepen its moat in 2026.
ATS Corporation: Service-Integrated Automation Moat
ATS relies on integrated automation solutions and post-sale services, a different moat from Teradyne’s tech focus. However, ATS struggles with a negative ROIC versus WACC and thin margins, signaling weak value creation. Expansion into connected factory software could offer a turnaround opportunity.
Moat Battle: Technology Precision vs. Service Integration
Teradyne’s wider moat stems from consistent value creation and margin strength, unlike ATS’s value-destroying trend. Teradyne is better positioned to defend market share amid intensifying competition.
Which stock offers better returns?
The past year shows stark contrasts in price dynamics: Teradyne, Inc. surges with accelerating momentum, while ATS Corporation faces a prolonged downtrend despite recent modest gains.

Trend Comparison
Teradyne, Inc. posts a 160.17% price increase over 12 months, marking a bullish trend with accelerating gains and a high volatility level of 39.17%. The stock hit a peak at 268.13 and a low of 68.72.
ATS Corporation records a 19.97% price decline over the same period, confirming a bearish trend despite recent 20.51% gains. Volatility remains low at 2.71%, with an accelerating downward trajectory.
Teradyne’s stock outperforms ATS clearly, delivering the highest market return with strong upward acceleration versus ATS’s sustained bearish trend.
Target Prices
Analysts show a clear consensus on target prices for Teradyne, Inc. and ATS Corporation.
| Company | Target Low | Target High | Consensus |
|---|---|---|---|
| Teradyne, Inc. | 175 | 335 | 276.08 |
| ATS Corporation | 34 | 34 | 34 |
Teradyne’s consensus target of 276.08 slightly exceeds its current price of 266.15, indicating moderate upside. ATS’s fixed target of 34 suggests limited near-term price growth versus its current 29.15.

Don’t Let Luck Decide Your Entry Point
Optimize your entry points with our advanced ProRealTime indicators. You’ll get efficient buy signals with precise price targets for maximum performance. Start outperforming now!
How do institutions grade them?
Teradyne, Inc. Grades
The latest institutional grades for Teradyne, Inc. are summarized below:
| Grading Company | Action | New Grade | Date |
|---|---|---|---|
| Cantor Fitzgerald | Maintain | Overweight | 2026-02-04 |
| Goldman Sachs | Maintain | Buy | 2026-02-04 |
| Stifel | Maintain | Buy | 2026-02-04 |
| Evercore ISI Group | Maintain | Outperform | 2026-02-04 |
| Citigroup | Maintain | Buy | 2026-02-04 |
| Evercore ISI Group | Maintain | Outperform | 2026-02-03 |
| Cantor Fitzgerald | Maintain | Overweight | 2026-02-02 |
| Stifel | Maintain | Buy | 2026-01-30 |
| UBS | Maintain | Buy | 2026-01-26 |
| B of A Securities | Maintain | Buy | 2026-01-22 |
ATS Corporation Grades
The following table shows the latest institutional grades for ATS Corporation:
| Grading Company | Action | New Grade | Date |
|---|---|---|---|
| JP Morgan | Maintain | Neutral | 2026-01-16 |
| JP Morgan | Maintain | Neutral | 2024-08-13 |
| Goldman Sachs | Maintain | Sell | 2024-08-13 |
| JP Morgan | Maintain | Neutral | 2024-05-24 |
Which company has the best grades?
Teradyne, Inc. consistently receives positive grades like Buy and Outperform from multiple firms. ATS Corporation mostly holds Neutral ratings, with a Sell from Goldman Sachs. Investors may view Teradyne’s stronger grades as a sign of greater confidence from analysts.
Risks specific to each company
The following categories identify the critical pressure points and systemic threats facing both firms in the 2026 market environment:
1. Market & Competition
Teradyne, Inc.
- Operates in the highly competitive semiconductor test and automation market; faces pressure from rapid tech innovation and cyclical chip demand.
ATS Corporation
- Competes in industrial automation with diverse end markets but struggles with profitability and market share amid slower industrial spending.
2. Capital Structure & Debt
Teradyne, Inc.
- Low debt-to-equity ratio (0.12) and strong interest coverage (81.43) signal a robust balance sheet and low financial risk.
ATS Corporation
- Debt-to-equity ratio is high (1.0) with weak interest coverage (0.16), indicating significant leverage and potential liquidity risks.
3. Stock Volatility
Teradyne, Inc.
- Beta of 1.82 shows above-market volatility, reflecting sensitivity to tech sector cycles and semiconductor market swings.
ATS Corporation
- Beta of 1.26 indicates moderate volatility but exposure to industrial market fluctuations and economic cycles.
4. Regulatory & Legal
Teradyne, Inc.
- Subject to tech export controls and IP regulations; geopolitical tensions could impact supply chains and sales.
ATS Corporation
- Faces industrial safety standards and cross-border trade policies; less exposed to technology export restrictions.
5. Supply Chain & Operations
Teradyne, Inc.
- Complex global semiconductor supply chain vulnerable to chip shortages and component delays.
ATS Corporation
- Relies on diversified suppliers but exposed to industrial material price volatility and logistic disruptions.
6. ESG & Climate Transition
Teradyne, Inc.
- Tech sector pressure to reduce carbon footprint and enhance sustainability in manufacturing and products.
ATS Corporation
- Industrial sector faces rising ESG compliance costs and demands for energy-efficient automation solutions.
7. Geopolitical Exposure
Teradyne, Inc.
- High exposure to US-China relations impacting semiconductor supply and sales markets.
ATS Corporation
- Moderate geopolitical risk with Canadian base and diversified global operations.
Which company shows a better risk-adjusted profile?
Teradyne’s most impactful risk is its market and competitive cyclicality in semiconductors, balanced by a rock-solid financial position and superior Altman Z-score. ATS faces severe financial distress risks from high leverage and negative profitability, undermining its operational resilience. Teradyne displays a clearly better risk-adjusted profile, supported by its strong balance sheet and safer bankruptcy risk zone in 2026.
Final Verdict: Which stock to choose?
Teradyne, Inc. thrives on its superior capital efficiency and robust profitability, consistently generating returns well above its cost of capital. Its declining ROIC trend is a point of vigilance, signaling potential pressure on future margins. Teradyne suits investors seeking aggressive growth anchored in operational excellence.
ATS Corporation’s strategic moat lies in its niche manufacturing capabilities, but its current financials reveal value erosion and weak profitability. Compared to Teradyne, ATS presents higher risk and less stability. It may fit portfolios focused on speculative turnaround plays or deep value with patience.
If you prioritize strong economic moats and proven value creation, Teradyne outshines ATS due to its consistent return profile and operational strength. However, if you seek contrarian opportunities with potential for recovery, ATS offers a higher-risk scenario but demands careful risk management given its financial challenges.
Disclaimer: Investment carries a risk of loss of initial capital. The past performance is not a reliable indicator of future results. Be sure to understand risks before making an investment decision.
Go Further
I encourage you to read the complete analyses of Teradyne, Inc. and ATS Corporation to enhance your investment decisions: