Rockwell Automation, Inc. (ROK) and Kadant Inc. (KAI) are two prominent players in the industrial machinery sector, each advancing innovation in automation and engineered systems. While Rockwell focuses on digital transformation and intelligent devices, Kadant specializes in flow control and material handling solutions. Their market overlap and distinct strategies make this comparison essential for investors seeking growth and stability. Let’s explore which company offers the most compelling investment opportunity.

Table of contents
Companies Overview
I will begin the comparison between Rockwell Automation and Kadant by providing an overview of these two companies and their main differences.
Rockwell Automation Overview
Rockwell Automation, Inc. focuses on industrial automation and digital transformation solutions worldwide. Operating through Intelligent Devices, Software & Control, and Lifecycle Services segments, it provides hardware, software, and consulting services. Its diverse customer base spans automotive, semiconductor, logistics, and various industrial and process markets. Founded in 1903, Rockwell Automation is headquartered in Milwaukee, Wisconsin, with a market cap of approximately 46B USD.
Kadant Overview
Kadant Inc. supplies technologies and engineered systems globally via three segments: Flow Control, Industrial Processing, and Material Handling. Its products include fluid-handling systems, industrial automation, and conveying equipment for industries such as packaging, tissue, wood products, and alternative fuels. Established in 1991 and based in Westford, Massachusetts, Kadant has a market cap of about 3.8B USD and serves a specialized industrial machinery niche.
Key similarities and differences
Both Rockwell Automation and Kadant operate in the industrial machinery sector in the US and trade on the NYSE. While Rockwell Automation emphasizes comprehensive automation and digital solutions with a broad industrial customer base, Kadant focuses on engineered systems and equipment for specific industrial processes. Rockwell’s larger scale and diversified segments contrast with Kadant’s more focused product lines and smaller workforce.
Income Statement Comparison
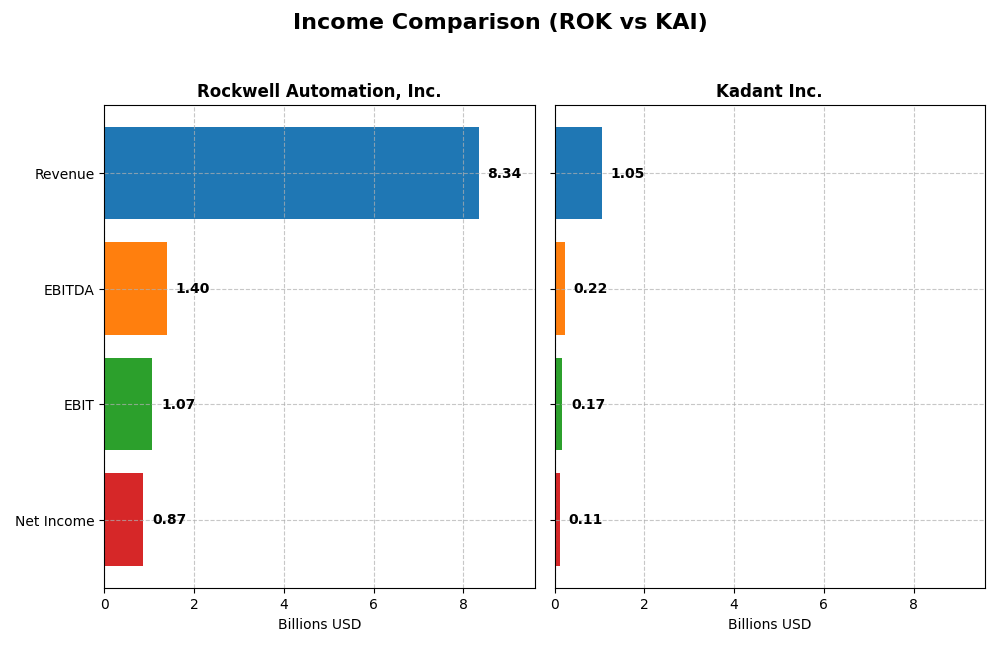
The table below presents a side-by-side comparison of key income statement metrics for Rockwell Automation, Inc. and Kadant Inc. for their most recent fiscal years.
| Metric | Rockwell Automation, Inc. | Kadant Inc. |
|---|---|---|
| Market Cap | 46.1B | 3.8B |
| Revenue | 8.34B | 1.05B |
| EBITDA | 1.40B | 223M |
| EBIT | 1.07B | 173M |
| Net Income | 869M | 112M |
| EPS | 7.69 | 9.51 |
| Fiscal Year | 2025 | 2024 |
Income Statement Interpretations
Rockwell Automation, Inc.
Rockwell Automation’s revenue showed a steady overall increase of 19.22% from 2021 to 2025, reaching $8.34B in 2025. However, net income declined by 36.01% over the same period, with margins compressing noticeably. The latest fiscal year saw revenue growth slow to 0.97%, alongside a 9.64% decline in net margin, signaling margin pressures despite a 9.17% rise in gross profit.
Kadant Inc.
Kadant’s revenue expanded strongly by 65.88% from 2020 to 2024, reaching $1.05B, with net income more than doubling over the period. Margins generally improved, with a 21.89% net margin growth overall. In 2024, revenue rose 9.99% but net margin fell 12.59%, indicating some margin compression despite a solid top-line expansion and a modest 3.4% EBIT growth.
Which one has the stronger fundamentals?
Kadant presents stronger fundamentals overall, supported by robust revenue and net income growth alongside improving margins over the long term. Rockwell Automation, despite higher scale, faces margin deterioration and net income declines, with recent slower revenue growth. Kadant’s favorable income statement evaluation contrasts with Rockwell’s predominantly unfavorable trends, reflecting more resilient profitability and growth dynamics.
Financial Ratios Comparison
The table below presents a side-by-side comparison of key financial ratios for Rockwell Automation, Inc. (ROK) and Kadant Inc. (KAI) based on their most recent fiscal year data.
| Ratios | Rockwell Automation, Inc. (ROK) | Kadant Inc. (KAI) |
|---|---|---|
| ROE | 23.78% | 13.17% |
| ROIC | 13.71% | 10.08% |
| P/E | 45.33 | 36.90 |
| P/B | 10.78 | 4.86 |
| Current Ratio | 1.14 | 2.31 |
| Quick Ratio | 0.77 | 1.55 |
| D/E | 1.00 | 0.38 |
| Debt-to-Assets | 32.51% | 22.57% |
| Interest Coverage | 9.12 | 8.55 |
| Asset Turnover | 0.74 | 0.74 |
| Fixed Asset Turnover | 6.95 | 6.18 |
| Payout ratio | 68.01% | 13.15% |
| Dividend yield | 1.50% | 0.36% |
Interpretation of the Ratios
Rockwell Automation, Inc.
Rockwell Automation shows a slightly favorable ratio profile with strong net margin at 10.42% and robust return on equity of 23.78%. However, high price-to-earnings (PE) and price-to-book (PB) ratios indicate potential overvaluation risks. The company maintains a steady dividend yield of 1.5%, supported by payout ratios and moderate share repurchases, though cash flow coverage could be a concern.
Kadant Inc.
Kadant displays a favorable overall ratio evaluation, with solid net margin (10.59%) and good return on invested capital (10.08%). Its liquidity ratios are strong, with a current ratio of 2.31 and a debt-to-equity ratio of 0.38, indicating conservative leverage. Despite paying dividends, the yield is low at 0.36%, suggesting limited income focus in shareholder returns.
Which one has the best ratios?
Kadant’s financial ratios appear stronger overall, benefiting from superior liquidity and lower leverage, alongside a favorable return on capital. Rockwell Automation delivers higher profitability and dividend yield but faces valuation and liquidity challenges. The choice depends on the investor’s emphasis on profitability versus balance sheet strength.
Strategic Positioning
This section compares the strategic positioning of Rockwell Automation and Kadant, focusing on market position, key segments, and exposure to technological disruption:
Rockwell Automation, Inc.
- Leading industrial automation provider with strong market cap and competitive pressure.
- Diversified segments: Intelligent Devices, Software & Control, Lifecycle Services driving revenues.
- Invests heavily in digital transformation solutions and software, embracing technological innovation.
Kadant Inc.
- Smaller market cap with focused industrial machinery niche and moderate competitive pressure.
- Concentrated in Flow Control, Industrial Processing, and Material Handling segments.
- Primarily supplies engineered systems with less emphasis on digital disruption.
Rockwell Automation vs Kadant Positioning
Rockwell Automation adopts a diversified approach across multiple industrial and process markets, enhancing resilience but facing complex competition. Kadant concentrates on engineered systems and fluid handling, offering specialization but potentially less market breadth.
Which has the best competitive advantage?
Rockwell Automation shows a very favorable moat with ROIC well above WACC and growing profitability, indicating a durable competitive advantage. Kadant’s moat is slightly favorable with growing ROIC but is still shedding value, reflecting a weaker competitive position.
Stock Comparison
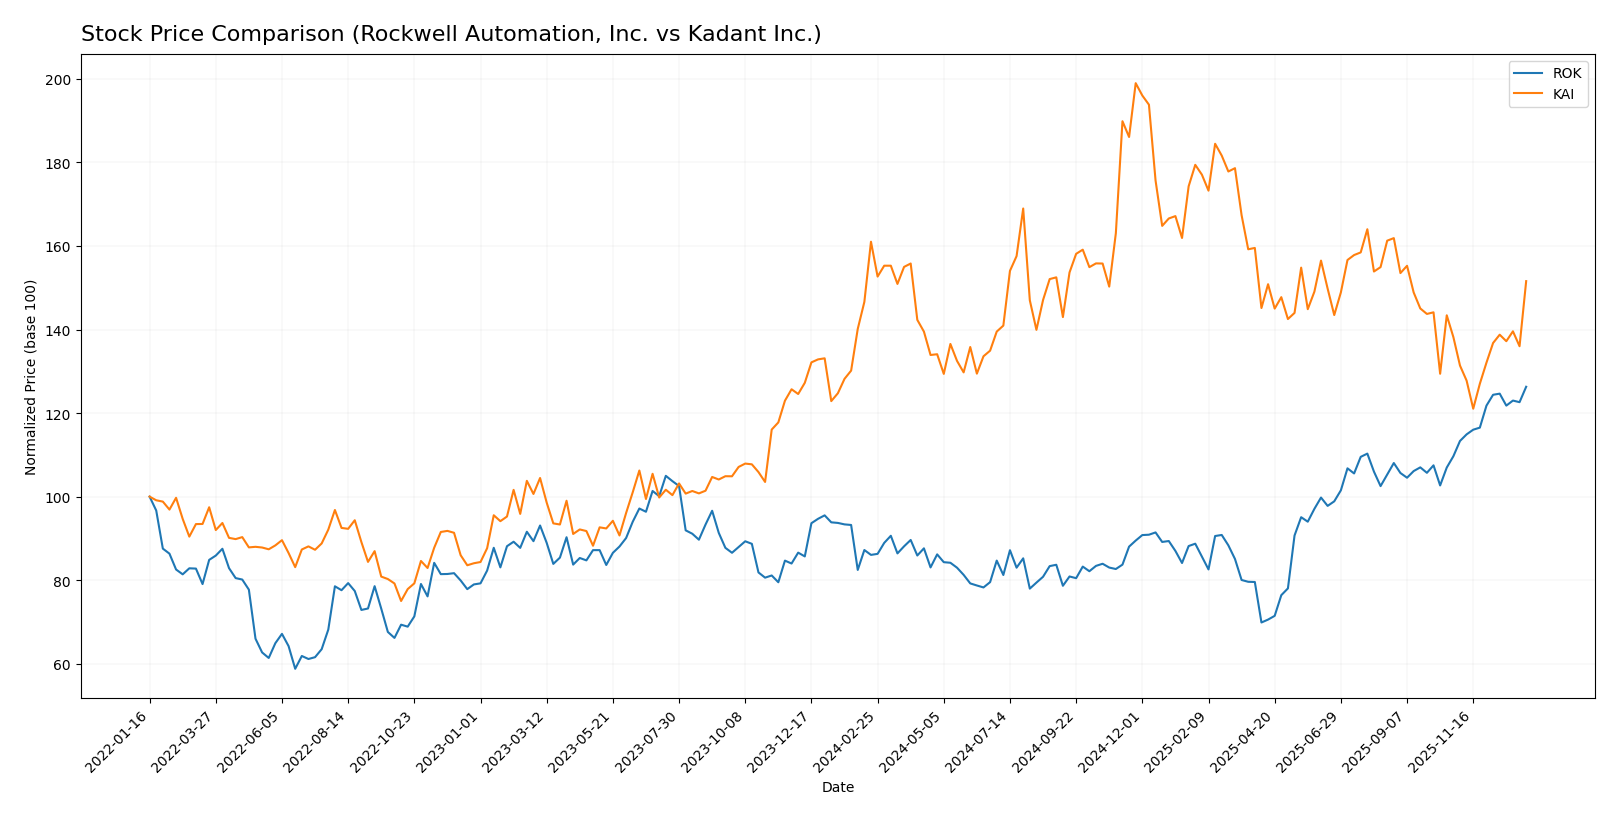
The stock price movements of Rockwell Automation, Inc. and Kadant Inc. over the past year reveal distinct trading dynamics, with Rockwell showing a strong upward trajectory while Kadant experiences a moderate decline.
Trend Analysis
Rockwell Automation, Inc. exhibited a bullish trend over the past 12 months with a 46.76% price increase and accelerating momentum, reaching a high of 410.53 and a low of 227.11, supported by significant volatility (std deviation 44.57).
Kadant Inc. showed a bearish trend with a 5.86% price decrease over the same period, accompanied by acceleration and a high volatility level (std deviation 34.44), hitting a peak of 419.01 and a low of 254.91.
Comparing the two, Rockwell Automation delivered the highest market performance with a strong bullish trend, whereas Kadant’s stock trended downward despite recent positive momentum.
Target Prices
The current analyst consensus reveals moderate upside potential for both Rockwell Automation, Inc. and Kadant Inc.
| Company | Target High | Target Low | Consensus |
|---|---|---|---|
| Rockwell Automation, Inc. | 470 | 380 | 421.57 |
| Kadant Inc. | 410 | 275 | 342.5 |
Analysts expect Rockwell Automation’s price to slightly rise from its current 410.53 USD, while Kadant’s target consensus suggests a notable potential increase from 319.22 USD. Both stocks show a cautiously optimistic outlook.
Analyst Opinions Comparison
This section compares analysts’ ratings and grades for Rockwell Automation, Inc. (ROK) and Kadant Inc. (KAI):
Rating Comparison
ROK Rating
- Rating: B-, considered very favorable overall.
- Discounted Cash Flow Score: 3, indicating moderate valuation.
- ROE Score: 5, very favorable efficiency in equity use.
- ROA Score: 4, favorable asset utilization.
- Debt To Equity Score: 1, very unfavorable financial risk.
- Overall Score: 3, a moderate summary of financial standing.
KAI Rating
- Rating: B, considered very favorable overall.
- Discounted Cash Flow Score: 3, indicating moderate valuation.
- ROE Score: 3, moderate efficiency in equity use.
- ROA Score: 4, favorable asset utilization.
- Debt To Equity Score: 3, moderate financial risk.
- Overall Score: 3, a moderate summary of financial standing.
Which one is the best rated?
Based strictly on the data provided, ROK has a stronger ROE score but a weaker debt-to-equity score compared to KAI. Both have the same overall and discounted cash flow scores, but KAI presents a more balanced financial risk profile.
Scores Comparison
Here is a comparison of the Altman Z-Score and Piotroski Score for Rockwell Automation and Kadant Inc.:
Rockwell Automation Scores
- Altman Z-Score: 5.32, indicating a safe zone with low bankruptcy risk.
- Piotroski Score: 8, classified as very strong financial health.
Kadant Scores
- Altman Z-Score: 5.59, indicating a safe zone with low bankruptcy risk.
- Piotroski Score: 7, classified as strong financial health.
Which company has the best scores?
Kadant has a slightly higher Altman Z-Score, while Rockwell Automation has a higher Piotroski Score. Rockwell Automation’s Piotroski rating is very strong compared to Kadant’s strong rating, suggesting a marginally stronger financial health assessment there.
Grades Comparison
This section presents a comparison of the recent grades assigned to Rockwell Automation, Inc. and Kadant Inc. by recognized financial institutions:
Rockwell Automation, Inc. Grades
The table below shows the latest grades from reputable financial firms for Rockwell Automation, Inc.:
| Grading Company | Action | New Grade | Date |
|---|---|---|---|
| Wells Fargo | Maintain | Equal Weight | 2026-01-07 |
| Barclays | Maintain | Overweight | 2026-01-07 |
| Goldman Sachs | Upgrade | Neutral | 2025-12-16 |
| Jefferies | Maintain | Buy | 2025-12-10 |
| Citigroup | Maintain | Buy | 2025-12-08 |
| Barclays | Maintain | Overweight | 2025-12-04 |
| Baird | Maintain | Outperform | 2025-11-21 |
| B of A Securities | Maintain | Buy | 2025-11-20 |
| JP Morgan | Maintain | Neutral | 2025-11-11 |
| Morgan Stanley | Maintain | Overweight | 2025-11-10 |
Rockwell Automation’s grades show a solid mix of Buy, Overweight, and Neutral opinions, with a recent upgrade from Sell to Neutral by Goldman Sachs indicating some positive momentum.
Kadant Inc. Grades
The table below presents the latest grades from respected financial firms for Kadant Inc.:
| Grading Company | Action | New Grade | Date |
|---|---|---|---|
| Barrington Research | Maintain | Outperform | 2025-10-30 |
| Barrington Research | Maintain | Outperform | 2025-10-29 |
| Barrington Research | Maintain | Outperform | 2025-10-27 |
| Barrington Research | Maintain | Outperform | 2025-10-10 |
| Barrington Research | Maintain | Outperform | 2025-09-23 |
| DA Davidson | Maintain | Neutral | 2025-08-04 |
| Barrington Research | Maintain | Outperform | 2025-07-30 |
| Barrington Research | Maintain | Outperform | 2025-07-29 |
| Barrington Research | Maintain | Outperform | 2025-05-01 |
| DA Davidson | Maintain | Neutral | 2025-05-01 |
Kadant’s grades are predominantly Outperform from Barrington Research, complemented by Neutral grades from DA Davidson, indicating a generally positive outlook.
Which company has the best grades?
Kadant Inc. has received consistently stronger grades, mostly Outperform, compared to Rockwell Automation’s mix of Buy, Overweight, and Neutral ratings. This suggests Kadant may be viewed more favorably by analysts, potentially impacting investor sentiment and portfolio decisions accordingly.
Strengths and Weaknesses
Below is a comparison of the key strengths and weaknesses of Rockwell Automation, Inc. (ROK) and Kadant Inc. (KAI) based on the most recent financial and operational data.
| Criterion | Rockwell Automation, Inc. (ROK) | Kadant Inc. (KAI) |
|---|---|---|
| Diversification | Highly diversified revenue streams across Intelligent Devices, Software & Control, and Lifecycle Services segments | Less diversified, mainly focused on Capital and Parts & Consumables segments |
| Profitability | Strong profitability with 10.42% net margin and 23.78% ROE, creating significant value over WACC | Moderate profitability with 10.59% net margin but lower ROE at 13.17%, shedding some value vs. cost of capital |
| Innovation | Demonstrates durable competitive advantage with growing ROIC (+77%) and high R&D focus on software and intelligent devices | Growing ROIC (+31%), but less evidence of strong moat or innovation-led growth |
| Global presence | Strong global footprint supported by diverse industrial sectors and service offerings | More niche market presence, concentrated in papermaking and fiber-based products |
| Market Share | Market leader with broad industrial automation solutions and strong brand recognition | Smaller market share, specialized in paper and wood processing equipment |
Key takeaways: Rockwell Automation offers a broader, more diversified business with a strong competitive advantage and superior profitability. Kadant is improving profitability and ROIC but remains more niche-focused with a less durable moat. Investors should weigh Rockwell’s stability against Kadant’s growth potential and sector focus.
Risk Analysis
Below is a comparative table presenting key risks associated with Rockwell Automation, Inc. (ROK) and Kadant Inc. (KAI) based on the latest available data for 2025 and 2024 respectively:
| Metric | Rockwell Automation, Inc. (ROK) | Kadant Inc. (KAI) |
|---|---|---|
| Market Risk | High beta at 1.516 indicates elevated market volatility exposure | Moderate beta at 1.245 suggests moderate market sensitivity |
| Debt level | Debt-to-equity neutral at 1.0; interest coverage favorable at 6.88 | Favorable low debt-to-equity at 0.38; strong interest coverage at 8.64 |
| Regulatory Risk | Moderate given diversified industrial markets and global operations | Moderate, with exposure to industrial processing and environmental regulations |
| Operational Risk | Moderate complexity from multiple segments and digital transformation efforts | Moderate, with reliance on engineered systems and global supply chains |
| Environmental Risk | Present due to eco-industrial and renewable energy market involvement | Present from material handling and industrial processing sectors |
| Geopolitical Risk | Moderate, with international sales; impacts on supply chain and market access | Moderate, with global operations but smaller scale |
Synthesizing these risks, market risk is the most likely for both companies given their beta values, with Rockwell Automation facing higher volatility. Debt-related risks are more contained for Kadant due to its lower leverage and stronger interest coverage. Regulatory and environmental risks persist due to industry nature but are manageable. Investors should monitor market conditions closely as they represent the most impactful risk factor currently.
Which Stock to Choose?
Rockwell Automation, Inc. (ROK) shows mixed income evolution with slight revenue growth but declining net margin and EPS over 2021–2025. Its financial ratios are slightly favorable, profitability strong, debt moderate, and it holds a very favorable B- rating. The company creates value with a very favorable moat and strong financial health scores.
Kadant Inc. (KAI) exhibits favorable income growth overall, including net income and EPS, with mostly positive financial ratios and good profitability. Its debt profile is favorable, and it has a very favorable B rating. The company’s moat is slightly favorable, indicating growing profitability but still shedding value, supported by solid financial strength scores.
Investors focused on value creation and durable competitive advantage might find ROK’s very favorable moat and strong profitability metrics appealing, while those prioritizing income growth and financial stability may see KAI’s favorable income evolution and lower debt metrics as advantageous. The choice could depend on whether the investor prefers a company with a stronger moat or one with more consistent income growth.
Disclaimer: Investment carries a risk of loss of initial capital. The past performance is not a reliable indicator of future results. Be sure to understand risks before making an investment decision.
Go Further
I encourage you to read the complete analyses of Rockwell Automation, Inc. and Kadant Inc. to enhance your investment decisions: