In an ever-evolving industrial landscape, Rockwell Automation, Inc. (ROK) and ATS Corporation (ATS) stand out as key players in the automation sector. Both companies operate within the Industrial – Machinery industry, focusing on automation solutions that bridge the gap between technology and manufacturing efficiency. Their overlapping markets and innovative strategies make this comparison particularly relevant for investors seeking to understand which company might yield better returns. As we delve into their performances and strategies, I invite you to discover which of these companies could be the most intriguing addition to your investment portfolio.

Table of contents
Company Overview
Rockwell Automation, Inc. Overview
Rockwell Automation, Inc. (ROK) is a global leader in industrial automation and digital transformation. Founded in 1903 and headquartered in Milwaukee, Wisconsin, the company operates through three segments: Intelligent Devices, Software & Control, and Lifecycle Services. Rockwell’s mission is to empower companies to achieve greater productivity and sustainability through innovative automation solutions. With a market capitalization of approximately $44.5B, Rockwell serves a diverse array of industries, including automotive, aerospace, and food and beverage, by providing tailored solutions that enhance operational efficiency and improve safety.
ATS Corporation Overview
ATS Corporation (ATS) specializes in automation solutions that enhance manufacturing processes. Established in 1978 and based in Cambridge, Canada, ATS has a market cap of around $2.5B. The company focuses on the planning, designing, and servicing of automated systems and offers a comprehensive range of services from pre-automation analysis to post-automation support. Its mission is to drive operational excellence for clients across various sectors, such as life sciences and transportation, by leveraging technology to optimize production and reduce downtime.
Key Similarities and Differences
Both Rockwell Automation and ATS operate within the industrial machinery sector and offer automation solutions to enhance productivity. However, Rockwell emphasizes software and digital transformation alongside hardware, while ATS focuses more on comprehensive automation system services and contract manufacturing. This distinction highlights their respective strategies in addressing market needs.
Income Statement Comparison
The following table summarizes the income statements for Rockwell Automation, Inc. and ATS Corporation for their most recent fiscal years, providing insight into their financial performance.
| Metric | Rockwell Automation, Inc. (ROK) | ATS Corporation (ATS) |
|---|---|---|
| Revenue | 8.34B | 2.53B |
| EBITDA | 1.40B | 168M |
| EBIT | 1.07B | 15M |
| Net Income | 869M | -28M |
| EPS | 7.69 | -0.29 |
Interpretation of Income Statement
In the most recent fiscal year, Rockwell Automation demonstrated strong revenue growth at 8.34B, a marginal increase from the previous year. Net income also showed stability at 869M, though margins contracted slightly due to increased operating expenses. In contrast, ATS Corporation faced challenges, with a revenue decline to 2.53B and a net loss of 28M. The company’s EBITDA of 168M indicates struggles with profitability, and the negative EPS suggests ongoing financial difficulties. Overall, Rockwell Automation appears to be on a solid growth trajectory, while ATS must address its operational inefficiencies to improve future performance.
Financial Ratios Comparison
The table below provides a comparative overview of key financial ratios for Rockwell Automation, Inc. (ROK) and ATS Corporation (ATS) as of their most recent fiscal years.
| Metric | ROK (2025) | ATS (2025) |
|---|---|---|
| ROE | 0 | -0.016 |
| ROIC | 0 | 0.0009 |
| P/E | 0 | -125.28 |
| P/B | 0 | 2.06 |
| Current Ratio | 2.37 | 1.69 |
| Quick Ratio | 1.56 | 1.41 |
| D/E | 0.97 | 0.99 |
| Debt-to-Assets | 0.32 | 0.37 |
| Interest Coverage | 0 | 0.09 |
| Asset Turnover | 0 | 0.55 |
| Fixed Asset Turnover | 0 | 5.66 |
| Payout Ratio | 0 | 0 |
| Dividend Yield | 0 | 0 |
Interpretation of Financial Ratios
The financial ratios reveal significant differences between ROK and ATS. ROK shows strong liquidity with a current ratio of 2.37, indicating a solid short-term financial position. However, the absence of profitability metrics raises concerns about its operational efficiency. Conversely, ATS struggles with negative profitability indicators, a high P/E ratio, and a low interest coverage ratio, suggesting potential financial distress. Investors should be cautious and monitor these trends closely to manage risks effectively.
Dividend and Shareholder Returns
Rockwell Automation, Inc. (ROK) pays dividends, with a recent annual yield of 1.87% and a payout ratio of approximately 60%. This indicates a sustainable approach, supported by robust free cash flow coverage. However, the company must manage risks related to excessive repurchases.
Conversely, ATS Corporation (ATS) does not distribute dividends, likely due to its growth phase and ongoing reinvestments. While it has not returned capital to shareholders, it engages in share buybacks, suggesting a strategy focused on long-term value creation without immediate distributions.
Strategic Positioning
Rockwell Automation, Inc. (ROK) holds a significant market share in the industrial automation sector, leveraging its extensive portfolio of intelligent devices and software solutions. With a market cap of approximately $44.5B, it faces competitive pressure from ATS Corporation (ATS), which, despite a smaller market cap of $2.5B, offers innovative automation solutions across various industries. Both companies must navigate technological disruptions and evolving customer demands to maintain their competitive edge in this rapidly changing landscape.
Stock Comparison
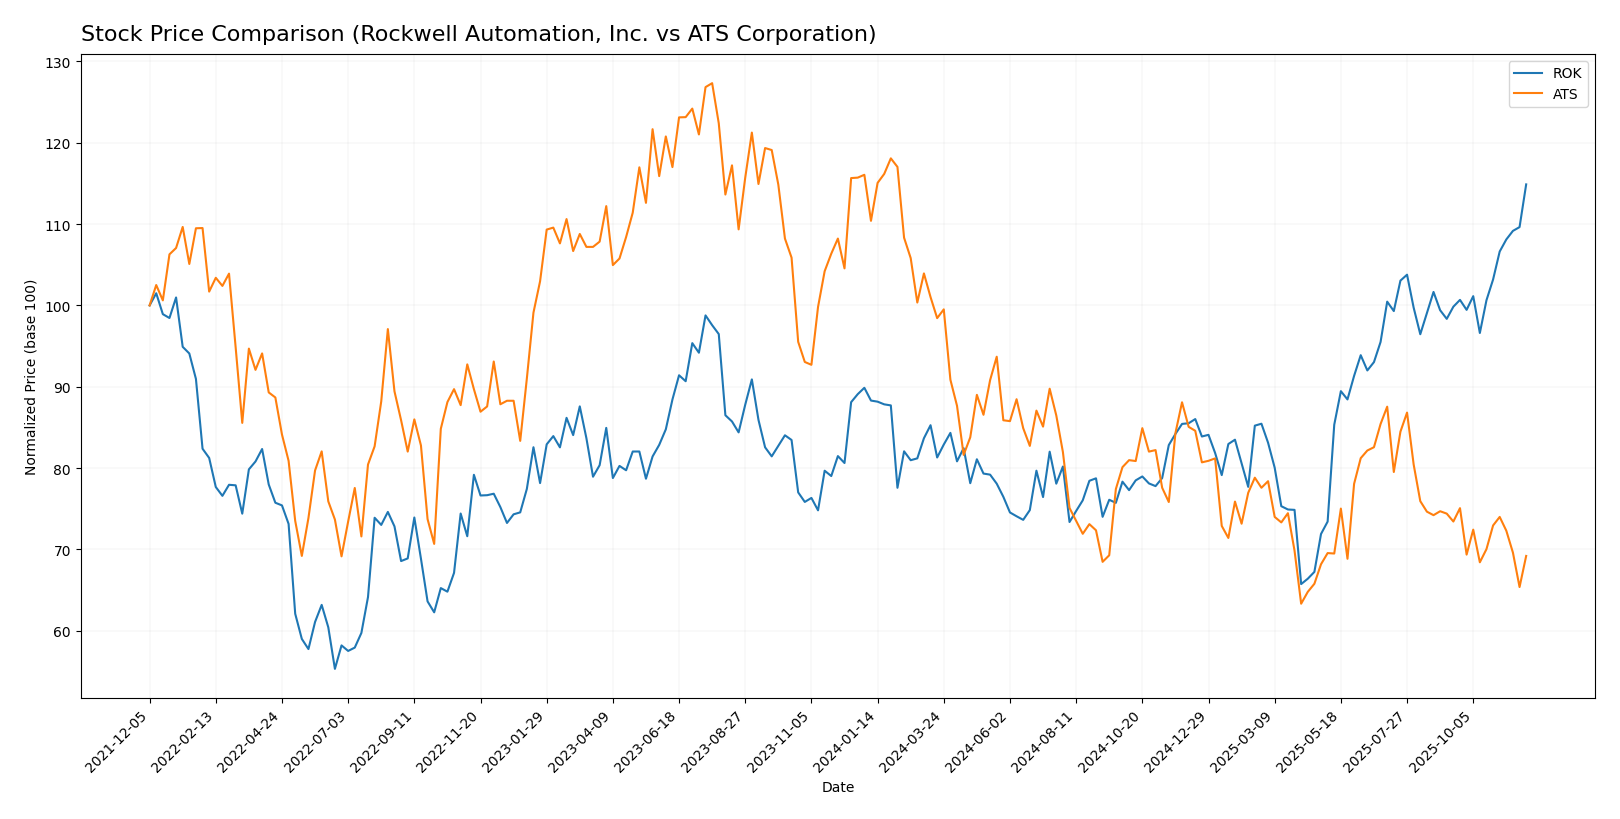
In this section, I will analyze the stock price movements of Rockwell Automation, Inc. (ROK) and ATS Corporation (ATS) over the past year, highlighting key price dynamics and trading behaviors.

Trend Analysis
Rockwell Automation, Inc. (ROK) Over the past year, ROK’s stock price has increased by 30.1%, indicating a bullish trend. The highest price recorded during this period was $396.88, while the lowest was $227.11. The stock’s trend is currently characterized by acceleration, with a standard deviation of 36.72, suggesting notable volatility. In the recent period from September 14, 2025, to November 30, 2025, ROK experienced a 15.06% increase, further reinforcing its bullish outlook.
ATS Corporation (ATS) Conversely, ATS has seen a significant decline of -37.32% over the same timeframe, reflecting a bearish trend. During this period, the stock reached a high of $43.82 and a low of $23.50. The trend is classified as one of deceleration, with a standard deviation of 4.44, indicating lower volatility compared to ROK. In the recent analysis period from September 14, 2025, to November 30, 2025, ATS recorded a -5.76% change, which underlines its continuing bearish trajectory.
In summary, while ROK exhibits a strong upward momentum, ATS faces ongoing challenges that suggest careful consideration for potential investors.
Analyst Opinions
Recent analyst recommendations for Rockwell Automation, Inc. (ROK) and ATS Corporation (ATS) present a cautious outlook. ROK holds a rating of C-, with analysts highlighting concerns over its low scores in return on equity and assets. Conversely, ATS has a slightly better rating of C, with strengths in discounted cash flow, though still facing challenges. Analysts suggest a cautious approach for both stocks, indicating a consensus of hold for the current year. Given these ratings, I advise investors to carefully weigh their options before making any decisions.
Stock Grades
We have some reliable stock grades available for Rockwell Automation, Inc. (ROK), while no recent verified grades are found for ATS Corporation (ATS).
Rockwell Automation, Inc. Grades
| Grading Company | Action | New Grade | Date |
|---|---|---|---|
| Baird | maintain | Outperform | 2025-11-21 |
| B of A Securities | maintain | Buy | 2025-11-20 |
| JP Morgan | maintain | Neutral | 2025-11-11 |
| Morgan Stanley | maintain | Overweight | 2025-11-10 |
| Barclays | maintain | Overweight | 2025-11-07 |
| Wells Fargo | maintain | Equal Weight | 2025-11-07 |
| JP Morgan | maintain | Neutral | 2025-10-15 |
| Oppenheimer | maintain | Outperform | 2025-10-14 |
| Wells Fargo | maintain | Equal Weight | 2025-10-06 |
| Barclays | maintain | Overweight | 2025-08-14 |
Overall, Rockwell Automation maintains a positive outlook with multiple grading companies affirming their grades, indicating strong investor confidence. In contrast, ATS Corporation currently lacks updated and reliable stock grades, reflecting a more uncertain market position.
Target Prices
For Rockwell Automation, Inc. (ROK) and ATS Corporation (ATS), reliable target price data has been obtained from analysts.
| Company | Target High | Target Low | Consensus |
|---|---|---|---|
| Rockwell Automation | 402 | 345 | 377.6 |
| ATS Corporation | 34 | 34 | 34 |
Analysts expect Rockwell Automation to reach a consensus target price of 377.6, slightly below its current price of 396.3, indicating a cautious outlook. In contrast, ATS is expected to maintain its target price of 34, reflecting stability given its current price of 25.71.
Strengths and Weaknesses
The following table summarizes the strengths and weaknesses of Rockwell Automation, Inc. (ROK) and ATS Corporation (ATS) based on the most recent data.
| Criterion | Rockwell Automation (ROK) | ATS Corporation (ATS) |
|---|---|---|
| Diversification | Strong product range | Limited diversification |
| Profitability | High profit margins | Low to negative margins |
| Innovation | High investment in R&D | Moderate innovation |
| Global presence | Established in key markets | Growing presence |
| Market Share | Significant in automation | Smaller market share |
| Debt level | Moderate debt | Higher debt levels |
Key takeaways indicate that Rockwell Automation shows strong profitability and innovation, while ATS struggles with profitability and has a limited market presence. Investors should weigh these factors against their risk tolerance and investment strategy.
Risk Analysis
The following table outlines the key risks associated with Rockwell Automation, Inc. (ROK) and ATS Corporation (ATS).
| Metric | Rockwell Automation, Inc. | ATS Corporation |
|---|---|---|
| Market Risk | Medium | High |
| Regulatory Risk | High | Medium |
| Operational Risk | Medium | High |
| Environmental Risk | Medium | Medium |
| Geopolitical Risk | High | Medium |
Both companies face significant market and regulatory risks. Rockwell Automation is particularly vulnerable to geopolitical tensions affecting global supply chains, while ATS Corporation grapples with operational risks due to its reliance on technology-driven automation solutions. Recent economic fluctuations underscore the importance of evaluating these risks before investing.
Which one to choose?
When comparing Rockwell Automation, Inc. (ROK) and ATS Corporation (ATS), ROK emerges as the stronger candidate for investors. ROK demonstrates a bullish stock trend with a 30.1% price increase over the past year, while ATS has experienced a bearish trend with a 37.32% decline. ROK’s financial health reflects a solid gross profit margin of 44.5% and a net profit margin of 11.5%, which are indicative of its robust performance. In contrast, ATS shows weaker profitability, with a negative net income margin and significant debts, reflected in its lower overall rating of C compared to ROK’s C-.
For growth-oriented investors, ROK appears favorable, while those seeking stability might consider ATS due to its current ratio of 1.69, though it carries higher risk due to its recent performance and financial instability.
Disclaimer: This article is not financial advice. Each investor is responsible for their own investment decisions.
Go further
I encourage you to read the complete analyses of Rockwell Automation, Inc. and ATS Corporation to enhance your investment decisions:


