In the competitive industrial machinery sector, Rockwell Automation, Inc. (ROK) and Hillenbrand, Inc. (HI) stand out for their diverse product lines and innovation strategies. Both companies serve critical market segments with advanced manufacturing solutions, from automation to material handling. This comparison highlights their market positions, growth potential, and strategic focus, guiding you to make an informed choice on which stock may best enhance your investment portfolio.

Table of contents
Companies Overview
I will begin the comparison between Rockwell Automation, Inc. and Hillenbrand, Inc. by providing an overview of these two companies and their main differences.
Rockwell Automation Overview
Rockwell Automation, Inc. specializes in industrial automation and digital transformation solutions, operating globally. It delivers hardware, software, and services through three segments: Intelligent Devices, Software & Control, and Lifecycle Services. Rockwell Automation targets diverse industries including automotive, semiconductor, food and beverage, and energy. Founded in 1903, it is headquartered in Milwaukee, Wisconsin, with a market cap of 44.4B USD.
Hillenbrand Overview
Hillenbrand, Inc. is a diversified industrial company with three segments: Advanced Process Solutions, Molding Technology Solutions, and Batesville. It serves industries such as plastics, pharmaceuticals, automotive, and funeral services. The Batesville segment focuses on burial and cremation products. Founded in 1906 and based in Batesville, Indiana, Hillenbrand has a market cap of 2.2B USD and operates internationally.
Key similarities and differences
Both companies operate in the industrial machinery sector and serve a range of industries globally. Rockwell Automation focuses on automation and digital transformation solutions with a strong software component, while Hillenbrand offers a broader industrial product range including process equipment and funeral services products. Rockwell’s business model emphasizes technology-driven segments; Hillenbrand’s is more diversified across process, molding, and memorialization markets.
Income Statement Comparison
The table below presents a side-by-side comparison of key income statement metrics for Rockwell Automation, Inc. and Hillenbrand, Inc. for the fiscal year 2025.
| Metric | Rockwell Automation, Inc. (ROK) | Hillenbrand, Inc. (HI) |
|---|---|---|
| Market Cap | 44.4B | 2.23B |
| Revenue | 8.34B | 2.67B |
| EBITDA | 1.40B | 231M |
| EBIT | 1.07B | 92.1M |
| Net Income | 869M | 43.1M |
| EPS | 7.69 | 0.74 |
| Fiscal Year | 2025 | 2025 |
Income Statement Interpretations
Rockwell Automation, Inc. (ROK) saw relatively stable revenue growth of 0.97% from 2024 to 2025, with gross margins improving favorably to 48.14%. Despite this, net income decreased by 9.64%, reflecting a decline in EBIT by 14.17%. In 2025, growth slowed and earnings per share dropped by 7.37%, indicating some pressure on profitability despite solid margins.
Hillenbrand, Inc. (HI) experienced a revenue decline of 15.99% over the same period, with gross profit also falling by 14.74%. However, EBIT surged by 614.53%, pushing net margin and EPS growth significantly higher. The latest year showed a mixed picture: lower revenues but improved earnings quality, reflected in a favorable net margin increase of 124.32%.
Which one has the stronger fundamentals?
ROK presents a balanced profile with strong gross and EBIT margins but faces challenges in sustaining net income growth, resulting in a neutral overall evaluation. HI, despite shrinking revenue, demonstrates robust earnings improvement and margin expansion, leading to a favorable income statement assessment. The choice depends on weighing stable margins against volatile net income trends.
Financial Ratios Comparison
The table below presents the key financial ratios for Rockwell Automation, Inc. (ROK) and Hillenbrand, Inc. (HI) for the fiscal year 2025, providing a side-by-side comparison to assist in financial analysis.
| Ratios | Rockwell Automation, Inc. (ROK) | Hillenbrand, Inc. (HI) |
|---|---|---|
| ROE | 23.78% | 3.66% |
| ROIC | 13.71% | -32.60% |
| P/E | 45.33 | 36.69 |
| P/B | 10.78 | 1.34 |
| Current Ratio | 1.14 | 1.22 |
| Quick Ratio | 0.77 | 0.88 |
| D/E | 1.00 | 1.12 |
| Debt-to-Assets | 32.51% | 35.86% |
| Interest Coverage | 9.12 | 0.55 |
| Asset Turnover | 0.74 | 0.60 |
| Fixed Asset Turnover | 6.95 | 7.80 |
| Payout ratio | 68.01% | 121.69% |
| Dividend yield | 1.50% | 3.32% |
Interpretation of the Ratios
Rockwell Automation, Inc. (ROK) shows mostly favorable profitability ratios, with a strong net margin of 10.42%, ROE of 23.78%, and ROIC of 13.71%. However, valuation metrics like P/E of 45.33 and P/B of 10.78 are unfavorable. Liquidity is neutral to weak, with a current ratio of 1.14 but a quick ratio below 1. The company pays dividends with a 1.5% yield, reflecting moderate shareholder returns and a balanced payout policy.
Hillenbrand, Inc. (HI) presents weaker profitability ratios, including a net margin of 1.95%, ROE of 3.66%, and a negative ROIC of -32.6%. Its valuation is mixed, with a favorable P/B of 1.34 but an unfavorable P/E near 37. Liquidity ratios are neutral, and interest coverage is poor at 0.97. HI pays dividends with a 3.32% yield, offering higher income returns despite underlying operational challenges.
Which one has the best ratios?
ROK exhibits a more favorable ratio profile overall, with stronger profitability and coverage ratios despite higher valuation multiples and some liquidity concerns. HI’s weaker profitability, negative ROIC, and low interest coverage weigh heavily against it, though it offers a higher dividend yield with more conservative valuation. Based strictly on ratios, ROK is comparatively stronger in financial health and performance.
Strategic Positioning
I will now compare Rockwell Automation and Hillenbrand’s positioning to understand their respective business strategies better.
Rockwell Automation Positioning
Rockwell Automation leads in industrial automation with a strong market presence in Intelligent Devices, Software & Control, and Lifecycle Services. Its business is driven by digital transformation solutions across diverse industries. Growth in 2025 slowed slightly in Intelligent Devices but accelerated in Software & Control, reflecting a shift toward software-driven revenues amid competitive technological disruption.
Hillenbrand Positioning
Hillenbrand operates as a diversified industrial company with key segments in Process Equipment and Milacron, alongside funeral services via Batesville. The Process Equipment segment dominates revenue but saw a decline in 2025, while Milacron contracted notably, signaling margin pressures. The company faces competitive pressures across its varied industrial and service markets.
Rockwell Automation vs Hillenbrand Positioning
Rockwell Automation offers a more concentrated portfolio focused on automation technology and software, benefiting from innovation but facing disruption risks. Hillenbrand’s diversified approach spans industrial equipment and funeral services, which reduces dependence on any one market but may dilute focus and growth momentum.
Stock Comparison
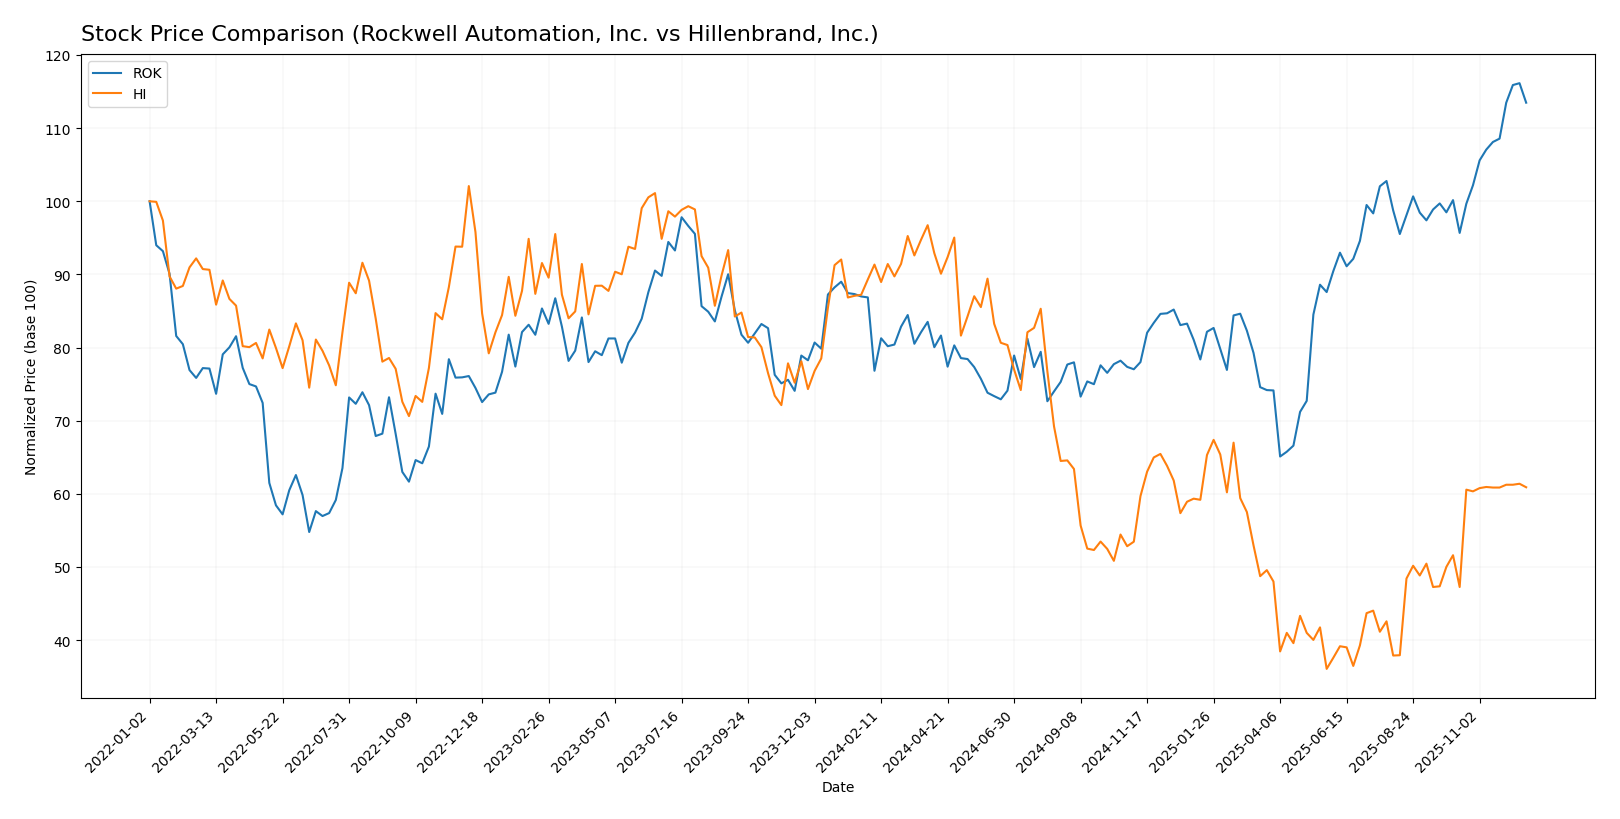
The stock price movements of Rockwell Automation, Inc. and Hillenbrand, Inc. over the past 12 months reveal contrasting trends, with Rockwell Automation exhibiting strong gains and Hillenbrand facing significant declines, alongside varying trading volume dynamics.
Trend Analysis
Rockwell Automation, Inc. showed a bullish trend over the past year with a price increase of 30.65%, marked by acceleration and a notable high of 405.18. Recent months confirm continued upward momentum with a 13.3% gain.
Hillenbrand, Inc. experienced a bearish trend with a 31.81% price decline over the same period, also accelerating downward. However, recent data indicates a partial recovery with an 18.0% increase, though volatility remains lower than Rockwell’s.
Comparing both stocks, Rockwell Automation delivered the highest market performance overall, demonstrating a strong bullish trend versus Hillenbrand’s sustained bearish direction despite recent improvements.
Analyst Opinions Comparison
I will now compare Rockwell Automation and Hillenbrand’s ratings, grades, and price targets to gauge analysts’ opinions.
Rockwell Automation Rating
Rockwell Automation holds a B rating with balanced scores, excelling in return on equity and assets at 5 each, but lagging in debt to equity and valuation metrics at 1.
Hillenbrand Rating
Hillenbrand is rated slightly higher at B+, with stronger discounted cash flow and price to book scores, despite lower return on equity and mixed valuation assessments.
Which one is the best rated?
Hillenbrand is the best rated with a B+ grade, reflecting stronger cash flow and valuation metrics, while Rockwell Automation’s B rating benefits from superior returns but weaker valuations.
Rockwell Automation, Inc. Grades
The following table summarizes recent grades assigned to Rockwell Automation, Inc. by reputable financial institutions.
| Grading Company | Action | New Grade | Date |
|---|---|---|---|
| Goldman Sachs | Upgrade | Neutral | 2025-12-16 |
| Jefferies | Maintain | Buy | 2025-12-10 |
| Citigroup | Maintain | Buy | 2025-12-08 |
| Barclays | Maintain | Overweight | 2025-12-04 |
| Baird | Maintain | Outperform | 2025-11-21 |
| B of A Securities | Maintain | Buy | 2025-11-20 |
| JP Morgan | Maintain | Neutral | 2025-11-11 |
| Morgan Stanley | Maintain | Overweight | 2025-11-10 |
| Barclays | Maintain | Overweight | 2025-11-07 |
| Wells Fargo | Maintain | Equal Weight | 2025-11-07 |
Overall, Rockwell Automation exhibits a strong consensus of buy and overweight ratings with a recent upgrade from sell to neutral by Goldman Sachs, indicating generally positive market sentiment.
Hillenbrand, Inc. Grades
Below is a summary of recent grades assigned to Hillenbrand, Inc. from recognized grading firms.
| Grading Company | Action | New Grade | Date |
|---|---|---|---|
| DA Davidson | Maintain | Neutral | 2025-11-20 |
| DA Davidson | Maintain | Neutral | 2025-10-16 |
| CJS Securities | Downgrade | Market Perform | 2025-10-16 |
| Keybanc | Downgrade | Sector Weight | 2025-05-08 |
| DA Davidson | Maintain | Neutral | 2025-05-01 |
| DA Davidson | Maintain | Neutral | 2024-11-15 |
| Keybanc | Maintain | Overweight | 2024-11-14 |
| DA Davidson | Downgrade | Neutral | 2024-08-12 |
| DA Davidson | Maintain | Buy | 2021-02-08 |
| DA Davidson | Maintain | Buy | 2021-02-07 |
Hillenbrand’s recent grades reveal a trend of downgrades from buy and overweight ratings to neutral and sector weight, suggesting a more cautious outlook in recent evaluations.
Grades Comparison of Rockwell Automation, Inc. and Hillenbrand, Inc.
Rockwell Automation has consistently received stronger grades such as buy, overweight, and outperform compared to Hillenbrand’s neutral and sector weight ratings. This divergence may influence investors’ perception of growth potential and risk, potentially favoring Rockwell Automation in terms of analyst confidence.
Target Prices
Analysts present a clear consensus on target prices for Rockwell Automation, Inc. and Hillenbrand, Inc.
| Company | Target High | Target Low | Consensus |
|---|---|---|---|
| Rockwell Automation, Inc. | 470 | 345 | 400.86 |
| Hillenbrand, Inc. | 32 | 32 | 32 |
The consensus target for Rockwell Automation at 400.86 slightly exceeds its current price of 395.87, suggesting moderate upside potential. Hillenbrand’s target of 32 aligns closely with its current price near 31.66, indicating a stable outlook from analysts.
Strengths and Weaknesses
Below is a comparison of key strengths and weaknesses between Rockwell Automation, Inc. (ROK) and Hillenbrand, Inc. (HI) based on the most recent financial and operational data.
| Criterion | Rockwell Automation, Inc. (ROK) | Hillenbrand, Inc. (HI) |
|---|---|---|
| Diversification | Strong industrial automation focus with three distinct segments covering hardware, software, and services across multiple discrete and process industries. | Diversified industrial company with segments in process solutions, molding technology, and funeral services, but less cohesive industrial focus. |
| Profitability | High gross profit margin (~48%) and solid net profit margin (~10.4%) with stable EBIT margin (~13%). | Lower gross profit margin (~33.7%) and very slim net profit margin (~1.9%) with recent negative or marginal EBIT margins. |
| Innovation | Significant investment in digital transformation and software solutions, including digital twin and simulation software. | Primarily equipment manufacturing with less emphasis on advanced digital innovation. |
| Global presence | International operations with broad market reach across various industries, supported by 27K employees. | Also international but smaller scale with ~10.5K employees and more niche market segments. |
| Market Share | Large market cap (~44.4B USD) indicating strong market positioning in industrial machinery. | Much smaller market cap (~2.2B USD), reflecting a smaller market footprint. |
| Debt level | Moderate debt with debt-to-equity ratio near 1.0 and manageable leverage (Altman Z-score ~5.4), indicating good financial health. | Higher relative debt levels with debt-to-equity >1.1, negative working capital, and lower interest coverage, posing higher financial risk. |
Key takeaways: Rockwell Automation demonstrates strong profitability, innovation, and diversified industrial exposure with solid financial stability, making it attractive for risk-conscious investors. Hillenbrand, while diversified, faces tighter margins and elevated financial risk, warranting cautious consideration.
Risk Analysis
Below is a comparative table of key risks for Rockwell Automation, Inc. (ROK) and Hillenbrand, Inc. (HI) based on the most recent 2025 data:
| Metric | Rockwell Automation, Inc. (ROK) | Hillenbrand, Inc. (HI) |
|---|---|---|
| Market Risk | High beta (1.499) indicates sensitivity to market volatility | Elevated beta (1.401) suggests notable market sensitivity |
| Regulatory Risk | Moderate, industrial automation sector faces evolving compliance | Moderate, diversified industrial sectors with varied regulations |
| Operational Risk | High complexity in automation and digital solutions | Moderate, with diverse segments including funeral services |
| Environmental Risk | Exposure to eco-industrial markets and sustainability demands | Moderate, includes wastewater treatment but less focus on renewables |
| Geopolitical Risk | Global operations expose to international trade tensions | Moderate, mostly US-focused but some international exposure |
The most impactful risks are market volatility for both firms, driven by their betas above 1.4, and operational complexity for Rockwell Automation due to its high-tech industrial automation focus. Hillenbrand’s varied business segments provide some risk diversification but also regulatory complexity. Recent financials show Rockwell’s strong Altman Z-score (5.4) indicating solid financial health, while Hillenbrand’s very high Altman Z-score (21.7) suggests low bankruptcy risk despite some working capital concerns.
Which Stock to Choose?
Rockwell Automation, Inc. (ROK) shows stable income growth with favorable profitability and return ratios, including a 23.78% ROE and 13.71% ROIC. Its debt level is moderate, and the overall rating stands at B, reflecting a balanced profile.
Hillenbrand, Inc. (HI) experiences declining revenue but improved EBIT and EPS growth. It displays weaker profitability metrics such as a 3.66% ROE and negative ROIC, combined with high net debt to EBITDA. Its rating is B+, indicating some financial strengths amid challenges.
For risk-tolerant investors seeking growth potential, ROK’s favorable profitability and stable returns might appear more attractive. Conversely, investors focused on value or turnaround opportunities could find HI’s improving income metrics and higher rating worth monitoring despite its financial risks.
Disclaimer: Investment carries a risk of loss of initial capital. The past performance is not a reliable indicator of future results. Be sure to understand risks before making an investment decision.
Go Further
I encourage you to read the complete analyses of Rockwell Automation, Inc. and Hillenbrand, Inc. to enhance your investment decisions: