In today’s rapidly evolving tech landscape, the competition between semiconductor companies is fierce. This analysis focuses on two notable players: Silicon Laboratories Inc. (SLAB) and CEVA, Inc. (CEVA). Both companies operate within the semiconductor industry, sharing market overlap in the Internet of Things (IoT) domain yet differing in their innovation strategies. I invite you to explore which of these two companies presents the most compelling investment opportunity.

Table of contents
Company Overview
Silicon Laboratories Inc. Overview
Silicon Laboratories Inc. (SLAB) is a leading fabless semiconductor company specializing in analog-intensive mixed-signal solutions. Founded in 1996 and headquartered in Austin, Texas, the company focuses on providing innovative products for the Internet of Things (IoT), including wireless microcontrollers and sensors. Their offerings are pivotal in applications such as smart home devices, industrial automation, and medical instrumentation. With a market capitalization of approximately $4.13B, SLAB is well-positioned in the semiconductor industry, leveraging its expertise to deliver high-performance solutions that cater to a diverse range of electronic products worldwide.
CEVA, Inc. Overview
CEVA, Inc. (CEVA) operates as a licensor of wireless connectivity and smart sensing technologies, offering a robust portfolio that includes digital signal processors and AI processors. Established in 1999 and located in Rockville, Maryland, CEVA supports semiconductor and original equipment manufacturers (OEMs) by licensing technologies essential for applications in mobile, IoT, and automotive sectors. With a market cap of about $493M, CEVA’s focus on providing integrated IP solutions positions it as an influential player in the semiconductor landscape, particularly in areas like image enhancement and voice recognition.
Key Similarities and Differences
Both Silicon Laboratories and CEVA operate in the semiconductor industry, focusing on innovative technologies for IoT applications. However, while SLAB emphasizes analog-focused mixed-signal solutions, CEVA specializes in licensing digital signal processing and connectivity technologies, highlighting their distinct business models within the same sector.
Income Statement Comparison
The table below compares the most recent income statements of Silicon Laboratories Inc. (SLAB) and CEVA, Inc. (CEVA) for the fiscal year 2024.
| Metric | Silicon Laboratories Inc. | CEVA, Inc. |
|---|---|---|
| Revenue | 584M | 107M |
| EBITDA | -105M | -3M |
| EBIT | -154M | -7.5M |
| Net Income | -191M | -8.8M |
| EPS | -5.93 | -0.37 |
Interpretation of Income Statement
The income statements reflect significant challenges for both companies in 2024. Silicon Laboratories saw a steep decline in revenue from the prior year, down from 782M, leading to a substantial net loss of 191M. CEVA also reported a decrease in revenue from 97M in 2023 to 107M in 2024, with a net loss of 8.8M. Both companies experienced negative EBITDA, emphasizing operational difficulties. SLAB’s margins continue to deteriorate, while CEVA’s slight revenue increase did not translate into profitability, indicating a critical need for strategic adjustments moving forward.
Financial Ratios Comparison
In this section, I provide a comparative overview of key financial ratios for Silicon Laboratories Inc. (SLAB) and CEVA, Inc. (CEVA), based on the most recent data available.
| Metric | [Company A: SLAB] | [Company B: CEVA] |
|---|---|---|
| ROE | -17.69% | -3.30% |
| ROIC | -18.15% | -8.56% |
| P/E | -21.53 | -84.79 |
| P/B | 3.81 | 2.79 |
| Current Ratio | 6.15 | 7.09 |
| Quick Ratio | 5.07 | 7.09 |
| D/E | 0.014 | 0.021 |
| Debt-to-Assets | 1.27% | 1.79% |
| Interest Coverage | -126.33 | 0 (data unavailable) |
| Asset Turnover | 0.48 | 0.34 |
| Fixed Asset Turnover | 4.42 | 8.43 |
| Payout Ratio | 0% | 0% |
| Dividend Yield | 0% | 0% |
Interpretation of Financial Ratios
Both companies show negative ROE and ROIC, indicating operational struggles. SLAB has a higher current and quick ratio, suggesting better liquidity than CEVA. However, the high debt-to-assets ratio in SLAB raises concerns about its leverage. CEVA’s asset turnover is lower, indicating less efficiency in using its assets. Overall, both companies face significant challenges that warrant careful consideration before investment.
Dividend and Shareholder Returns
Neither Silicon Laboratories Inc. (SLAB) nor CEVA, Inc. (CEVA) pays dividends, reflecting their focus on reinvestment strategies during their current growth phases. Both companies prioritize R&D and capital expenditures to enhance long-term value, though this approach may delay immediate returns for shareholders. They engage in share buybacks, which can support share prices and mitigate dilution. Overall, this strategy aligns with sustainable long-term value creation, albeit with inherent risks tied to their financial performance and market conditions.
Strategic Positioning
Silicon Laboratories Inc. (SLAB) holds a significant market share in the analog-intensive mixed-signal semiconductor space, focusing on wireless microcontrollers and IoT applications. In contrast, CEVA, Inc. (CEVA) specializes in wireless connectivity and smart sensing technologies, licensing its solutions to various semiconductor manufacturers. Both firms face competitive pressure from emerging technologies and established players, necessitating ongoing innovation to maintain their market positions amidst rapid technological disruptions in the semiconductor industry.
Stock Comparison
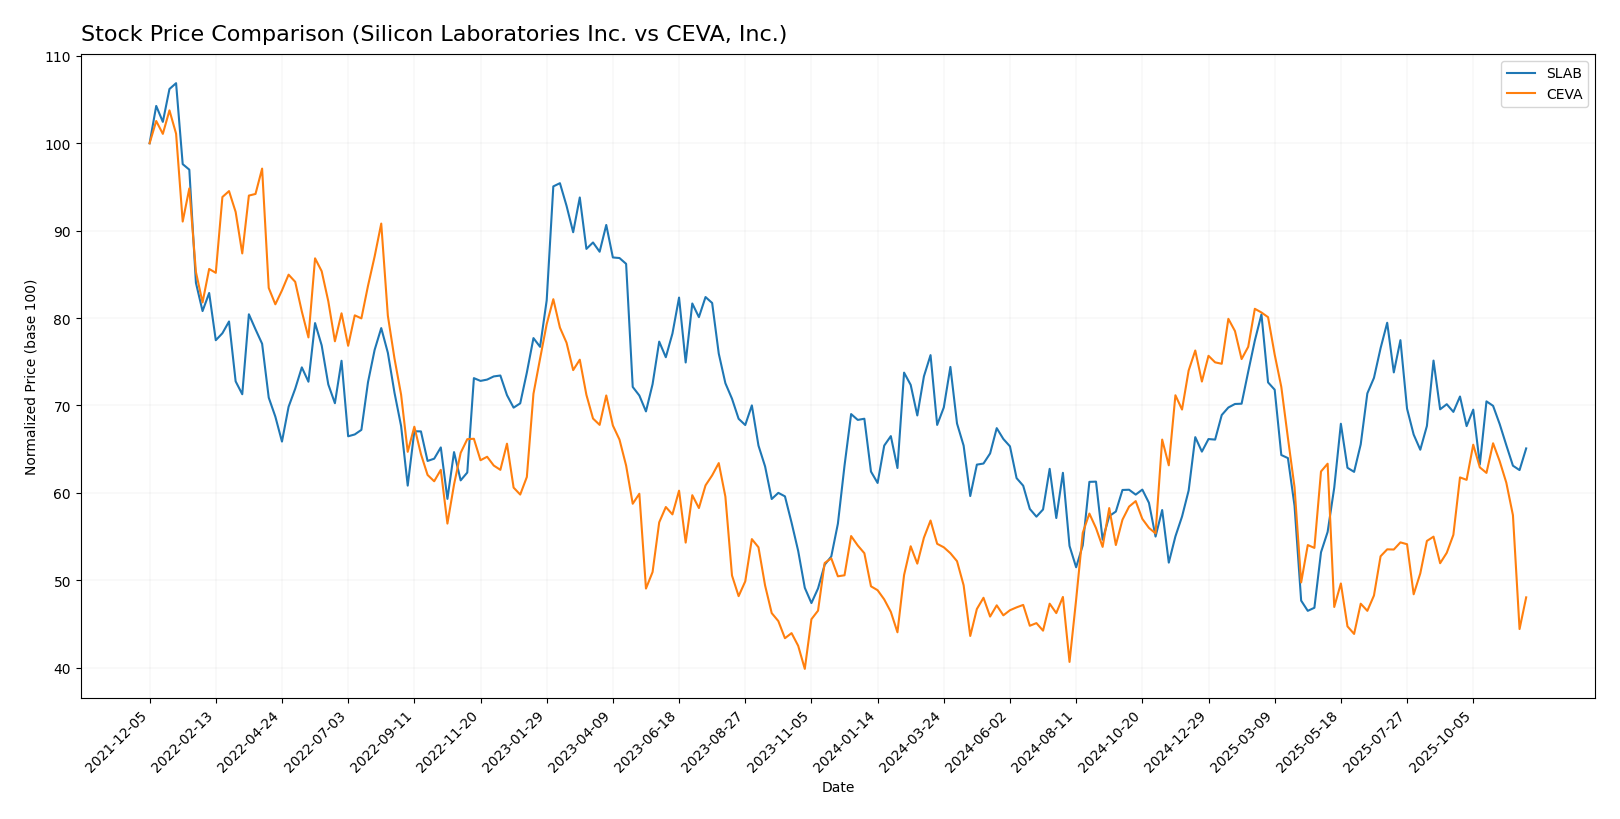
This section provides an overview of the stock price movements and trading dynamics for Silicon Laboratories Inc. (SLAB) and CEVA, Inc. over the past year, highlighting key fluctuations and overall trends.

Trend Analysis
Silicon Laboratories Inc. (SLAB) has experienced a 4.25% increase in stock price over the past year, indicating a bullish trend. The stock reached a highest price of 155.33 and a lowest price of 89.82. However, it’s noteworthy that the recent trend from September 14, 2025, to November 30, 2025, has declined by 6.03%, with a standard deviation of 5.69, suggesting some volatility in this short period. The acceleration status is classified as deceleration, indicating a slowing upward momentum.
CEVA, Inc. has shown a 2.56% decrease in stock price over the past year, reflecting a bearish trend. The stock’s highest price was 34.67, and the lowest was 17.39. In the recent analysis period, from September 14, 2025, to November 30, 2025, the decline is more pronounced at 12.96%, with a standard deviation of 2.77. The acceleration status is also in deceleration, reinforcing the weakening bearish trend.
In summary, SLAB appears to be in a bullish phase overall, despite recent declines, while CEVA is experiencing a continued bearish trend.
Analyst Opinions
Recent analyst recommendations for Silicon Laboratories Inc. (SLAB) are cautious, with a rating of C- reflecting concerns over its financial metrics. Analysts suggest a hold position due to low scores in critical areas like return on equity and debt-to-equity ratios. In contrast, CEVA, Inc. (CEVA) received a slightly better C+ rating, indicating a hold stance as well, primarily due to its improved discounted cash flow score. Overall, the consensus for both companies leans towards a hold for this year, emphasizing a cautious approach amidst current market uncertainties.
Stock Grades
In this section, I present stock ratings from reputable grading companies for two companies: Silicon Laboratories Inc. and CEVA, Inc.
Silicon Laboratories Inc. Grades
| Grading Company | Action | New Grade | Date |
|---|---|---|---|
| Susquehanna | maintain | Neutral | 2025-08-06 |
| Morgan Stanley | maintain | Equal Weight | 2025-08-06 |
| Barclays | maintain | Equal Weight | 2025-08-05 |
| Susquehanna | maintain | Neutral | 2025-07-22 |
| Stifel | maintain | Buy | 2025-07-18 |
| Keybanc | maintain | Overweight | 2025-07-08 |
| Benchmark | maintain | Buy | 2025-05-27 |
| Needham | maintain | Buy | 2025-05-14 |
| Benchmark | maintain | Buy | 2025-05-14 |
| Susquehanna | maintain | Neutral | 2025-05-14 |
CEVA, Inc. Grades
| Grading Company | Action | New Grade | Date |
|---|---|---|---|
| Barclays | maintain | Overweight | 2025-11-12 |
| Rosenblatt | maintain | Buy | 2025-11-11 |
| Rosenblatt | maintain | Buy | 2025-08-14 |
| Oppenheimer | maintain | Outperform | 2025-05-09 |
| Barclays | maintain | Overweight | 2025-05-08 |
| Rosenblatt | maintain | Buy | 2025-05-08 |
| Rosenblatt | maintain | Buy | 2025-04-23 |
| Rosenblatt | maintain | Buy | 2025-02-14 |
| Barclays | maintain | Overweight | 2025-02-14 |
| Rosenblatt | maintain | Buy | 2025-02-11 |
Overall, both companies show a consistent pattern in their grades, indicating a stable outlook with several analysts maintaining their ratings. Silicon Laboratories has a mix of neutral and positive grades, while CEVA is predominantly rated as “Buy” or “Overweight,” suggesting a more favorable sentiment among analysts.
Target Prices
Currently, reliable target price data is available for Silicon Laboratories Inc. (SLAB).
| Company | Target High | Target Low | Consensus |
|---|---|---|---|
| Silicon Laboratories Inc. | 165 | 130 | 147.5 |
Analysts expect Silicon Laboratories’ stock to reach a consensus target price of 147.5, which suggests a potential upside from the current price of approximately 125.81. This indicates a favorable outlook based on analyst sentiment. For CEVA, Inc. (CEVA), no verified target price data is available from recognized analysts.
Strengths and Weaknesses
The following table outlines the strengths and weaknesses of Silicon Laboratories Inc. (SLAB) and CEVA, Inc. (CEVA) based on recent data.
| Criterion | Silicon Laboratories Inc. (SLAB) | CEVA, Inc. (CEVA) |
|---|---|---|
| Diversification | Moderate | High |
| Profitability | Negative margins | Negative margins |
| Innovation | Strong focus on IoT technologies | Advanced AI solutions |
| Global presence | Significant in US and China | Strong in global OEMs |
| Market Share | 2% in semiconductor market | Niche segments in IoT |
| Debt level | Low (Debt/Equity: 0.014) | Very Low (Debt/Equity: 0.020) |
Key takeaways: SLAB shows strength in innovation but struggles with profitability. CEVA has a broader diversification and solid technologies, yet both companies face challenges in profitability.
Risk Analysis
In the following table, I summarize the key risks associated with Silicon Laboratories Inc. (SLAB) and CEVA, Inc. (CEVA) for your consideration as an investor.
| Metric | Silicon Laboratories Inc. | CEVA, Inc. |
|---|---|---|
| Market Risk | High | Medium |
| Regulatory Risk | Medium | Medium |
| Operational Risk | High | High |
| Environmental Risk | Low | Medium |
| Geopolitical Risk | Medium | High |
Both companies face significant market and operational risks, particularly in the semiconductor sector, which is highly volatile and influenced by global demand fluctuations. Recent supply chain disruptions and changing regulations may further impact their performance.
Which one to choose?
When comparing Silicon Laboratories Inc. (SLAB) and CEVA, Inc. (CEVA), both companies exhibit challenges but also potential for growth. SLAB shows a higher gross profit margin (53.4%) compared to CEVA (88.1%), but its operating and net profit margins are negative, indicating operational difficulties. In contrast, CEVA has a better overall rating (C+) than SLAB (C-), suggesting slightly more favorable analyst opinions.
While SLAB has a bullish stock trend, albeit with recent deceleration, CEVA’s performance is bearish with significant price declines. Investors may prefer SLAB for potential recovery and growth, while those seeking stability might opt for CEVA, despite its current struggles.
It’s essential to consider risks such as market fluctuations, competition, and supply chain issues affecting both companies.
Disclaimer: This article is not financial advice. Each investor is responsible for their own investment decisions.
Go further
I encourage you to read the complete analyses of Silicon Laboratories Inc. and CEVA, Inc. to enhance your investment decisions:


