Asana, Inc. and PagerDuty, Inc. are two prominent players in the software application industry, both headquartered in San Francisco and serving diverse sectors with innovative digital platforms. Asana focuses on work management solutions, while PagerDuty excels in digital operations management using machine learning. Their overlapping markets and distinct innovation strategies make them compelling candidates for comparison. In this article, I will help you identify which company presents the most attractive investment opportunity.

Table of contents
Companies Overview
I will begin the comparison between Asana and PagerDuty by providing an overview of these two companies and their main differences.
Asana Overview
Asana, Inc. operates a work management platform designed to help individuals, team leads, and executives orchestrate tasks and strategic initiatives. The company serves a diverse range of industries including technology, retail, education, healthcare, and financial services. Founded in 2008 and headquartered in San Francisco, Asana’s platform supports collaboration on product launches, marketing campaigns, and organization-wide goal setting.
PagerDuty Overview
PagerDuty, Inc. offers a digital operations management platform that collects data from software-enabled systems and devices, using machine learning to identify opportunities and issues. The company serves industries such as software, telecommunications, retail, travel, media, and financial services. Founded in 2009 and based in San Francisco, PagerDuty focuses on enhancing operational responsiveness across multiple sectors.
Key similarities and differences
Both Asana and PagerDuty operate in the technology sector and provide software application platforms serving a broad range of industries worldwide. While Asana focuses on work management and team collaboration, PagerDuty specializes in digital operations management and incident response using machine learning. Both companies are headquartered in San Francisco, publicly traded on the NYSE, and have similar market capitalizations in the low billions.
Income Statement Comparison
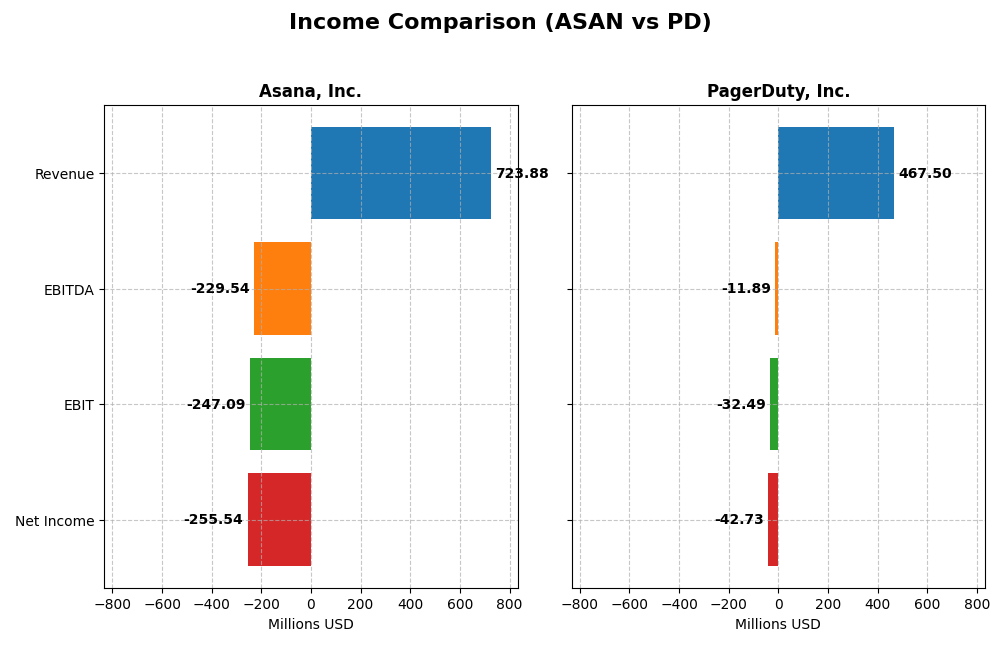
Below is a side-by-side comparison of key income statement metrics for Asana, Inc. and PagerDuty, Inc. for the fiscal year 2025.
| Metric | Asana, Inc. (ASAN) | PagerDuty, Inc. (PD) |
|---|---|---|
| Market Cap | 3.1B | 1.1B |
| Revenue | 724M | 467M |
| EBITDA | -230M | -12M |
| EBIT | -247M | -32M |
| Net Income | -256M | -54M |
| EPS | -1.11 | -0.59 |
| Fiscal Year | 2025 | 2025 |
Income Statement Interpretations
Asana, Inc.
Asana’s revenue showed strong growth from 2021 to 2025, rising from $227M to $724M, a 219% increase, while net income remained negative with some improvement in losses. Gross margins are robust at 89.3%, but EBIT and net margins remain unfavorable, reflecting ongoing operating challenges. In 2025, revenue growth slowed slightly to 10.9%, with modest improvements in net margin and EPS growth.
PagerDuty, Inc.
PagerDuty’s revenue increased steadily from $214M in 2021 to $467M in 2025, an overall growth of 119%, accompanied by improving net income though still negative. The company maintains a solid gross margin near 83%, with EBIT and net margins negative but trending favorably. The 2025 fiscal year showed 8.5% revenue growth, significant EBIT improvement, and strong net margin and EPS growth.
Which one has the stronger fundamentals?
PagerDuty exhibits stronger fundamentals with a more favorable net income growth of 38% over the period and better improvements in EBIT and net margins compared to Asana. While Asana has higher revenue growth and gross margins, its net losses persist with less pronounced margin recovery. PagerDuty’s consistent margin enhancements and significant EPS growth suggest more positive momentum in profitability measures.
Financial Ratios Comparison
The table below compares key financial ratios for Asana, Inc. and PagerDuty, Inc. based on their most recent fiscal year data from 2025.
| Ratios | Asana, Inc. (ASAN) | PagerDuty, Inc. (PD) |
|---|---|---|
| ROE | -112.3% | -32.9% |
| ROIC | -54.0% | -9.7% |
| P/E | -19.2 | -39.9 |
| P/B | 21.5 | 13.1 |
| Current Ratio | 1.44 | 1.87 |
| Quick Ratio | 1.44 | 1.87 |
| D/E | 1.18 | 3.57 |
| Debt-to-Assets | 30.1% | 50.0% |
| Interest Coverage | -72.4 | -6.46 |
| Asset Turnover | 0.81 | 0.50 |
| Fixed Asset Turnover | 2.76 | 16.6 |
| Payout ratio | 0 | 0 |
| Dividend yield | 0 | 0 |
Interpretation of the Ratios
Asana, Inc.
Asana’s financial ratios reveal significant weaknesses, with unfavorable net margin (-35.3%), ROE (-112.31%), and ROIC (-54.04%), reflecting ongoing losses and poor profitability. The company has a neutral current ratio (1.44) but unfavorable leverage and interest coverage. It pays no dividends, likely prioritizing reinvestment and growth rather than shareholder returns.
PagerDuty, Inc.
PagerDuty shows a mixed ratio profile with unfavorable net margin (-9.14%), ROE (-32.92%), and ROIC (-9.66%), though it maintains favorable liquidity ratios (current and quick at 1.87). High debt-to-equity (3.57) and interest coverage are concerns. The company does not pay dividends, focusing on reinvestment and growth initiatives instead.
Which one has the best ratios?
Between the two, Asana has a slightly unfavorable overall ratio evaluation with 21.43% favorable metrics, while PagerDuty’s ratios are more severely unfavorable with 35.71% favorable but 57.14% unfavorable. Both face profitability challenges, but PagerDuty’s higher leverage and weaker coverage weigh more heavily against it.
Strategic Positioning
This section compares the strategic positioning of Asana and PagerDuty, focusing on Market position, Key segments, and Exposure to technological disruption:
Asana
- Mid-sized market cap (~3.1B), competing in the software application industry with moderate competitive pressure.
- Focuses on work management platforms serving diverse industries like tech, retail, education, government, healthcare, and finance.
- Operates in a software environment with potential disruption from evolving digital workflows but no explicit exposure detailed.
PagerDuty
- Smaller market cap (~1.1B), operating in software application with less volatility and competitive pressure.
- Provides digital operations management using machine learning across software, telecom, retail, media, and financial sectors.
- Leverages machine learning in digital operations, implying technological innovation but no explicit disruption risks stated.
Asana vs PagerDuty Positioning
Asana’s approach is diversified across multiple industries with a broad work management platform, while PagerDuty concentrates on digital operations with machine learning. Asana benefits from varied sector exposure; PagerDuty focuses on innovation-driven operational efficiency.
Which has the best competitive advantage?
Both companies are currently shedding value relative to their cost of capital. PagerDuty shows a slightly improving profitability trend, while Asana’s profitability is declining, indicating PagerDuty has a marginally stronger competitive advantage based on MOAT evaluation.
Stock Comparison
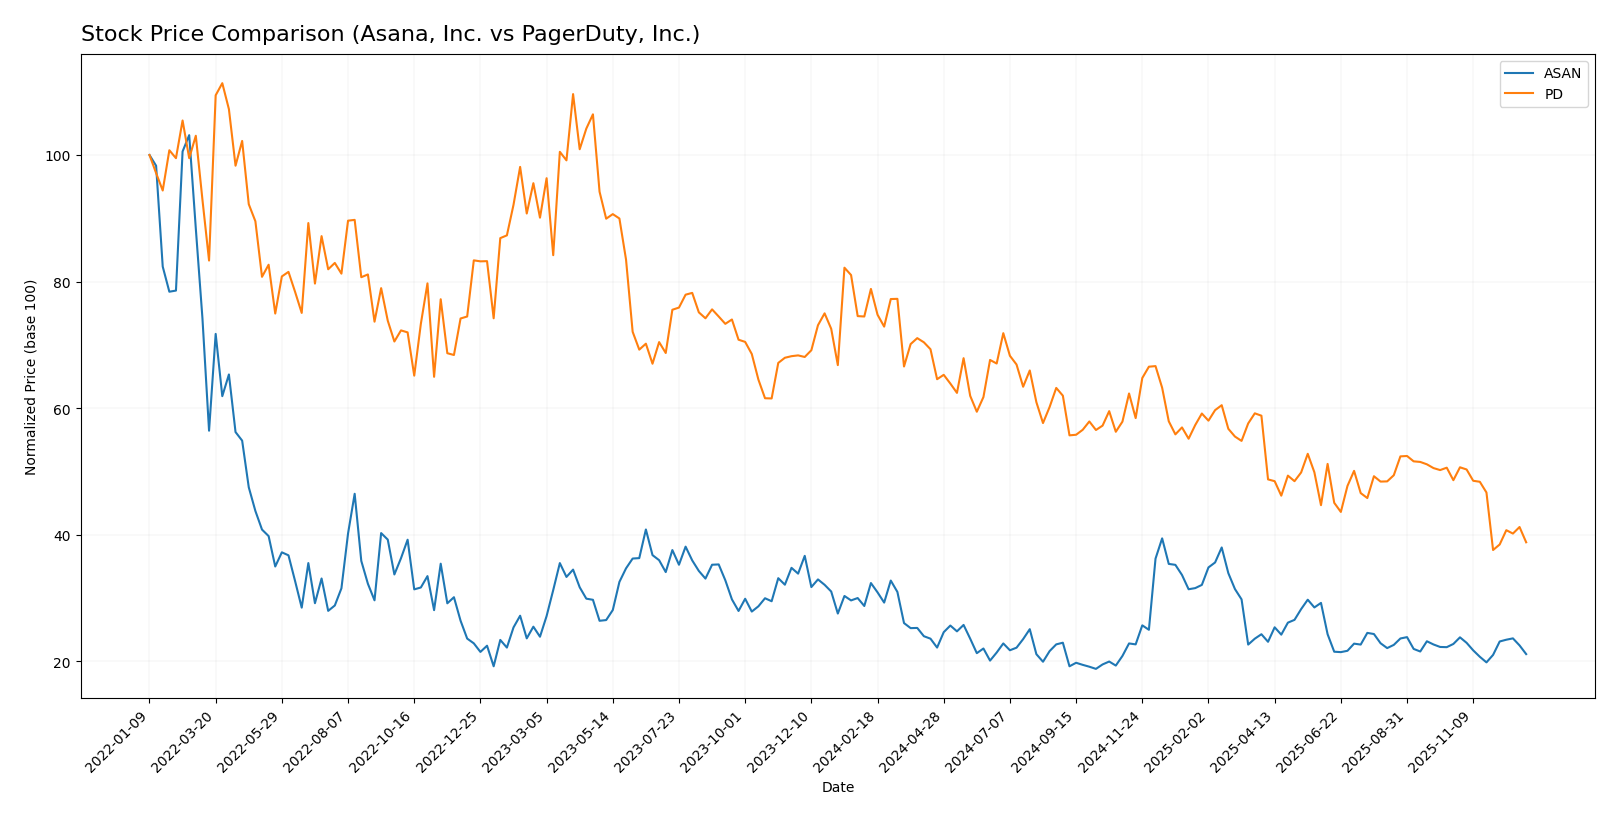
The stock prices of Asana, Inc. and PagerDuty, Inc. have both experienced significant declines over the past year, with notable deceleration in their bearish trends and shifting trading volumes indicating changing market participation.
Trend Analysis
Asana, Inc. shows a bearish trend with a -34.64% price change over the past 12 months, accompanied by deceleration and a standard deviation of 2.89. The stock’s highest price was 24.15, and its lowest was 11.53.
PagerDuty, Inc. also exhibits a bearish trend, with a more severe -50.76% price change over the past year, deceleration in trend, and a slightly higher standard deviation of 2.93. The highest and lowest prices were 25.16 and 12.0, respectively.
Comparing both stocks, Asana, Inc. delivered a higher relative market performance with a smaller percentage loss compared to PagerDuty, Inc., indicating less severe depreciation over the analyzed period.
Target Prices
Analysts present a moderately optimistic consensus on target prices for Asana, Inc. and PagerDuty, Inc.
| Company | Target High | Target Low | Consensus |
|---|---|---|---|
| Asana, Inc. | 18 | 14 | 15.75 |
| PagerDuty, Inc. | 19 | 15 | 16.75 |
The target consensus for Asana at 15.75 USD exceeds the current price of 12.96 USD, suggesting potential upside. PagerDuty’s consensus target of 16.75 USD also surpasses its current 12.39 USD price, indicating positive analyst expectations for both stocks.
Analyst Opinions Comparison
This section compares analysts’ ratings and financial grades for Asana, Inc. and PagerDuty, Inc.:
Rating Comparison
Asana, Inc. Rating
- Rating: D+ with a very favorable overall evaluation.
- Discounted Cash Flow Score: 1, indicating very unfavorable.
- ROE Score: 1, showing very unfavorable profitability.
- ROA Score: 1, indicating very unfavorable asset efficiency.
- Debt To Equity Score: 1, reflecting very unfavorable risk.
- Overall Score: 1, assessed as very unfavorable.
PagerDuty, Inc. Rating
- Rating: A- with a very favorable overall evaluation.
- Discounted Cash Flow Score: 4, indicating favorable.
- ROE Score: 5, showing very favorable profitability.
- ROA Score: 5, indicating very favorable asset efficiency.
- Debt To Equity Score: 1, reflecting very unfavorable risk.
- Overall Score: 4, assessed as favorable.
Which one is the best rated?
Based strictly on the provided data, PagerDuty, Inc. is better rated with superior scores in discounted cash flow, ROE, ROA, and overall metrics. Asana, Inc. shows consistently very unfavorable scores except for its rating status.
Scores Comparison
Here is a comparison of the Altman Z-Score and Piotroski Score for Asana, Inc. and PagerDuty, Inc.:
Asana Scores
- Altman Z-Score: -0.20, indicating distress zone, high bankruptcy risk.
- Piotroski Score: 4, reflecting average financial strength.
PagerDuty Scores
- Altman Z-Score: 1.37, also in distress zone, moderate bankruptcy risk.
- Piotroski Score: 7, showing strong financial health.
Which company has the best scores?
PagerDuty has higher scores overall, with a stronger Piotroski score and a less negative Altman Z-Score, indicating relatively better financial health than Asana based on these metrics.
Grades Comparison
The following is a comparison of recent grades from verified grading companies for Asana, Inc. and PagerDuty, Inc.:
Asana, Inc. Grades
Here are the latest grades and rating actions from recognized grading companies for Asana, Inc.:
| Grading Company | Action | New Grade | Date |
|---|---|---|---|
| Keybanc | Upgrade | Overweight | 2025-12-15 |
| DA Davidson | Maintain | Neutral | 2025-12-04 |
| RBC Capital | Maintain | Underperform | 2025-12-03 |
| UBS | Maintain | Neutral | 2025-12-03 |
| Citigroup | Maintain | Neutral | 2025-12-03 |
| Piper Sandler | Maintain | Overweight | 2025-09-04 |
| Baird | Maintain | Neutral | 2025-09-04 |
| Morgan Stanley | Maintain | Underweight | 2025-09-04 |
| B of A Securities | Maintain | Buy | 2025-06-04 |
| JP Morgan | Maintain | Underweight | 2025-06-04 |
Overall, Asana shows a mix of neutral to overweight ratings, with a recent upgrade by Keybanc and a generally cautious stance from some major firms.
PagerDuty, Inc. Grades
Below is a summary of the recent grades and rating actions from credible grading firms for PagerDuty, Inc.:
| Grading Company | Action | New Grade | Date |
|---|---|---|---|
| RBC Capital | Maintain | Outperform | 2025-11-26 |
| Craig-Hallum | Downgrade | Hold | 2025-11-26 |
| Morgan Stanley | Maintain | Equal Weight | 2025-11-26 |
| TD Cowen | Maintain | Buy | 2025-11-26 |
| Truist Securities | Maintain | Buy | 2025-11-19 |
| Baird | Maintain | Neutral | 2025-09-04 |
| Canaccord Genuity | Maintain | Buy | 2025-09-04 |
| RBC Capital | Maintain | Outperform | 2025-09-04 |
| Canaccord Genuity | Maintain | Buy | 2025-06-02 |
| Truist Securities | Maintain | Buy | 2025-05-30 |
PagerDuty’s ratings trend toward positive with several buy and outperform grades, although a recent downgrade to hold by Craig-Hallum indicates some caution.
Which company has the best grades?
PagerDuty, Inc. has generally received stronger grades with multiple buy and outperform ratings compared to Asana, Inc.’s more mixed neutral to overweight assessments. This may suggest greater analyst confidence in PagerDuty’s prospects, which investors might consider in portfolio evaluation.
Strengths and Weaknesses
Below is a comparative overview of Asana, Inc. (ASAN) and PagerDuty, Inc. (PD) based on key financial and strategic criteria as of 2026.
| Criterion | Asana, Inc. (ASAN) | PagerDuty, Inc. (PD) |
|---|---|---|
| Diversification | Limited product lines, focused on work management software | Focused on digital operations management, with some diversification in service offerings |
| Profitability | Negative net margin (-35.3%), ROIC -54%, value destroying | Negative net margin (-9.1%), ROIC -9.7%, value destroying but improving |
| Innovation | Moderate innovation, struggling to convert into profits | Demonstrates innovation with growing ROIC trend |
| Global presence | Moderate, primarily North America and select international markets | Moderate global presence with growing market penetration |
| Market Share | Significant in collaboration software but challenged by competitors | Niche leader in incident management with expanding footprint |
Key takeaways: Both companies are currently unprofitable and shedding value, with Asana facing more severe profitability challenges. PagerDuty shows signs of improving ROIC and innovation momentum, while Asana struggles with declining returns and high valuation multiples, indicating higher investment risk.
Risk Analysis
Below is a comparative table of key risks for Asana, Inc. and PagerDuty, Inc. based on their latest 2025 financial and operational data:
| Metric | Asana, Inc. (ASAN) | PagerDuty, Inc. (PD) |
|---|---|---|
| Market Risk | Moderate (Beta 0.93) | Lower (Beta 0.69) |
| Debt Level | Moderate (D/E 1.18, Debt/Assets 30%) | High (D/E 3.57, Debt/Assets 50%) |
| Regulatory Risk | Moderate (Tech sector, US focus) | Moderate (Tech sector, US & Japan) |
| Operational Risk | Moderate (Negative margins, ROE -112%) | Moderate (Negative margins, ROE -33%) |
| Environmental Risk | Low (Software sector, limited impact) | Low (Software sector, limited impact) |
| Geopolitical Risk | Moderate (US based, global clients) | Moderate (US & Japan exposure) |
The most impactful risks are financial: PagerDuty’s high debt level significantly raises solvency concerns, despite a stronger operational score than Asana. Asana faces deep profitability issues and a distress-level Altman Z-score, indicating higher bankruptcy risk. Both companies operate in a competitive and fast-evolving tech environment, requiring close investor attention to their debt management and profitability improvements.
Which Stock to Choose?
Asana, Inc. (ASAN) shows a favorable income statement with 10.94% revenue growth in 2025 and strong gross margins at 89.3%. However, its financial ratios are slightly unfavorable overall with a -35.3% net margin and -112% ROE. ASAN carries moderate debt levels, a quick ratio of 1.44, and a very unfavorable rating of D+. Its MOAT evaluation signals value destruction and declining profitability.
PagerDuty, Inc. (PD) posts a solid income growth profile with 8.54% revenue growth and positive net income growth over the period. Financial ratios remain mostly unfavorable, including a -9.1% net margin and -33% ROE, alongside higher debt-to-equity and interest coverage concerns. PD’s rating is A-, reflecting a more favorable financial standing and a slightly unfavorable MOAT with improving ROIC.
For investors prioritizing growth and income statement strength, PagerDuty may appear more favorable given its higher rating and improving profitability metrics. Conversely, those focusing on value or cautious of debt might view Asana’s profile as less attractive due to its weaker rating and declining ROIC. The choice could depend on an investor’s risk tolerance and strategy.
Disclaimer: Investment carries a risk of loss of initial capital. The past performance is not a reliable indicator of future results. Be sure to understand risks before making an investment decision.
Go Further
I encourage you to read the complete analyses of Asana, Inc. and PagerDuty, Inc. to enhance your investment decisions: