In the fast-paced world of technology, EPAM Systems, Inc. and UiPath Inc. stand out as key players in their respective fields. While EPAM focuses on digital platform engineering and software development services, UiPath specializes in robotic process automation (RPA) solutions. Both companies operate within the broader technology sector, but they address different aspects of digital transformation. This analysis will help you discern which of these innovative firms presents the most compelling investment opportunity for your portfolio.

Table of contents
Company Overview
EPAM Overview
EPAM Systems, Inc. is a leading player in the Information Technology Services sector, specializing in digital platform engineering and software development. Founded in 1993 and headquartered in Newtown, Pennsylvania, EPAM boasts a market capitalization of approximately $10.24B. The company provides a comprehensive range of services, including software development, infrastructure management, and consulting across various industries such as financial services, healthcare, and media. With a robust team of around 61,200 employees, EPAM is committed to delivering innovative solutions that enhance operational efficiency and drive business transformation for its clients.
UiPath Overview
UiPath Inc., established in 2005 and headquartered in New York City, operates within the Software – Infrastructure industry, focusing on robotic process automation (RPA) solutions. With a market capitalization of about $7.24B, UiPath offers an end-to-end automation platform that integrates artificial intelligence with user-friendly tools for automation management. The company serves key sectors, including banking and healthcare, and employs approximately 3,868 individuals. UiPath’s mission is to empower organizations to improve productivity and streamline operations through intelligent automation.
Key Similarities and Differences
Both EPAM and UiPath operate in the technology sector and provide solutions aimed at enhancing operational efficiency. However, their business models differ significantly; EPAM focuses on a broad array of IT services, including software development and consulting, while UiPath specializes in robotic process automation, offering a platform tailored for automation within organizations. This distinction positions them uniquely in the market, catering to different client needs.
Income Statement Comparison
The following table presents a comparative analysis of the income statements of EPAM Systems, Inc. and UiPath Inc. for their most recent fiscal years, highlighting key financial metrics essential for evaluating their performance.
| Metric | EPAM Systems, Inc. | UiPath Inc. |
|---|---|---|
| Revenue | 4.73B | 1.43B |
| EBITDA | 671.69M | -145.34M |
| EBIT | 544.58M | -162.57M |
| Net Income | 454.53M | -73.69M |
| EPS | 7.93 | -0.13 |
Interpretation of Income Statement
In the most recent fiscal year, EPAM demonstrated a stable revenue growth, increasing from 4.69B to 4.73B, while maintaining a healthy net income of 454.53M, reflecting a positive upward trend in profitability. In contrast, UiPath’s revenue grew from 1.31B to 1.43B but still reported a net loss of 73.69M, indicating ongoing challenges in achieving operational efficiency. The significant dip in UiPath’s margins underscores the need for improved cost management, whereas EPAM’s margins have shown resilience, suggesting effective expense control despite market fluctuations. Overall, EPAM presents a more favorable investment opportunity compared to UiPath at this juncture.
Financial Ratios Comparison
The following table provides a comparison of key financial ratios for EPAM Systems, Inc. and UiPath Inc., showcasing their current financial health and performance metrics.
| Metric | EPAM Systems, Inc. | UiPath Inc. |
|---|---|---|
| ROE | 12.52% | -3.99% |
| ROIC | 10.67% | -7.41% |
| P/E | 29.47 | -108.04 |
| P/B | 3.69 | 4.31 |
| Current Ratio | 2.96 | 2.93 |
| Quick Ratio | 2.96 | 2.93 |
| D/E | 0.045 | 0.042 |
| Debt-to-Assets | 3.44% | 2.72% |
| Interest Coverage | N/A | N/A |
| Asset Turnover | 0.99 | 0.50 |
| Fixed Asset Turnover | 14.07 | 14.41 |
| Payout ratio | 0% | 0% |
| Dividend yield | 0% | 0% |
Interpretation of Financial Ratios
In comparing the financial health of EPAM and UiPath, EPAM shows stronger profitability with a positive ROE and ROIC, while UiPath’s negative ratios indicate operational challenges. Although both companies maintain healthy liquidity ratios (current and quick), the stark contrast in their P/E ratios highlights differing investor perceptions. The low debt levels for both firms suggest manageable financial risk, but the lack of dividends from either company may deter income-focused investors.
Dividend and Shareholder Returns
EPAM Systems, Inc. does not pay dividends, as indicated by a 0% payout ratio. The company prioritizes reinvestment, aligning with its growth strategy in the tech sector. Notably, EPAM engages in share buybacks, which may enhance shareholder value over time. Conversely, UiPath Inc. also refrains from dividend payments due to ongoing losses and a focus on R&D. While both companies do pursue share repurchases, their lack of dividends reflects their commitment to long-term value creation rather than immediate returns.
Strategic Positioning
EPAM Systems, Inc. holds a strong position in the Information Technology Services sector, with a market cap of $10.24B. The company specializes in digital platform engineering and software development, focusing on diverse industries such as financial services and healthcare. In contrast, UiPath Inc., valued at $7.24B, is a leader in the robotic process automation market, leveraging AI to enhance automation processes. Both companies face competitive pressure from emerging technologies and established players, necessitating continuous innovation to maintain their market share.
Stock Comparison
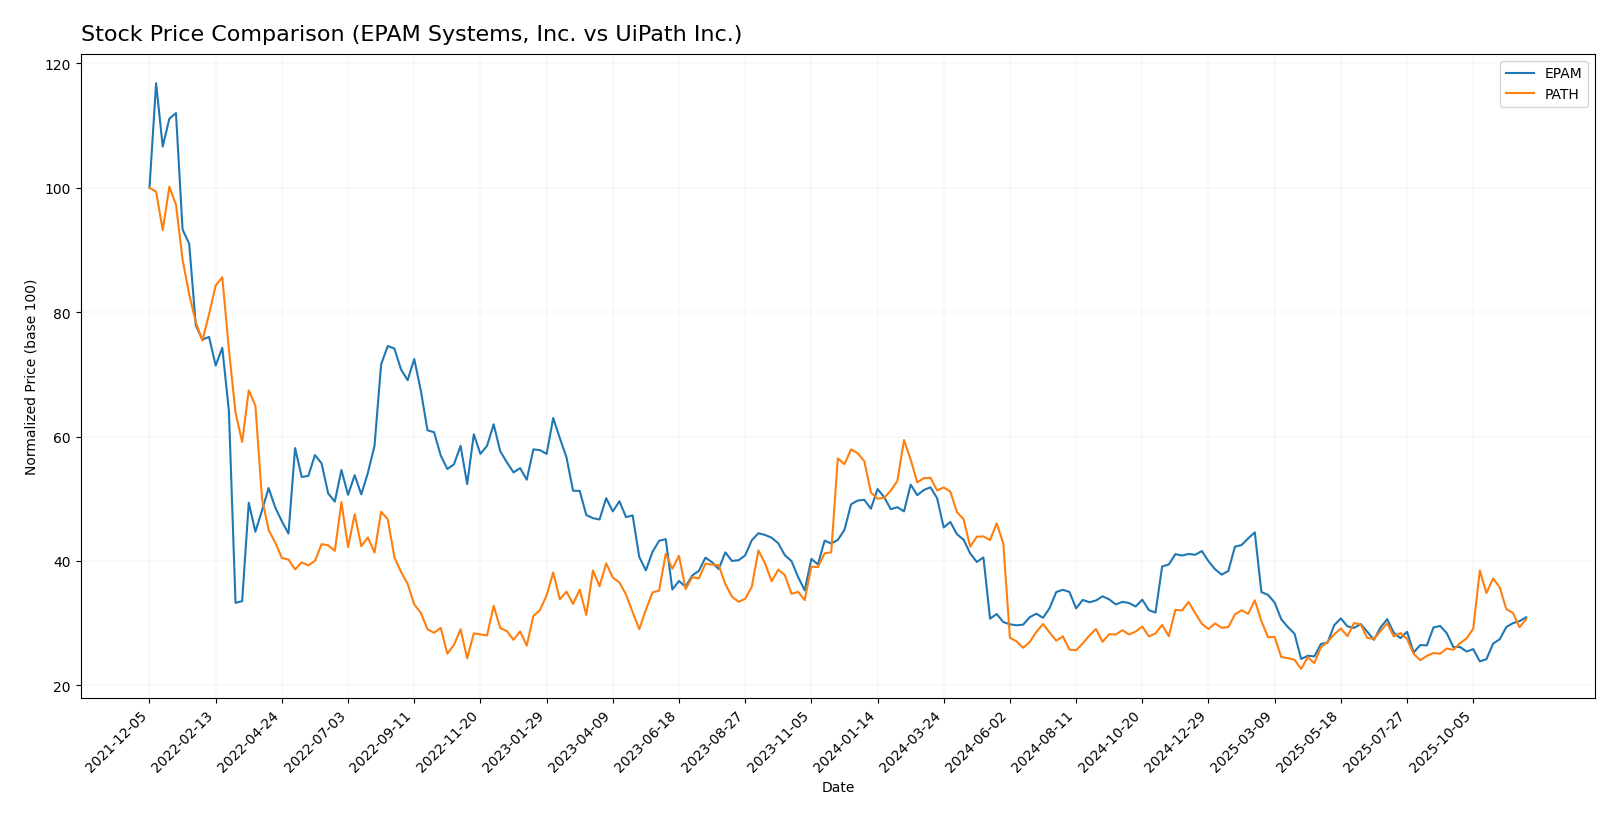
In this section, I will analyze the weekly stock price movements of EPAM Systems, Inc. (EPAM) and UiPath Inc. (PATH) over the past year, highlighting key price dynamics and trading behaviors.

Trend Analysis
EPAM Systems, Inc. (EPAM) Over the past year, EPAM has experienced a significant price change of -36.05%, indicating a bearish trend. The stock has seen notable highs at $311.98 and lows at $142.38, with an acceleration in its downtrend, suggesting increasing volatility with a standard deviation of 46.0. Recently, from September 14, 2025, to November 30, 2025, the stock showed a short-term increase of 18.34%, reflecting a trend slope of 3.19 and a standard deviation of 13.77.
UiPath Inc. (PATH) Similarly, UiPath has recorded a -39.94% price change over the past year, also indicating a bearish trend. The stock reached a high of $26.35 and a low of $10.04, with an acceleration in the downward movement, evidenced by a standard deviation of 4.08. In the recent analysis period, from September 14, 2025, to November 30, 2025, PATH exhibited a positive shift of 19.12%, with a trend slope of 0.18 and a lower standard deviation of 1.78.
In summary, both stocks have experienced substantial declines over the past year with recent short-term gains, suggesting cautious optimism but underlined by overall bearish conditions.
Analyst Opinions
Recent analyst recommendations suggest a mixed outlook for EPAM Systems, Inc. and UiPath Inc. Analysts rate EPAM with a B+, indicating a strong buy sentiment, supported by solid discounted cash flow and asset return scores. Conversely, UiPath holds a B- rating, reflecting a cautious hold stance due to lower evaluations in price-to-earnings metrics. The consensus for EPAM leans toward buy, while UiPath remains a hold for 2025. Notable analysts backing these recommendations include well-regarded firms in the tech sector.
Stock Grades
I have gathered the latest stock grades for two companies, EPAM Systems, Inc. (EPAM) and UiPath Inc. (PATH). Below are the details:
EPAM Systems, Inc. Grades
| Grading Company | Action | New Grade | Date |
|---|---|---|---|
| Mizuho | maintain | Outperform | 2025-11-11 |
| JP Morgan | maintain | Overweight | 2025-11-07 |
| Morgan Stanley | maintain | Equal Weight | 2025-09-09 |
| JP Morgan | maintain | Overweight | 2025-08-20 |
| Barclays | maintain | Overweight | 2025-05-12 |
| Needham | maintain | Buy | 2025-05-09 |
| Guggenheim | maintain | Buy | 2025-05-09 |
| Piper Sandler | maintain | Neutral | 2025-05-09 |
| Morgan Stanley | maintain | Equal Weight | 2025-05-09 |
| Stifel | maintain | Buy | 2025-05-02 |
UiPath Inc. Grades
| Grading Company | Action | New Grade | Date |
|---|---|---|---|
| UBS | upgrade | Neutral | 2025-10-23 |
| BMO Capital | maintain | Market Perform | 2025-10-02 |
| Canaccord Genuity | maintain | Buy | 2025-09-08 |
| Truist Securities | maintain | Hold | 2025-09-05 |
| BMO Capital | maintain | Market Perform | 2025-09-05 |
| Needham | maintain | Hold | 2025-09-05 |
| Morgan Stanley | maintain | Equal Weight | 2025-06-02 |
| Canaccord Genuity | maintain | Buy | 2025-06-02 |
| Evercore ISI Group | maintain | In Line | 2025-05-30 |
| Scotiabank | maintain | Sector Perform | 2025-05-30 |
Overall, both companies have maintained strong to neutral grades, with EPAM consistently rated as “Outperform” or “Overweight” by several analysts. UiPath has shown a slight improvement with an upgrade to “Neutral” from “Sell,” indicating a potential positive shift in market sentiment.
Target Prices
The target consensus indicates a positive outlook from analysts for both companies.
| Company | Target High | Target Low | Consensus |
|---|---|---|---|
| EPAM Systems, Inc. | 185 | 175 | 180 |
| UiPath Inc. | 17 | 13 | 15.33 |
For EPAM, the consensus price of 180 is slightly below the current price of 185.37, suggesting potential for slight price correction. Meanwhile, UiPath’s target consensus of 15.33 is above its current price of 13.635, indicating a positive growth expectation.
Strengths and Weaknesses
The following table outlines the strengths and weaknesses of two companies, EPAM Systems, Inc. (EPAM) and UiPath Inc. (PATH), based on recent financial data.
| Criterion | EPAM Systems, Inc. | UiPath Inc. |
|---|---|---|
| Diversification | High | Moderate |
| Profitability | Moderate (Net Margin: 9.61%) | Negative (Net Margin: -5.15%) |
| Innovation | Strong | Strong |
| Global presence | Extensive | Limited |
| Market Share | 1.03% | 0.15% |
| Debt level | Low (Debt/Equity: 4.5%) | Low (Debt/Equity: 4.2%) |
Key takeaways include EPAM’s strong global presence and profitability compared to UiPath, which is still working to establish a more solid financial standing. While both companies show innovation, EPAM’s diversification offers a competitive advantage in market stability.
Risk Analysis
In the following table, I present a summary of key risks associated with two companies: EPAM Systems, Inc. and UiPath Inc.
| Metric | EPAM Systems, Inc. | UiPath Inc. |
|---|---|---|
| Market Risk | Moderate | High |
| Regulatory Risk | Low | Moderate |
| Operational Risk | Moderate | High |
| Environmental Risk | Low | Low |
| Geopolitical Risk | High | Moderate |
Both companies face unique risks, with market volatility being a prominent concern for UiPath due to its high beta of 1.09. EPAM is more exposed to geopolitical risks, particularly given its operations in regions affected by political tensions.
Which one to choose?
When comparing EPAM Systems, Inc. (EPAM) and UiPath Inc. (PATH), the fundamentals suggest a clear distinction. EPAM boasts a solid market capitalization of approximately $13.4B, with a net profit margin of 9.6% and a robust return on equity of 12.5%. Its rating stands at B+, indicating strong performance metrics. In contrast, PATH has a market cap of around $7.9B, but its negative profit margins and overall rating of B- signal significant operational challenges.
While EPAM’s stock trend appears bearish with a 36.05% decrease over the past year, it has recently shown signs of recovery with an 18.34% uptick. PATH also faces a bearish trend with a 39.94% decline, albeit with a recent 19.12% increase.
For growth-focused investors, EPAM seems more favorable, while risk-averse investors may prefer to avoid PATH due to its volatile performance and lack of profitability. The primary risks to consider include competition and overall market dependence for both companies.
Disclaimer: This article is not financial advice. Each investor is responsible for their own investment decisions.
Go further
I encourage you to read the complete analyses of EPAM Systems, Inc. and UiPath Inc. to enhance your investment decisions:


