Home > Comparison > Industrials > ROP vs MNDY
The strategic rivalry between Roper Technologies, Inc. and monday.com Ltd. shapes the evolving landscape of industrial and technology sectors. Roper, a diversified industrial machinery and software provider, contrasts sharply with monday.com’s agile, cloud-based application software model. This head-to-head exemplifies a classic value versus growth dynamic. This analysis will clarify which firm’s trajectory delivers superior risk-adjusted returns for a diversified portfolio in 2026 and beyond.
Table of contents
Companies Overview
Roper Technologies and monday.com stand out as pivotal players in industrial machinery and software applications.
Roper Technologies, Inc.: Diversified Industrial Software & Solutions Leader
Roper Technologies dominates the industrial machinery sector by designing and developing software and engineered products. Its core revenue stems from cloud-based software for financial, healthcare, and insurance sectors, alongside precision instruments and control systems. In 2026, Roper focuses on expanding its cloud analytics and automation offerings to deepen its industrial and healthcare market penetration.
monday.com Ltd.: Innovative Cloud-Based Work OS Provider
monday.com leads in the software application industry with a cloud-based visual work operating system. It generates revenue by offering modular work management tools tailored for marketing, CRM, and project management. The company’s 2026 strategy emphasizes scaling its international presence and enhancing product versatility to attract diverse enterprise clients globally.
Strategic Collision: Similarities & Divergences
Roper’s business philosophy centers on integrated industrial solutions, blending hardware and software, while monday.com pursues a pure cloud-native, modular platform. Their competition unfolds in the enterprise software space, where Roper emphasizes specialized industry applications and monday.com targets broad work management adoption. These distinct approaches create divergent investment profiles: Roper offers industrial resilience, monday.com bets on scalable SaaS growth.
Income Statement Comparison
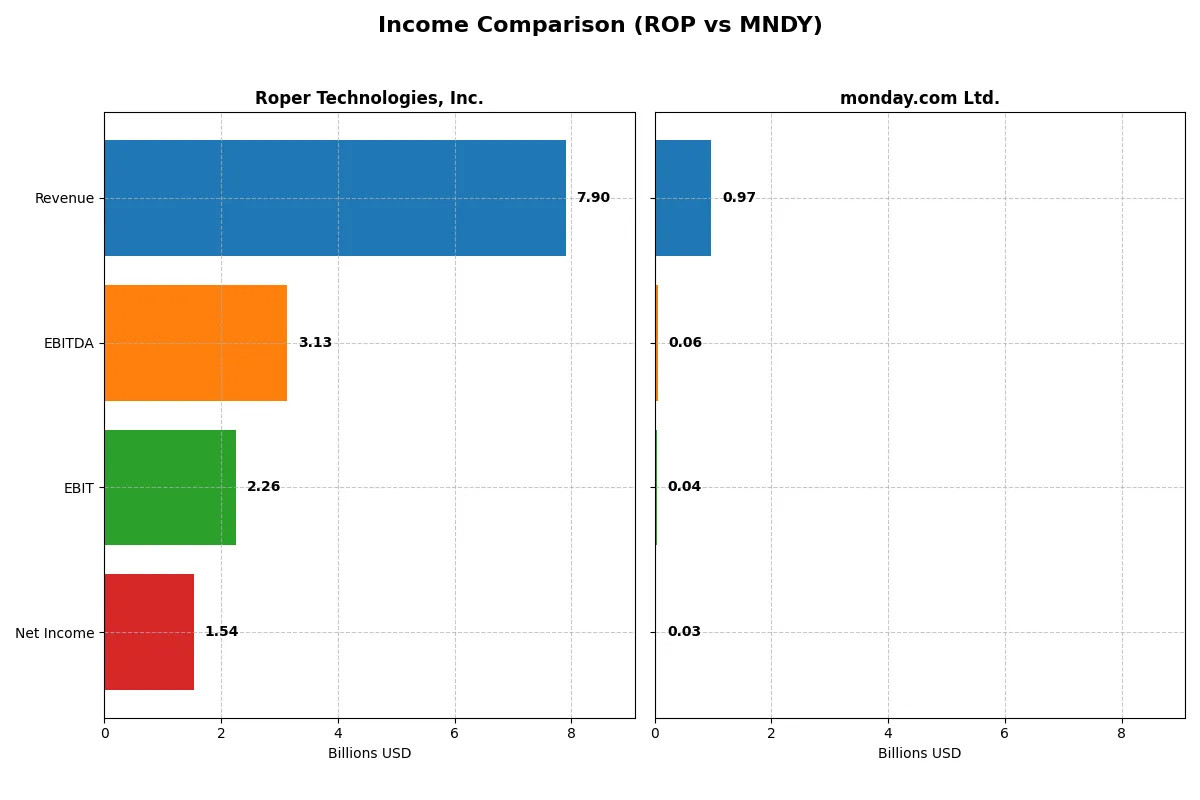
The following data dissects the core profitability and scalability of both corporate engines to reveal who dominates the bottom line:
| Metric | Roper Technologies, Inc. (ROP) | monday.com Ltd. (MNDY) |
|---|---|---|
| Revenue | 7.9B | 972M |
| Cost of Revenue | 2.43B | 104M |
| Operating Expenses | 3.24B | 889M |
| Gross Profit | 5.47B | 868M |
| EBITDA | 3.13B | 58M |
| EBIT | 2.26B | 40M |
| Interest Expense | 325M | 0 |
| Net Income | 1.54B | 32M |
| EPS | 14.31 | 0.65 |
| Fiscal Year | 2025 | 2024 |
Income Statement Analysis: The Bottom-Line Duel
This income statement comparison reveals which company converts revenue into profit most efficiently and sustains growth momentum.
Roper Technologies, Inc. Analysis
Roper Technologies grew revenue steadily from 4.8B in 2021 to 7.9B in 2025, with net income rising from 1.1B to 1.5B. Its gross margin remains robust at 69.24%, while net margin holds a healthy 19.44%. Despite slight net margin decline recently, Roper shows consistent profitability and operational efficiency.
monday.com Ltd. Analysis
monday.com expanded revenue dramatically from 161M in 2020 to 972M in 2024, with net income swinging from heavy losses to 32M profit. Its gross margin impresses at 89.33%, though net margin is modest at 3.33%. The company’s rapid growth and improving profitability signal strong operational leverage but still low absolute profit.
Growth Scale vs. Established Profitability
Roper delivers steady, high-margin profits with solid growth, while monday.com posts explosive revenue gains from a smaller base and emerging profitability. Roper’s consistent net income and margins make it fundamentally stronger. Investors favoring stable earnings will find Roper’s profile more attractive than monday.com’s high-growth yet early-stage profitability.
Financial Ratios Comparison
These vital ratios act as a diagnostic tool to expose the underlying fiscal health, valuation premiums, and capital efficiency of the companies compared below:
| Ratios | Roper Technologies, Inc. (ROP) | monday.com Ltd. (MNDY) |
|---|---|---|
| ROE | 8.2% (2024) | 3.1% (2024) |
| ROIC | 5.5% (2024) | -1.7% (2024) |
| P/E | 36.0 (2024) | 363.0 (2024) |
| P/B | 2.95 (2024) | 11.41 (2024) |
| Current Ratio | 0.40 (2024) | 2.66 (2024) |
| Quick Ratio | 0.37 (2024) | 2.66 (2024) |
| D/E | 0.41 (2024) | 0.10 (2024) |
| Debt-to-Assets | 24.5% (2024) | 6.3% (2024) |
| Interest Coverage | 7.7 (2024) | 0 (2024) |
| Asset Turnover | 0.22 (2024) | 0.58 (2024) |
| Fixed Asset Turnover | 47.0 (2024) | 7.13 (2024) |
| Payout Ratio | 21% (2024) | 0% (2024) |
| Dividend Yield | 0.58% (2024) | 0% (2024) |
| Fiscal Year | 2024 | 2024 |
Efficiency & Valuation Duel: The Vital Signs
Ratios act as a company’s DNA, revealing hidden risks and operational excellence that raw numbers alone cannot expose.
Roper Technologies, Inc.
Roper shows strong net margin (19.44%) but struggles with zero reported ROE and ROIC, signaling challenges in capital efficiency. Its P/E of 31.06 suggests a stretched valuation. Dividend yield at 0.74% is modest, indicating some shareholder return, while reinvestment likely supports R&D and growth.
monday.com Ltd.
monday.com posts low net margin (3.33%) and weak ROE (3.14%), reflecting profitability pressures. Its P/E of 363 and P/B of 11.41 mark the stock as expensive. The company pays no dividends, focusing heavily on R&D and operational expansion, consistent with growth-stage tech firms.
Premium Valuation vs. Operational Safety
Roper offers better operational profitability but at a stretched price; monday.com trades at a higher premium with weaker returns. Roper suits investors prioritizing steady cash flow, while monday.com fits those seeking high-growth potential despite elevated risk.
Which one offers the Superior Shareholder Reward?
Roper Technologies (ROP) offers a modest dividend yield near 0.7% with a sustainable payout ratio around 23%. It complements dividends with robust buybacks, fueling total returns. In contrast, monday.com Ltd. (MNDY) pays no dividends, instead reinvesting heavily in growth and innovation. MNDY’s high price multiples and zero payout reflect its early-stage expansion focus but limit near-term cash returns. I see ROP’s balanced distribution—dividends plus consistent buybacks—as the superior model for reliable shareholder reward in 2026.
Comparative Score Analysis: The Strategic Profile
The radar chart reveals the fundamental DNA and trade-offs of Roper Technologies and monday.com Ltd., highlighting their financial strengths and valuation differences:
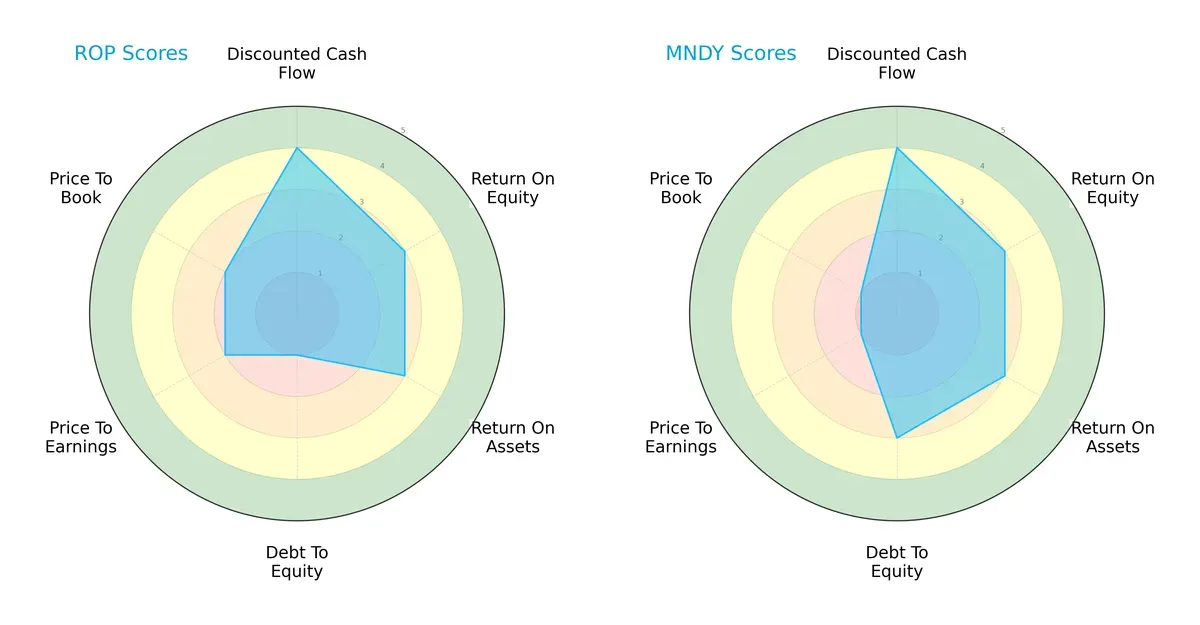
Roper Technologies shows a more balanced profile with solid DCF, ROE, and ROA scores but struggles with a very unfavorable debt-to-equity score. Monday.com matches Roper on cash flow and returns but manages debt better, though it faces valuation headwinds with very unfavorable P/E and P/B scores. Roper relies on operational efficiency; monday.com leans on financial stability.
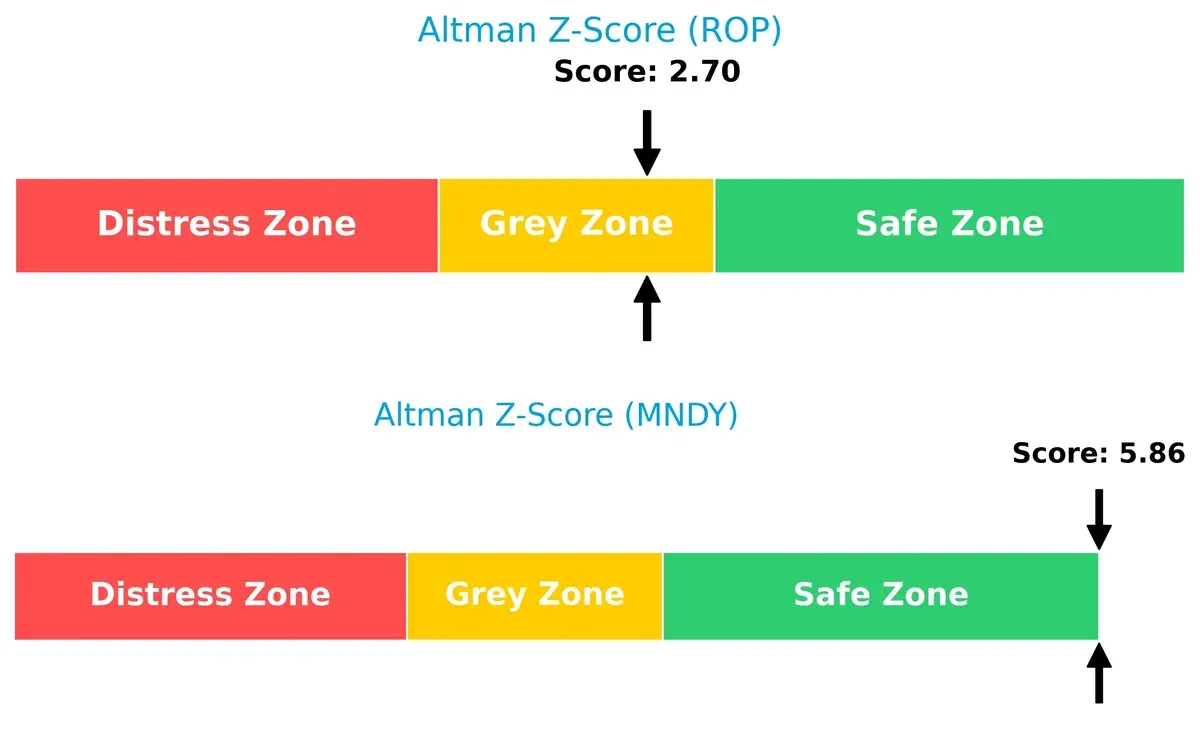
Bankruptcy Risk: Solvency Showdown
The Altman Z-Score gap indicates monday.com is in the safe zone, while Roper sits in the grey zone, implying lower bankruptcy risk for monday.com amid current market uncertainties:
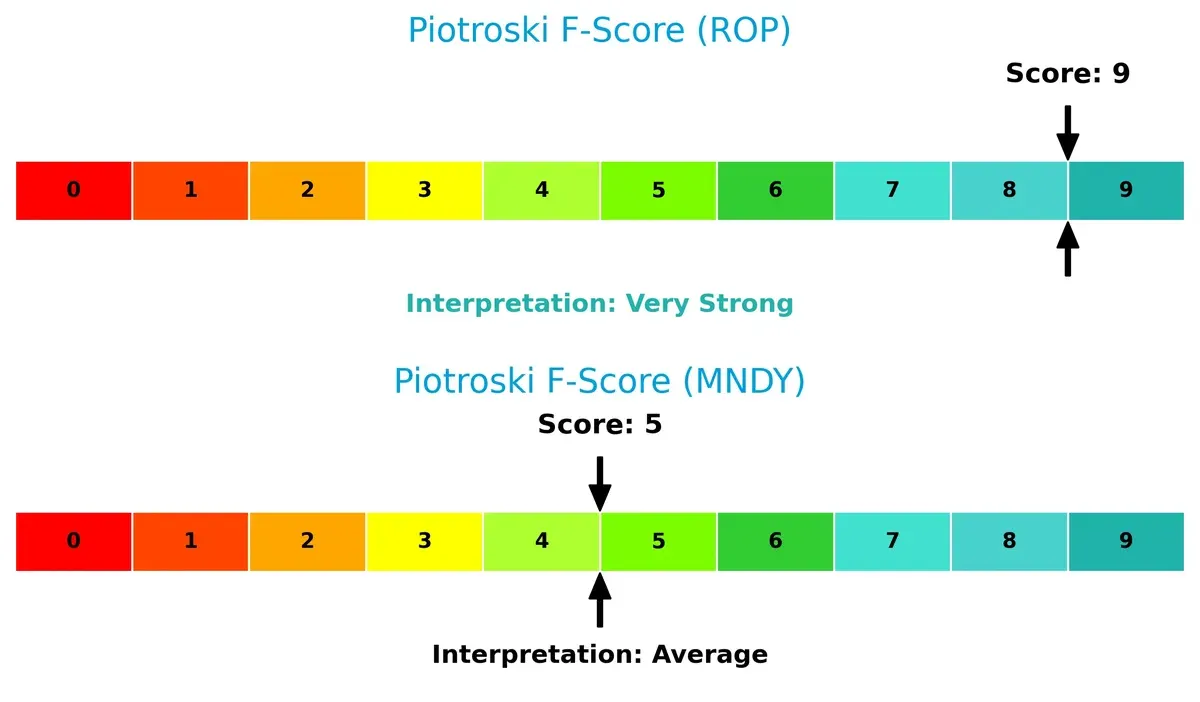
Financial Health: Quality of Operations
Roper’s Piotroski F-Score of 9 signals peak financial health with strong profitability and efficiency metrics. Monday.com’s score of 5 reflects average health, raising caution on internal operational risks:
How are the two companies positioned?
This section dissects the operational DNA of ROP and MNDY by comparing their revenue distribution and internal strengths and weaknesses. The goal is to confront their economic moats to identify which model offers the most resilient, sustainable competitive advantage today.
Revenue Segmentation: The Strategic Mix
The following visual comparison dissects how Roper Technologies and monday.com Ltd. diversify their income streams and where their primary sector bets lie:
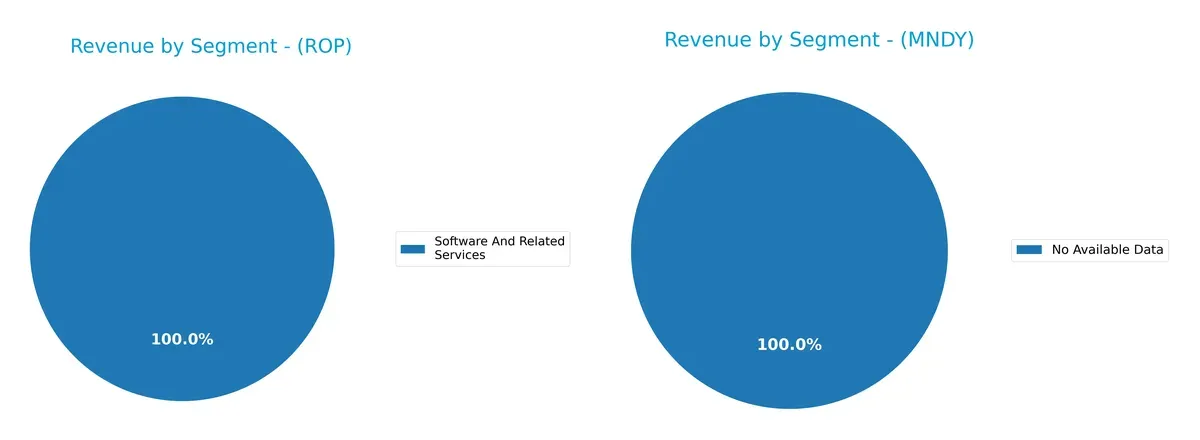
Roper Technologies reveals a diversified revenue base across software, network systems, and technology-enabled products, anchoring its strength in multiple segments with $3.2B in application software alone. In contrast, monday.com Ltd. lacks available segmentation data, preventing direct comparison. Roper’s broad mix reduces concentration risk and supports ecosystem lock-in, while monday.com’s unknown profile raises questions about its income diversity and resilience.
Strengths and Weaknesses Comparison
This table compares the Strengths and Weaknesses of Roper Technologies, Inc. and monday.com Ltd.:
ROP Strengths
- Strong US revenue base at $6.06B in 2024
- Diversified software segments with $10.7B revenue
- Favorable net margin at 19.44%
- Low debt-to-assets ratio and strong interest coverage (6.96)
- Favorable price-to-book ratio
monday.com Strengths
- Healthy liquidity with current and quick ratios at 2.66
- Low debt-to-assets at 6.29% and infinite interest coverage
- Strong fixed asset turnover at 7.13
- Neutral asset turnover at 0.58
- Moderate debt-to-equity at 0.1
ROP Weaknesses
- Unfavorable ROE and ROIC at 0% indicating poor capital returns
- Unavailable WACC and weak liquidity ratios (current and quick at 0)
- High price-to-earnings ratio at 31.06 considered unfavorable
- Low dividend yield at 0.74%
- Unfavorable asset and fixed asset turnover
monday.com Weaknesses
- Low net margin at 3.33% and negative ROIC (-1.73%)
- Very high price-to-earnings ratio at 362.98 and price-to-book at 11.41
- No dividend yield reported
- Unfavorable returns on equity at 3.14%
ROP shows strength in profitability and diversified revenue streams, but weak capital efficiency and liquidity pose risks. monday.com benefits from strong liquidity and asset efficiency but struggles with profitability and valuation concerns. These contrasting profiles suggest different strategic priorities regarding capital allocation and growth management.
The Moat Duel: Analyzing Competitive Defensibility
A structural moat shields long-term profits from competitive erosion. Without it, firms face relentless margin pressure and market share loss:
Roper Technologies, Inc.: Diversified Industrial Software & Engineering Moat
Roper’s moat stems from intangible assets and product diversification across niche industrial markets. Its stable 28.6% EBIT margin reflects resilient pricing power. Expansion into cloud-based analytics may deepen this moat in 2026 but requires vigilance on margin compression risks.
monday.com Ltd.: Rapidly Scaling SaaS Platform with Network Effects
monday.com leverages network effects through its modular Work OS, driving 33%+ revenue growth and accelerating profitability. Unlike Roper’s industrial base, monday.com’s moat hinges on user engagement and platform expansion, positioning it well for disruption in 2026’s collaborative software space.
Moat Strength Showdown: Diversification vs. Network-Driven Growth
Roper boasts a broader moat anchored in diversified industrial tech, while monday.com’s narrower moat grows rapidly via software network effects. I see monday.com better equipped to defend market share amid fast-paced tech innovation, despite Roper’s steady industrial foothold.
Which stock offers better returns?
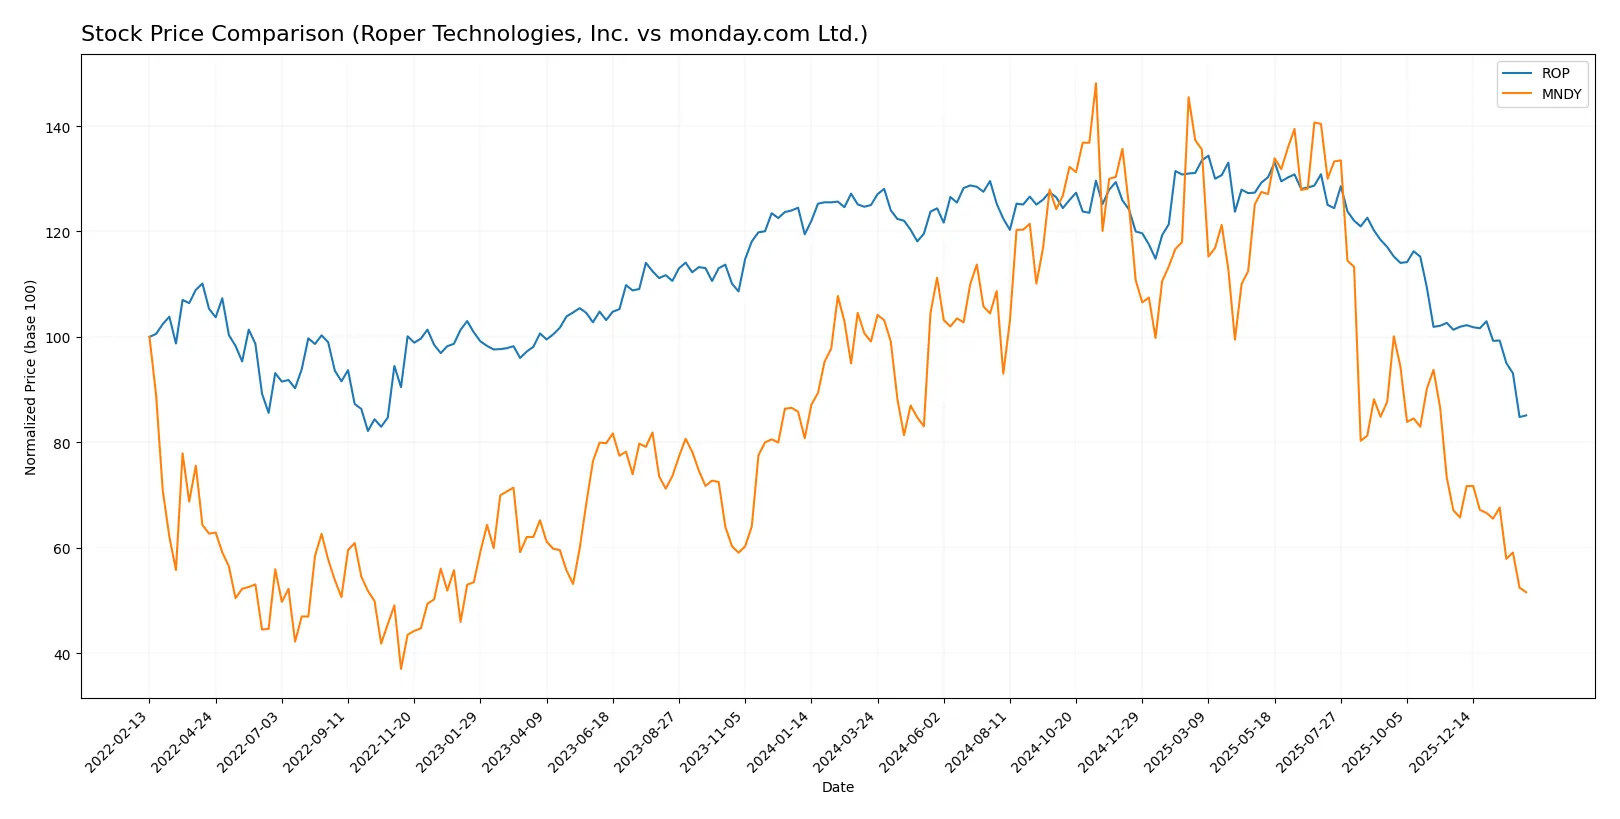
The past year saw both Roper Technologies and monday.com experience significant declines, with persistent seller dominance and decelerating downtrends shaping their trading dynamics.
Trend Comparison
Roper Technologies, Inc. shows a bearish trend over the past 12 months with a -31.92% price change and decelerating losses. The stock ranged from a high of 588.38 to a low of 371.23.
monday.com Ltd. also exhibits a bearish trend with a steeper -48.01% decline over the same period and deceleration in downward momentum. Its price fluctuated between 324.31 and 112.82.
Comparing both, Roper Technologies outperformed monday.com with a smaller decline, delivering the higher market performance in the last year.
Target Prices
Analysts present a cautiously optimistic target consensus for both Roper Technologies, Inc. and monday.com Ltd.
| Company | Target Low | Target High | Consensus |
|---|---|---|---|
| Roper Technologies, Inc. | 365 | 575 | 475.5 |
| monday.com Ltd. | 140 | 310 | 238.15 |
Roper’s consensus target of 475.5 suggests a 28% upside from its current 373 price. monday.com’s target consensus at 238.15 implies over 110% potential gain versus its 113 price today.

Don’t Let Luck Decide Your Entry Point
Optimize your entry points with our advanced ProRealTime indicators. You’ll get efficient buy signals with precise price targets for maximum performance. Start outperforming now!
How do institutions grade them?
Roper Technologies, Inc. Grades
Here are the latest grades assigned by major financial institutions for Roper Technologies, Inc.:
| Grading Company | Action | New Grade | Date |
|---|---|---|---|
| Goldman Sachs | Maintain | Neutral | 2026-01-29 |
| Argus Research | Downgrade | Hold | 2026-01-28 |
| Mizuho | Maintain | Underperform | 2026-01-28 |
| RBC Capital | Maintain | Sector Perform | 2026-01-28 |
| Stifel | Downgrade | Hold | 2026-01-28 |
| Citigroup | Maintain | Buy | 2026-01-28 |
| JP Morgan | Maintain | Underweight | 2026-01-28 |
| Truist Securities | Maintain | Buy | 2026-01-28 |
| Barclays | Maintain | Underweight | 2026-01-28 |
| Oppenheimer | Downgrade | Perform | 2026-01-28 |
monday.com Ltd. Grades
The following table shows monday.com Ltd.’s recent grades from reputable institutions:
| Grading Company | Action | New Grade | Date |
|---|---|---|---|
| Morgan Stanley | Maintain | Overweight | 2026-01-27 |
| Keybanc | Maintain | Overweight | 2026-01-22 |
| BTIG | Maintain | Buy | 2026-01-15 |
| Barclays | Maintain | Overweight | 2026-01-12 |
| Jefferies | Maintain | Buy | 2026-01-05 |
| Citigroup | Maintain | Buy | 2025-12-23 |
| Tigress Financial | Maintain | Buy | 2025-12-11 |
| DA Davidson | Maintain | Buy | 2025-11-11 |
| JP Morgan | Maintain | Overweight | 2025-11-11 |
| Jefferies | Maintain | Buy | 2025-11-11 |
Which company has the best grades?
monday.com Ltd. consistently receives buy and overweight ratings, indicating stronger institutional confidence. Roper Technologies, Inc. shows mixed to cautious grades, which may imply higher uncertainty or sector challenges. Investors might perceive monday.com as having more favorable analyst sentiment.
Risks specific to each company
The following categories identify the critical pressure points and systemic threats facing both firms in the 2026 market environment:
1. Market & Competition
Roper Technologies, Inc.
- Operates in industrial machinery with diversified software and hardware products; faces competition from specialized industrial tech firms.
monday.com Ltd.
- Competes in a crowded SaaS work management market; faces pressure from larger cloud software providers and evolving customer demands.
2. Capital Structure & Debt
Roper Technologies, Inc.
- Exhibits favorable debt-to-equity and interest coverage metrics, indicating manageable leverage and solid debt servicing.
monday.com Ltd.
- Maintains low debt levels and strong liquidity ratios, reducing financial risk but limiting leverage benefits.
3. Stock Volatility
Roper Technologies, Inc.
- Beta near 0.93 suggests below-market volatility, reflecting stability typical for industrial sectors.
monday.com Ltd.
- Beta at 1.25 indicates above-market volatility, common in growth-oriented tech firms.
4. Regulatory & Legal
Roper Technologies, Inc.
- Subject to industry-specific regulations including safety and environmental compliance in machinery and healthcare segments.
monday.com Ltd.
- Faces data privacy and cross-border compliance risks due to its cloud-based SaaS business model and international presence.
5. Supply Chain & Operations
Roper Technologies, Inc.
- Complex manufacturing and supply chain expose it to raw material costs and operational disruptions.
monday.com Ltd.
- Relies on cloud infrastructure providers with operational risks centered on service uptime and cybersecurity.
6. ESG & Climate Transition
Roper Technologies, Inc.
- Industrial footprint subjects it to increasing pressure on emissions and environmental sustainability initiatives.
monday.com Ltd.
- Less carbon-intensive but faces scrutiny on data center energy usage and governance in a tech-driven environment.
7. Geopolitical Exposure
Roper Technologies, Inc.
- Primarily US-based with significant exposure to North American and global industrial market cycles.
monday.com Ltd.
- Headquartered in Israel with international operations, exposing it to geopolitical tensions and currency fluctuations.
Which company shows a better risk-adjusted profile?
Roper’s key risk lies in its industrial operational complexity and potential regulatory costs, while monday.com’s high valuation multiples and market volatility pose substantial risk. Roper’s stable leverage and lower beta grant it a better risk-adjusted profile. Notably, monday.com’s P/E ratio above 360 signals extreme market expectations and valuation risk, underscoring my caution.
Final Verdict: Which stock to choose?
Roper Technologies, Inc. (ROP) excels as a cash-generating industrial conglomerate with resilient gross margins and a solid income quality profile. Its main point of vigilance lies in liquidity constraints, reflected by a low current ratio. ROP is suited for investors seeking steady income with moderate growth within diversified portfolios.
monday.com Ltd. (MNDY) boasts a strategic moat in its cloud-based platform, driving rapid revenue growth and improving profitability. It offers a healthier liquidity position and lower financial leverage than ROP, enhancing its safety profile. MNDY fits investors inclined toward growth at a reasonable price (GARP) in the tech innovation space.
If you prioritize stable cash flow and proven profitability, ROP is the compelling choice due to its superior income quality and industrial diversification. However, if you seek aggressive growth with a technology edge and improving returns on invested capital, MNDY offers better upside potential despite its current value destruction. Each appeals to distinct investor avatars balancing risk and growth differently.
Disclaimer: Investment carries a risk of loss of initial capital. The past performance is not a reliable indicator of future results. Be sure to understand risks before making an investment decision.
Go Further
I encourage you to read the complete analyses of Roper Technologies, Inc. and monday.com Ltd. to enhance your investment decisions: