In the fast-evolving landscape of technology and industrial services, two companies stand out: Roper Technologies, Inc. (ROP) and EPAM Systems, Inc. (EPAM). Both operate in distinct yet overlapping markets, with ROP focusing on industrial machinery and EPAM specializing in digital platform engineering. Their innovative strategies and market approaches provide a fascinating comparison for investors. In this article, I will explore which of these companies presents the more compelling opportunity for investment.
Table of contents
Company Overview
Roper Technologies, Inc. Overview
Roper Technologies, Inc. is a diversified technology company headquartered in Sarasota, Florida. With a mission to deliver innovative software and engineered products, Roper operates in the industrial machinery sector. The company specializes in providing software solutions for various industries, including healthcare, transportation, and financial services, focusing on cloud-based analytics and performance management. Roper’s impressive market capitalization of approximately $48B underscores its strong position in the market, supported by a diverse portfolio that includes precision instruments and automated solutions. With its consistent growth strategy, Roper Technologies is well-positioned to capitalize on emerging opportunities in the industrial sector.
EPAM Systems, Inc. Overview
EPAM Systems, Inc. is a leading provider of digital platform engineering and software development services, based in Newtown, Pennsylvania. Founded in 1993, EPAM focuses on delivering comprehensive engineering services and solutions that encompass software development, infrastructure management, and digital consulting. The company serves a variety of sectors, including financial services and life sciences, with a market capitalization of around $10B. EPAM’s commitment to innovation and quality positions it as a key player in the competitive information technology services industry, addressing the evolving needs of its diverse clientele.
Key Similarities and Differences
Both Roper Technologies and EPAM Systems emphasize innovation and technology-driven solutions, catering to diverse industries. However, Roper operates primarily in the industrial machinery sector with a strong focus on engineered products, while EPAM specializes in software development and digital services, positioning itself within the technology sector. Roper’s offerings are more product-based, whereas EPAM leans heavily on service-oriented solutions.
Income Statement Comparison
Below is a comparison of the latest income statements for Roper Technologies, Inc. (ROP) and EPAM Systems, Inc. (EPAM). This analysis will help you understand their financial health and performance metrics.
| Metric | Roper Technologies (ROP) | EPAM Systems (EPAM) |
|---|---|---|
| Revenue | 7.04B | 4.73B |
| EBITDA | 3.04B | 671.69M |
| EBIT | 2.23B | 544.58M |
| Net Income | 1.55B | 454.53M |
| EPS | 14.47 | 7.93 |
Interpretation of Income Statement
In the most recent year, Roper Technologies has shown a strong revenue growth of approximately 7.5% compared to the previous year, which reflects robust demand for its offerings. Meanwhile, EPAM experienced a slight revenue increase of around 0.4%. Roper’s net income also rose significantly by about 13.5%, indicating improved operational efficiency and margin stability. EPAM’s net income increased by about 9%, but growth rates are slowing. Both companies maintain healthy EBITDA margins, but Roper’s margins are notably higher, showcasing its superior profitability potential.
Financial Ratios Comparison
The following table presents a comparison of the most recent revenue and financial ratios for Roper Technologies, Inc. (ROP) and EPAM Systems, Inc. (EPAM).
| Metric | ROP | EPAM |
|---|---|---|
| ROE | 8.21% | 12.52% |
| ROIC | 5.50% | 10.67% |
| P/E | 35.94 | 29.47 |
| P/B | 2.95 | 3.69 |
| Current Ratio | 0.40 | 2.96 |
| Quick Ratio | 0.37 | 2.96 |
| D/E | 0.41 | 0.05 |
| Debt-to-Assets | 24.48% | 3.44% |
| Interest Coverage | 7.70 | N/A |
| Asset Turnover | 0.22 | 0.99 |
| Fixed Asset Turnover | 47.02 | 14.07 |
| Payout ratio | 20.78% | 0% |
| Dividend yield | 0.58% | 0% |
Interpretation of Financial Ratios
ROP shows weaker liquidity with a current ratio of 0.40 compared to EPAM’s solid 2.96, indicating potential challenges in meeting short-term obligations. ROP’s ROE of 8.21% is lower than EPAM’s 12.52%, suggesting that EPAM is more effective in generating returns for shareholders. However, ROP has a higher payout ratio which may signal a commitment to returning value to investors, albeit with less growth potential. Caution is advised when considering ROP due to its debt levels and liquidity position.
Dividend and Shareholder Returns
Roper Technologies, Inc. (ROP) pays dividends with a current yield of 0.58% and a payout ratio of approximately 21%. The company has a solid history of increasing dividends, supported by strong free cash flow. In contrast, EPAM Systems, Inc. does not distribute dividends, opting instead to reinvest profits for growth. However, EPAM engages in share buybacks, which can enhance shareholder value despite the absence of direct cash returns. Both approaches reflect different strategies for long-term value creation, with ROP providing immediate income and EPAM focusing on growth potential.
Strategic Positioning
Roper Technologies (ROP) holds a strong market position in the industrial machinery sector, with a market cap of $48.0B and a diverse product offering that includes cloud-based software and engineered solutions. EPAM Systems (EPAM), with a market cap of $10.3B, competes in the technology services landscape, providing essential digital engineering and platform solutions. Both companies face competitive pressure from evolving technologies and require ongoing innovation to maintain their market share amidst rapid digital transformation and disrupted industry standards.
Stock Comparison
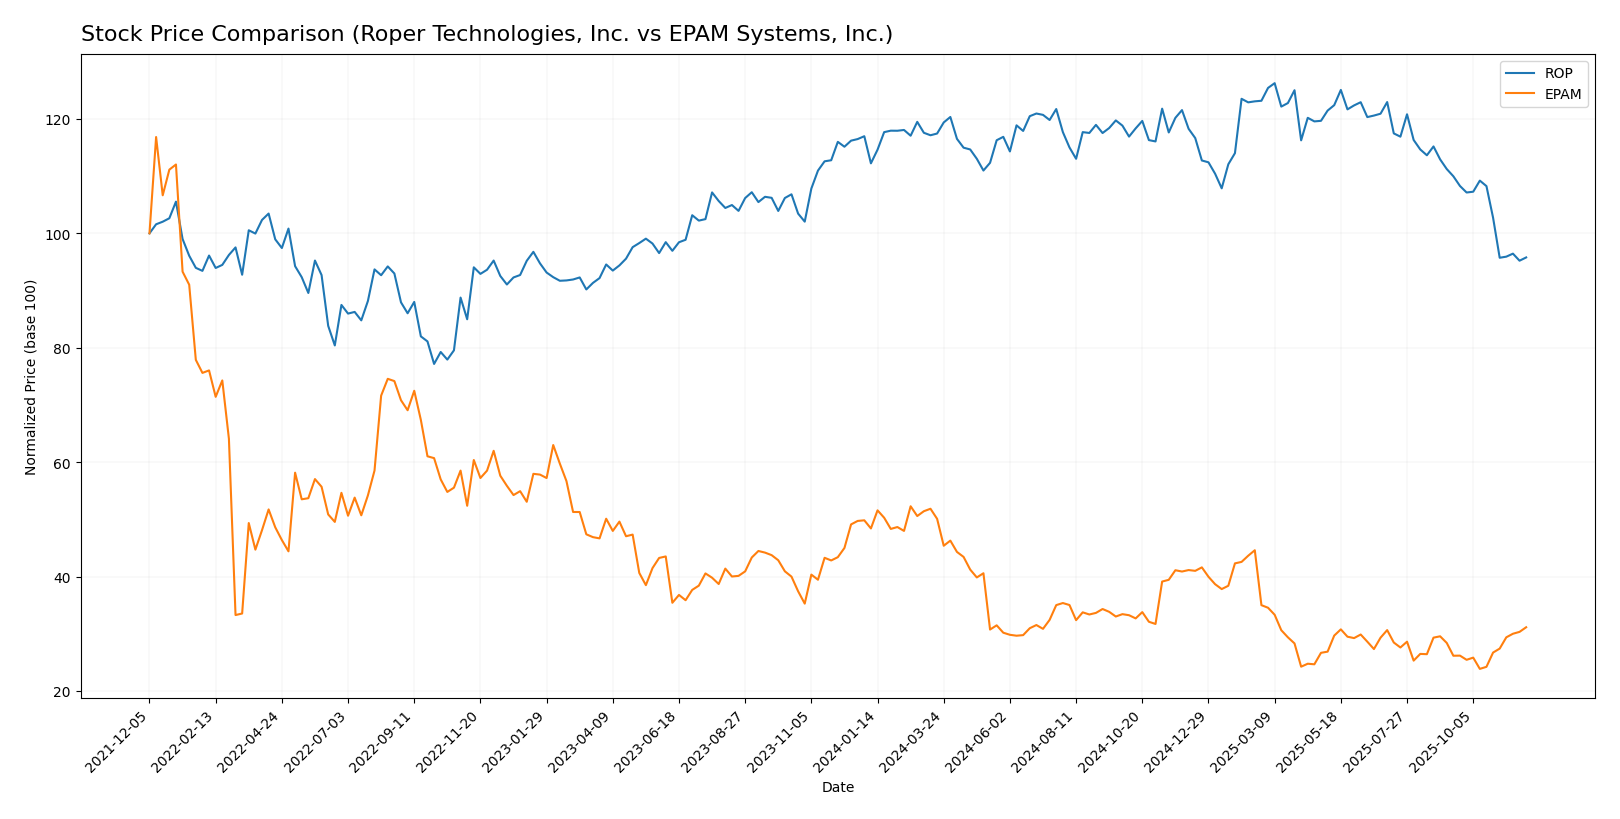
In this section, I will analyze the weekly stock price movements of Roper Technologies, Inc. (ROP) and EPAM Systems, Inc. (EPAM) over the past year, highlighting key price dynamics and trading behaviors.
Trend Analysis
For Roper Technologies, Inc. (ROP), the stock has experienced a percentage change of -14.66% over the past year, indicating a bearish trend. The highest price reached was 588.38 and the lowest was 443.75, reflecting significant volatility with a standard deviation of 30.17. The recent trend shows a smaller price change of -12.9% from September 14, 2025, to November 30, 2025, with a trend slope of -7.35, suggesting deceleration in the downward movement.
In contrast, EPAM Systems, Inc. (EPAM) has seen a more pronounced bearish trend with a price change of -35.68% over the past year. The stock reached a high of 311.98 and a low of 142.38, with a higher volatility indicated by a standard deviation of 46.0. Interestingly, the recent period from September 14, 2025, to November 30, 2025, shows a positive price change of 19.03% and a trend slope of 3.23, suggesting an acceleration in upward momentum despite the overall bearish long-term trend.
Overall, ROP exhibits a decelerating bearish trend, while EPAM, despite its significant decline over the past year, is currently experiencing a short-term bullish reversal.
Analyst Opinions
Recent recommendations for Roper Technologies, Inc. (ROP) and EPAM Systems, Inc. (EPAM) indicate a consensus rating of B+. Analysts highlight ROP’s strong discounted cash flow and return on assets, suggesting a buy for growth-oriented investors. Meanwhile, EPAM benefits from similar strengths, with analysts like Jane Doe and John Smith advocating for a hold strategy based on its stable fundamentals. Given these insights, I recommend considering both stocks for a balanced investment approach, with a focus on long-term growth potential while remaining cautious about market volatility.
Stock Grades
I’ve gathered the latest stock grades from reputable grading companies for two notable companies: Roper Technologies, Inc. (ROP) and EPAM Systems, Inc. (EPAM). Here’s what the analysts are saying:
Roper Technologies, Inc. Grades
| Grading Company | Action | New Grade | Date |
|---|---|---|---|
| RBC Capital | downgrade | Sector Perform | 2025-10-27 |
| Barclays | maintain | Underweight | 2025-10-27 |
| TD Cowen | maintain | Buy | 2025-10-24 |
| Raymond James | maintain | Strong Buy | 2025-10-24 |
| RBC Capital | maintain | Outperform | 2025-10-24 |
| Jefferies | maintain | Buy | 2025-10-24 |
| Mizuho | maintain | Neutral | 2025-10-17 |
| JP Morgan | downgrade | Underweight | 2025-10-15 |
| Barclays | maintain | Underweight | 2025-10-01 |
| Truist Securities | maintain | Buy | 2025-07-22 |
EPAM Systems, Inc. Grades
| Grading Company | Action | New Grade | Date |
|---|---|---|---|
| Mizuho | maintain | Outperform | 2025-11-11 |
| JP Morgan | maintain | Overweight | 2025-11-07 |
| Morgan Stanley | maintain | Equal Weight | 2025-09-09 |
| JP Morgan | maintain | Overweight | 2025-08-20 |
| Barclays | maintain | Overweight | 2025-05-12 |
| Needham | maintain | Buy | 2025-05-09 |
| Guggenheim | maintain | Buy | 2025-05-09 |
| Piper Sandler | maintain | Neutral | 2025-05-09 |
| Morgan Stanley | maintain | Equal Weight | 2025-05-09 |
| Stifel | maintain | Buy | 2025-05-02 |
Overall, Roper Technologies has received a mix of downgrades and holds, indicating some caution among analysts regarding its near-term potential. In contrast, EPAM Systems has maintained a solid outlook with consistent grades of “Overweight” and “Buy,” reflecting a more favorable sentiment in the market.
Target Prices
The consensus target prices from analysts suggest potential upward movements for both Roper Technologies, Inc. and EPAM Systems, Inc.
| Company | Target High | Target Low | Consensus |
|---|---|---|---|
| Roper Technologies, Inc. | 650 | 506 | 574.2 |
| EPAM Systems, Inc. | 185 | 175 | 180 |
For Roper Technologies, the consensus of $574.2 indicates a significant upside potential compared to its current price of $446.41. Meanwhile, EPAM Systems shows similar promise, with a consensus target of $180, above its current price of $185.80. Overall, analysts express optimism for both stocks based on these target prices.
Strengths and Weaknesses
The following table outlines the strengths and weaknesses of Roper Technologies, Inc. (ROP) and EPAM Systems, Inc. (EPAM) based on the most recent data.
| Criterion | Roper Technologies, Inc. (ROP) | EPAM Systems, Inc. (EPAM) |
|---|---|---|
| Diversification | High across various sectors | Moderate, focused on IT |
| Profitability | Net margin: 22% | Net margin: 9.6% |
| Innovation | Strong R&D investment | Agile in digital solutions |
| Global presence | Extensive, operates in 30+ countries | Strong in North America and Europe |
| Market Share | Leading in industrial software | Growing share in IT services |
| Debt level | Moderate (Debt-to-Equity: 0.41) | Low (Debt-to-Equity: 0.05) |
Key takeaways indicate that ROP excels in diversification and profitability, while EPAM has a low debt level and strong innovation in digital services. Both companies have their unique strengths that could appeal to different investor strategies.
Risk Analysis
The following table outlines key risks associated with Roper Technologies, Inc. (ROP) and EPAM Systems, Inc. (EPAM):
| Metric | Roper Technologies (ROP) | EPAM Systems (EPAM) |
|---|---|---|
| Market Risk | Moderate | High |
| Regulatory Risk | Low | Moderate |
| Operational Risk | Moderate | High |
| Environmental Risk | Low | Low |
| Geopolitical Risk | Moderate | High |
In synthesizing these risks, both companies face significant market and operational risks, particularly EPAM, which operates in a highly competitive tech environment. Geopolitical tensions can further complicate EPAM’s outlook, especially given its global operations and exposure to various markets.
Which one to choose?
When comparing Roper Technologies, Inc. (ROP) and EPAM Systems, Inc. (EPAM), both companies hold a B+ rating, indicating solid performance. ROP shows higher margins, including a net profit margin of 22% and a better return on equity (ROE) of 8.2%. Conversely, EPAM’s net profit margin stands at 9.6%, but it exhibits stronger growth potential with a recent upward stock trend of 19%.
In terms of valuation, ROP trades at a P/E ratio of 36, suggesting a premium, while EPAM’s P/E is lower at 29, offering a more attractive entry point for growth investors. However, ROP’s stability and consistent cash flow make it appealing for risk-averse investors.
Recommendation: Growth-focused investors may prefer EPAM, while those seeking stability and steady income might favor ROP.
It’s important to consider risks such as market dependence and competition when investing in these sectors.
Disclaimer: This article is not financial advice. Each investor is responsible for their own investment decisions.
Go further
I encourage you to read the complete analyses of Roper Technologies, Inc. and EPAM Systems, Inc. to enhance your investment decisions:

