Home > Comparison > Technology > AMD vs CEVA
The strategic rivalry between Advanced Micro Devices, Inc. (AMD) and CEVA, Inc. shapes the semiconductor industry’s evolution. AMD operates as a capital-intensive semiconductor powerhouse with broad product lines spanning computing and graphics. CEVA, in contrast, focuses on licensing wireless connectivity and smart sensing IP, emphasizing asset-light, high-margin growth. This comparison pits scale and vertical integration against nimble innovation. I will determine which company offers the superior risk-adjusted profile for a diversified technology portfolio.
Table of contents
Companies Overview
Advanced Micro Devices, Inc. and CEVA, Inc. stand as pivotal players shaping the semiconductor landscape with distinct market roles.
Advanced Micro Devices, Inc.: Semiconductor Powerhouse
Advanced Micro Devices, Inc. dominates the semiconductor industry with a diverse portfolio spanning x86 microprocessors, GPUs, and server processors. Its core revenue stems from Computing and Graphics segments alongside Enterprise, Embedded, and Semi-Custom solutions. In 2026, AMD’s strategic focus centers on expanding data center capabilities and high-performance computing to capture enterprise and cloud demand.
CEVA, Inc.: Licensing Innovator in Wireless Technologies
CEVA, Inc. specializes in licensing wireless connectivity and smart sensing technologies to semiconductor and OEM companies globally. Its revenue engine relies on licensing DSP cores, AI processors, and platforms for 5G, IoT, and sensor fusion markets. The company’s 2026 strategy emphasizes broadening AI and wireless platform adoption across mobile and IoT sectors through scalable IP solutions.
Strategic Collision: Similarities & Divergences
AMD pursues a vertically integrated hardware approach while CEVA champions an IP licensing model focused on wireless and AI innovation. Their primary battleground lies in semiconductor technology leadership for emerging applications like AI, 5G, and IoT. AMD offers a high-capital, product-driven investment profile contrasting with CEVA’s asset-light, royalty-based model, reflecting distinct risk-return dynamics for investors.
Income Statement Comparison
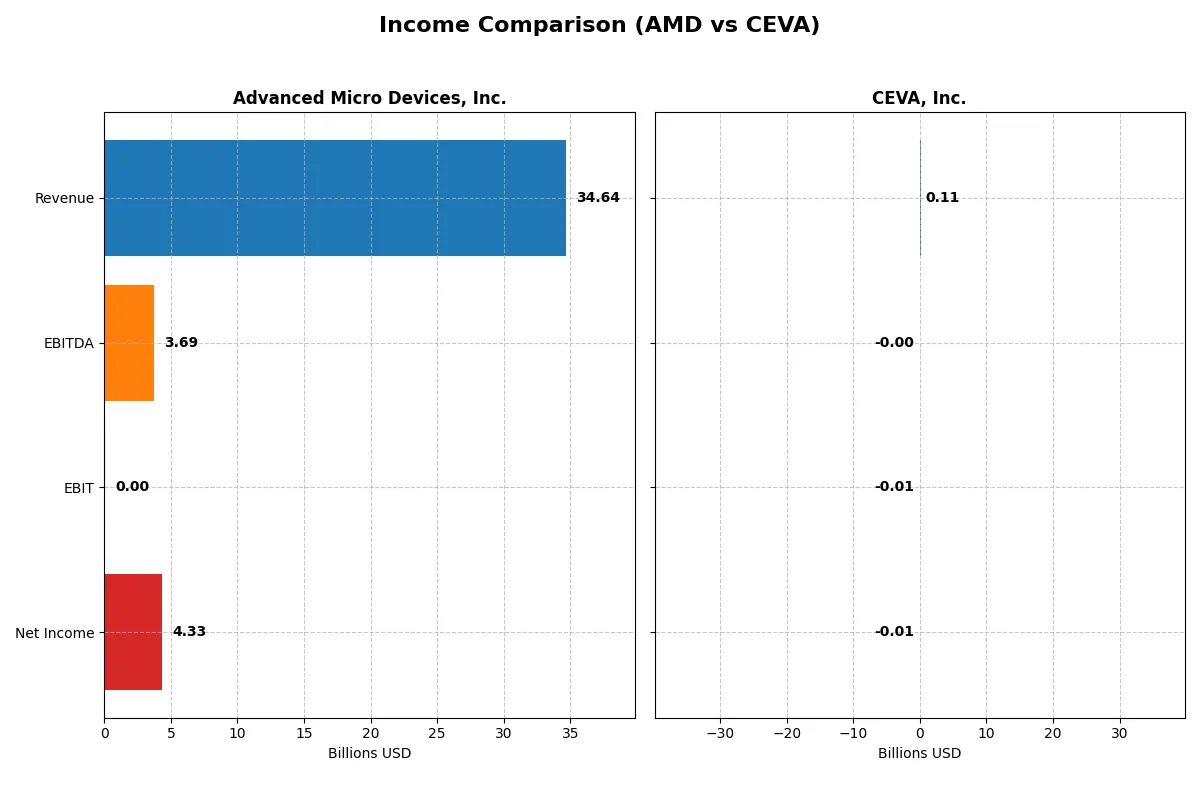
This data dissects the core profitability and scalability of both corporate engines to reveal who dominates the bottom line:
| Metric | Advanced Micro Devices, Inc. (AMD) | CEVA, Inc. (CEVA) |
|---|---|---|
| Revenue | 34.6B | 107M |
| Cost of Revenue | 17.5B | 13M |
| Operating Expenses | 13.5B | 102M |
| Gross Profit | 17.2B | 94M |
| EBITDA | 3.7B | -3.4M |
| EBIT | 3.7B | -7.5M |
| Interest Expense | 131M | 0 |
| Net Income | 4.3B | -8.8M |
| EPS | 2.67 | -0.37 |
| Fiscal Year | 2025 | 2024 |
Income Statement Analysis: The Bottom-Line Duel
This income statement comparison reveals which company runs a more efficient and profitable corporate engine from 2021 to 2025 (AMD) and 2020 to 2024 (CEVA).
Advanced Micro Devices, Inc. (AMD) Analysis
AMD’s revenue surged from $16.4B in 2021 to $34.6B in 2025, more than doubling over five years. Net income climbed steadily, hitting $4.3B in 2025 with a strong net margin of 12.5%. Its gross margin holds favorably near 50%, but EBIT margin dropped to zero in 2025, signaling potential operating efficiency challenges despite solid EBITDA of $3.7B. AMD’s momentum shows robust revenue and net income growth, supported by controlled operating expenses and R&D investments.
CEVA, Inc. Analysis
CEVA posted modest revenue growth from $100M in 2020 to $107M in 2024, with a notably high gross margin of 88%. However, it remains unprofitable at the EBIT and net income levels, recording a net loss of $8.8M in 2024. Although CEVA improved EBIT and net margin year-over-year, the company’s net margin stayed negative at -8.2%. Its operating losses highlight ongoing challenges in scaling efficiency despite favorable revenue growth and interest income.
Margin Strength vs. Scale Efficiency
AMD dominates in revenue scale and bottom-line profits, leveraging high gross margins and accelerating net income growth. CEVA’s superior gross margin contrasts sharply with persistent net losses and weak EBIT margins. For investors, AMD’s profile offers a more attractive combination of growth and profitability, while CEVA’s current losses warrant caution despite gross margin strength.
Financial Ratios Comparison
These vital ratios act as a diagnostic tool to expose the underlying fiscal health, valuation premiums, and capital efficiency of the companies compared below:
| Ratios | Advanced Micro Devices, Inc. (AMD) | CEVA, Inc. (CEVA) |
|---|---|---|
| ROE | 2.85% (2024) | -3.30% (2024) |
| ROIC | 2.49% (2024) | -2.68% (2024) |
| P/E | 124 (2024) | -85 (2024) |
| P/B | 3.52 (2024) | 2.79 (2024) |
| Current Ratio | 2.62 (2024) | 7.09 (2024) |
| Quick Ratio | 1.83 (2024) | 7.09 (2024) |
| D/E | 0.038 (2024) | 0.021 (2024) |
| Debt-to-Assets | 3.20% (2024) | 1.80% (2024) |
| Interest Coverage | 20.65 (2024) | 0 (2024) |
| Asset Turnover | 0.37 (2024) | 0.35 (2024) |
| Fixed Asset Turnover | 10.63 (2024) | 8.43 (2024) |
| Payout ratio | 0% (2024) | 0% (2024) |
| Dividend yield | 0% (2024) | 0% (2024) |
| Fiscal Year | 2024 | 2024 |
Efficiency & Valuation Duel: The Vital Signs
Ratios act as a company’s DNA, revealing hidden risks and operational strengths essential for informed investment decisions.
Advanced Micro Devices, Inc.
AMD shows a favorable net margin of 12.5% but an unfavorable ROE at zero, signaling weak shareholder profitability. Its P/E ratio stands high at 80.5, marking the stock as expensive. AMD offers no dividend yield; instead, it aggressively reinvests in R&D, allocating 25% of revenue to innovation.
CEVA, Inc.
CEVA posts negative profitability with a -8.2% net margin and -3.3% ROE, reflecting operational challenges. Its P/E ratio is negative but considered favorable due to losses, while the P/B ratio is neutral at 2.79. CEVA pays no dividends, focusing heavily on R&D, dedicating nearly 67% of revenue to future growth.
Premium Valuation vs. Operational Struggles
AMD commands a premium valuation backed by solid margins but lacks shareholder returns through dividends. CEVA struggles with profitability despite strong R&D investment and liquidity. AMD suits investors seeking innovation-driven growth at a high price, while CEVA fits those willing to tolerate losses for potential turnaround upside.
Which one offers the Superior Shareholder Reward?
I observe AMD and CEVA both forgo dividends, focusing on reinvestment and buybacks. AMD’s robust free cash flow of 3.4B supports an aggressive buyback, enhancing shareholder value sustainably. CEVA’s weak free cash flow (22M) and negative margins limit buyback capacity. AMD’s capital allocation signals superior total return potential in 2026.
Comparative Score Analysis: The Strategic Profile
The radar chart reveals the fundamental DNA and trade-offs of Advanced Micro Devices, Inc. and CEVA, Inc., highlighting their financial strengths and valuation profiles:
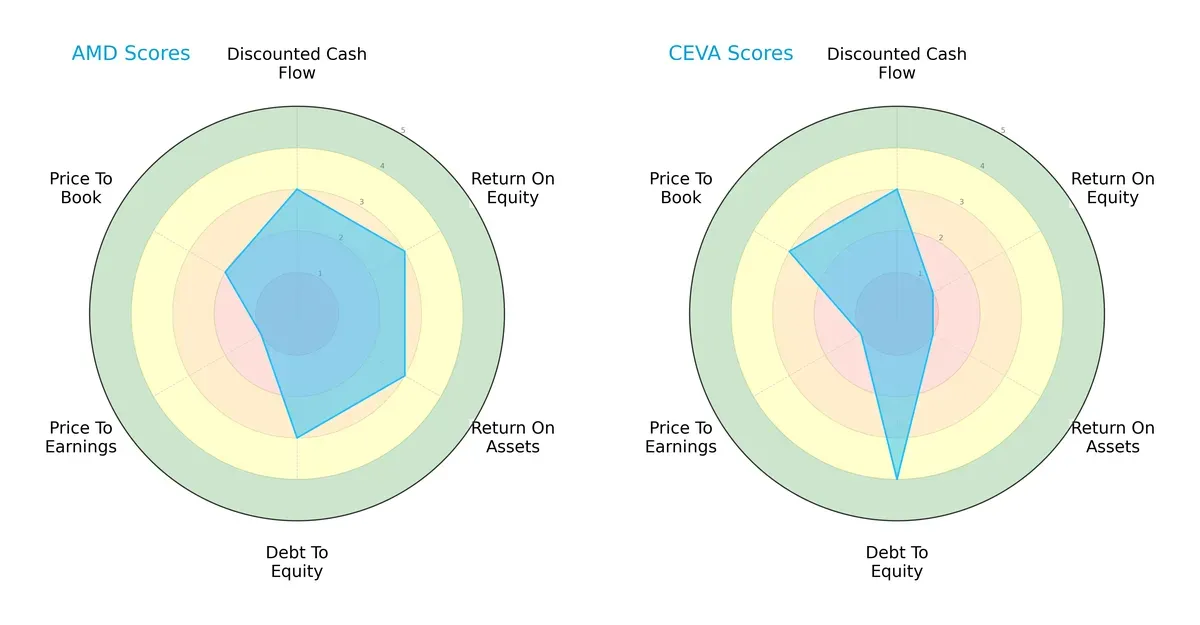
Advanced Micro Devices, Inc. (AMD) displays a balanced profile with moderate scores in DCF, ROE, ROA, and debt-to-equity, but suffers from a weak P/E valuation. CEVA, Inc. leans heavily on a strong debt-to-equity score but shows very weak profitability metrics (ROE, ROA). AMD presents a more consistent operational and financial foundation, while CEVA depends on conservative leverage.
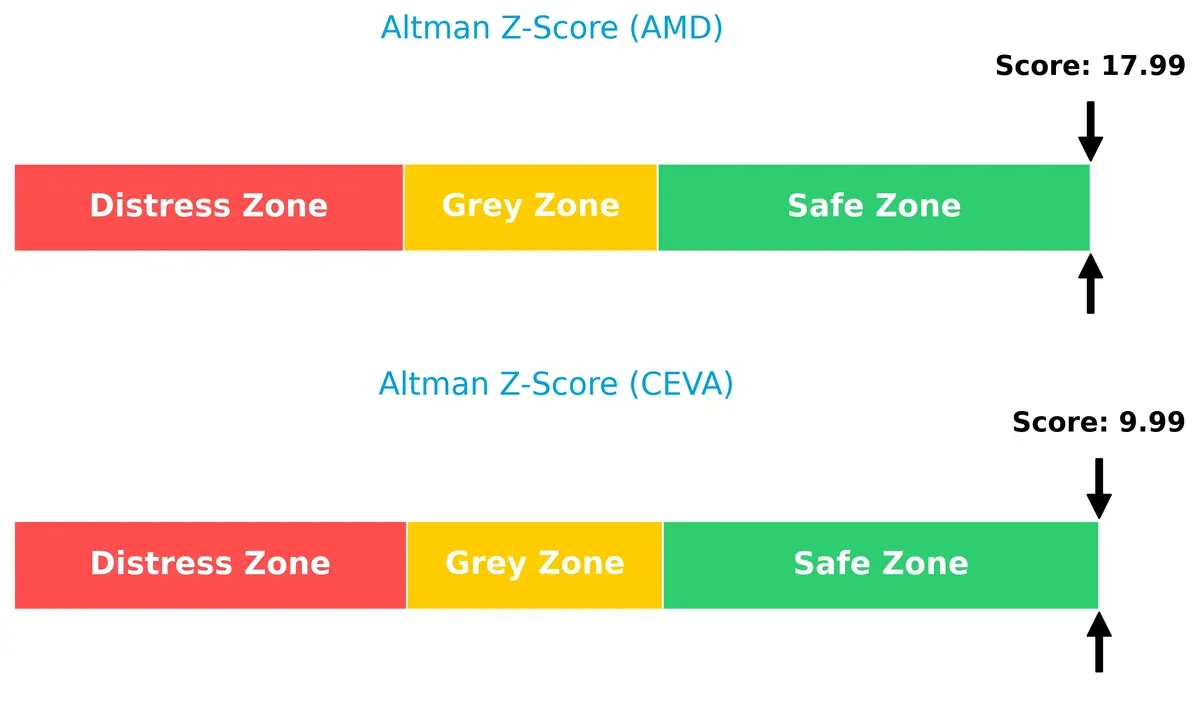
Bankruptcy Risk: Solvency Showdown
The Altman Z-Scores place both firms comfortably in the safe zone, with AMD’s 18.0 far surpassing CEVA’s 10.0, signaling AMD’s superior long-term solvency and lower bankruptcy risk in this cycle:
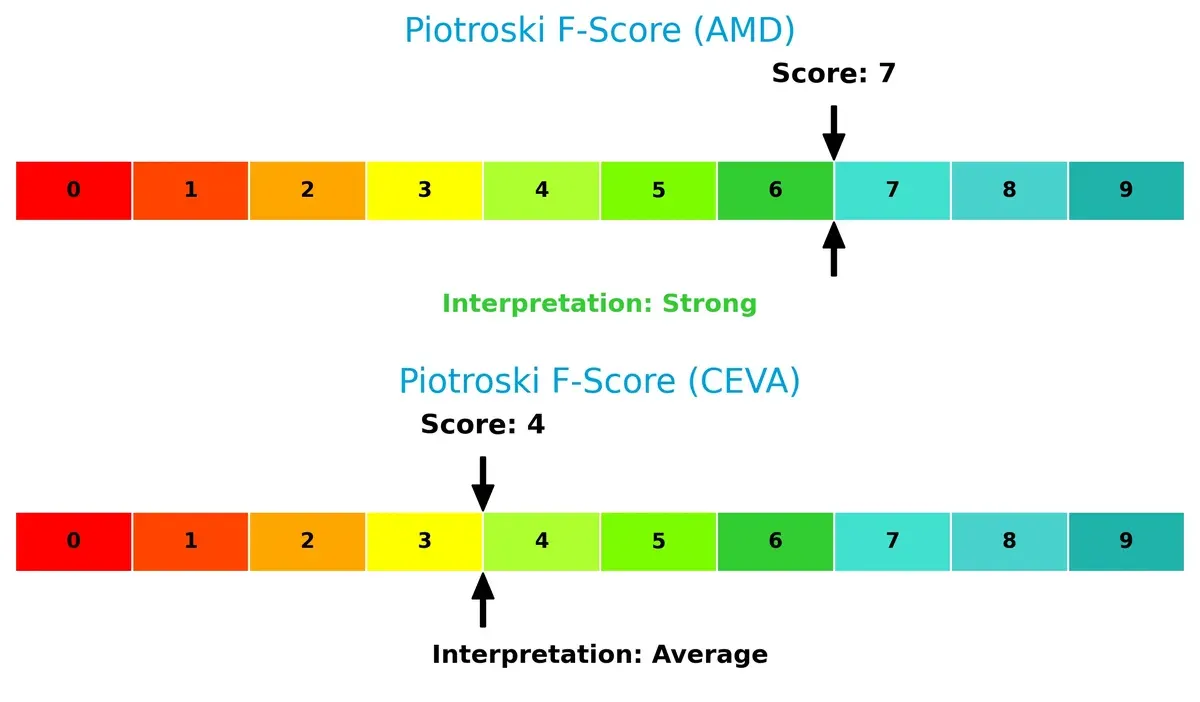
Financial Health: Quality of Operations
AMD’s Piotroski F-Score of 7 signals strong financial health and operational quality, contrasting with CEVA’s average score of 4, which raises caution about its internal fundamentals:
How are the two companies positioned?
This section dissects AMD and CEVA’s operational DNA by comparing their revenue distribution and internal strengths and weaknesses. The goal is to confront their economic moats and identify which business model offers the most resilient competitive advantage today.
Revenue Segmentation: The Strategic Mix
This visual comparison dissects how Advanced Micro Devices, Inc. and CEVA, Inc. diversify their income streams and where their primary sector bets lie:
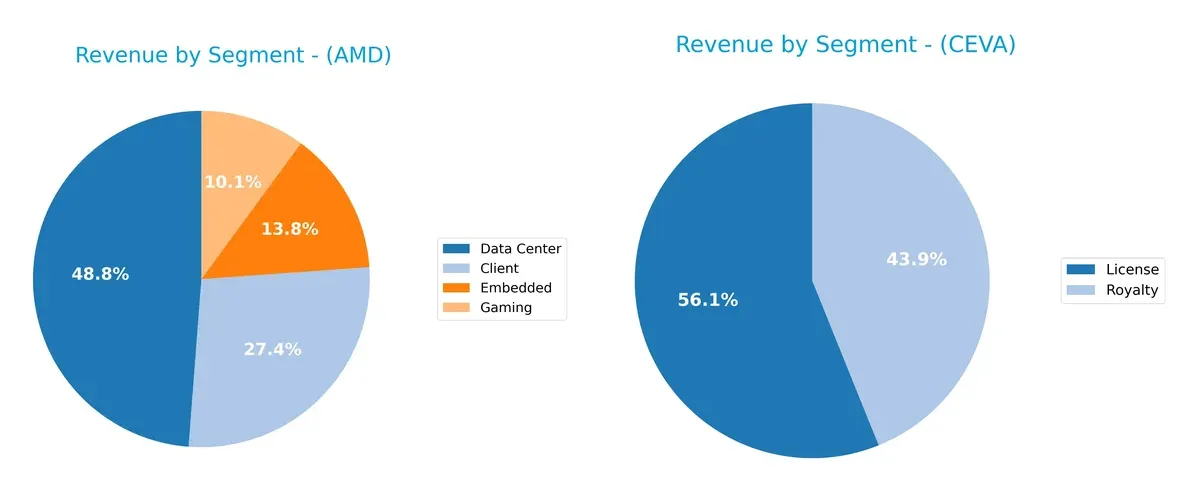
AMD’s revenue dwarfs CEVA’s, anchored by a strong Data Center segment at $12.6B in 2024, complemented by Client ($7.1B), Embedded ($3.6B), and Gaming ($2.6B). AMD exhibits a diversified portfolio, reducing concentration risk. CEVA relies heavily on License ($60M) and Royalty ($47M) revenues, reflecting a narrower focus on IP licensing. AMD’s ecosystem lock-in contrasts with CEVA’s dependency on a few product lines, highlighting different strategic scales and risk profiles.
Strengths and Weaknesses Comparison
This table compares the Strengths and Weaknesses of AMD and CEVA based on diversification, profitability, financials, innovation, global presence, and market share:
AMD Strengths
- Diverse product segments including Client, Data Center, Embedded, Gaming
- Strong revenue scale in multiple sectors
- Significant global footprint with major sales in US, China, Singapore
- Favorable net margin of 12.51%
- Low debt ratios indicate conservative financial structure
CEVA Strengths
- Focused product portfolio with emphasis on license and royalty revenues
- Favorable quick ratio and low debt-to-assets ratio
- High fixed asset turnover reflects efficient asset use
- Presence in Asia Pacific and growing US markets
- Neutral P/B ratio suggests stable valuation relative to assets
AMD Weaknesses
- Unfavorable ROE and ROIC, indicating limited returns on equity and capital
- High PE ratio at 80.54 signals expensive valuation
- Poor liquidity ratios (current and quick ratios at 0) raise financial risk
- Negative interest coverage implies difficulty servicing debt
- Low asset turnover may reflect operational inefficiency
CEVA Weaknesses
- Negative net margin and ROE reflect unprofitability
- Unfavorable WACC at 10.79% may increase capital costs
- Negative PE ratio complicates valuation
- Unfavorable current ratio despite high quick ratio signals liquidity concerns
- Unfavorable interest coverage and asset turnover ratios
AMD leverages its broad product diversification and strong global sales but faces challenges in generating returns and liquidity. CEVA shows operational efficiency in asset use and conservative leverage but struggles with profitability and liquidity. Both companies must address these weaknesses to solidify their competitive positions.
The Moat Duel: Analyzing Competitive Defensibility
A structural moat is the only thing protecting long-term profits from the erosion of competition. Let’s unpack the competitive advantages at play:
Advanced Micro Devices, Inc. (AMD): Innovation-Fueled Product Ecosystem
AMD’s moat stems from cutting-edge product innovation and ecosystem integration, driving robust revenue growth and margin stability. However, declining ROIC signals caution amid rising competition in 2026.
CEVA, Inc.: Licensing-Driven Intellectual Property
CEVA’s moat relies on proprietary DSP and AI IP licensing, differentiating it from AMD’s product-heavy model. Yet, negative ROIC and shrinking profitability undermine its competitive defensibility despite recent margin improvements.
Innovation Depth vs. IP Licensing Fragility
AMD holds a wider moat with strong revenue momentum and market presence, despite ROIC pressures. CEVA’s value destruction and weak returns expose a fragile moat less capable of defending market share in 2026.
Which stock offers better returns?
Over the past year, Advanced Micro Devices, Inc. (AMD) showed strong price gains with accelerating momentum, while CEVA, Inc. experienced a declining trend despite recent modest recovery signs.
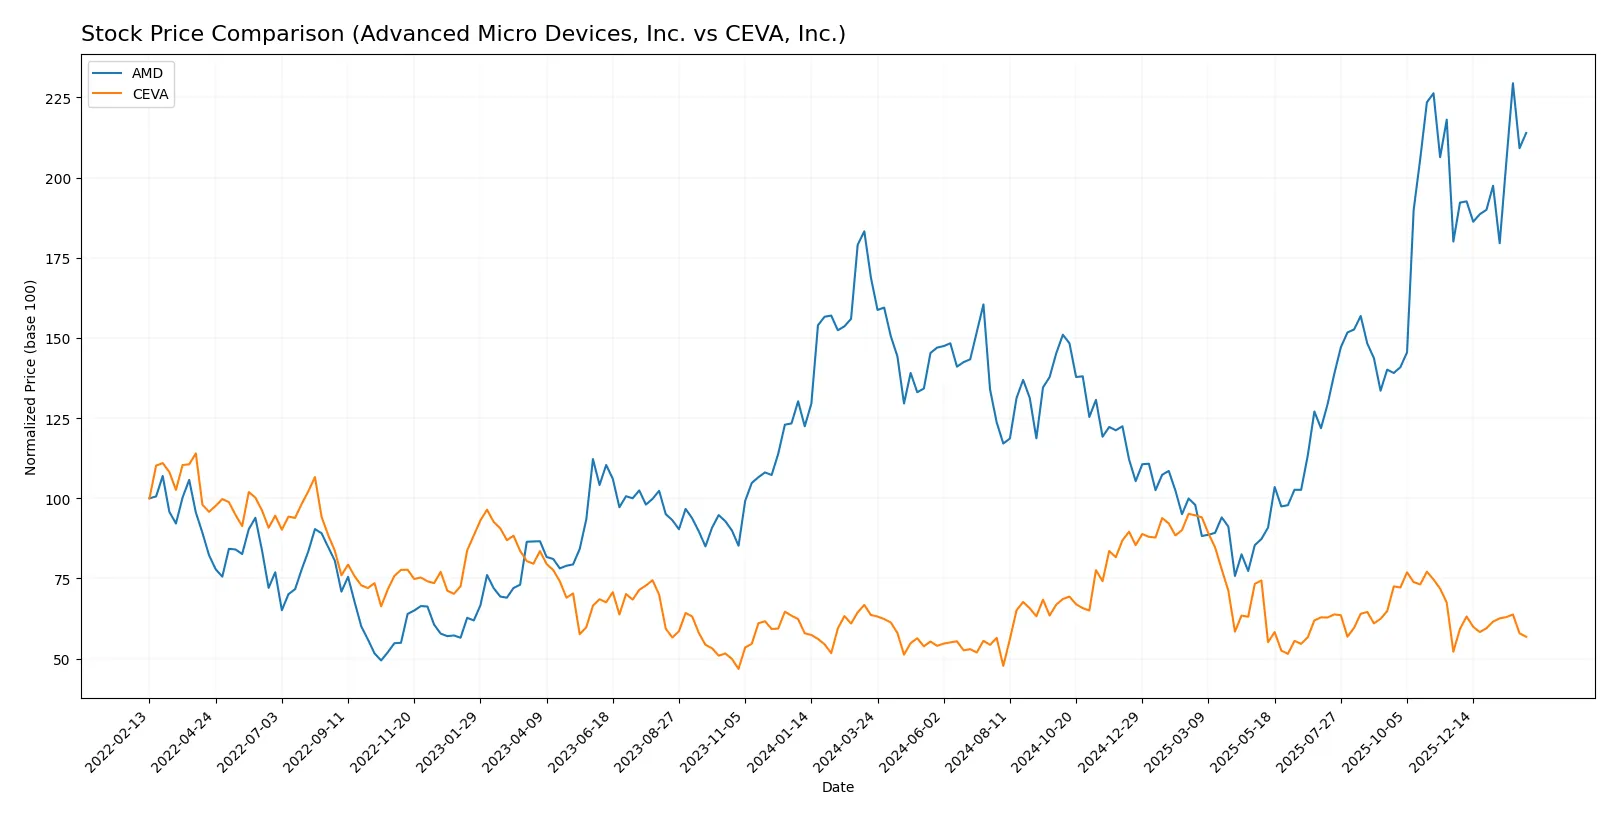
Trend Comparison
AMD’s stock price rose 26.72% over the past 12 months, marking a bullish trend with accelerating gains and a high volatility level of 41.61. It hit a peak of 259.68 and a low of 85.76.
CEVA’s stock fell 10.66% over the same period, reflecting a bearish trend despite acceleration. Volatility was low at 4.42, with a high of 34.67 and a low of 17.39.
AMD outperformed CEVA clearly, delivering the highest market returns and demonstrating stronger upward momentum throughout the year.
Target Prices
Analysts present a mixed but generally optimistic target consensus for these semiconductor companies.
| Company | Target Low | Target High | Consensus |
|---|---|---|---|
| Advanced Micro Devices, Inc. | 225 | 380 | 291.56 |
| CEVA, Inc. | 28 | 28 | 28 |
The AMD consensus target of $291.56 stands about 20% above the current $242 price, signaling growth potential despite near-term volatility. CEVA’s fixed $28 target suggests a strong upside from its current $20.7 price, reflecting bullish analyst expectations.

Don’t Let Luck Decide Your Entry Point
Optimize your entry points with our advanced ProRealTime indicators. You’ll get efficient buy signals with precise price targets for maximum performance. Start outperforming now!
How do institutions grade them?
The following tables summarize recent institutional grades for Advanced Micro Devices, Inc. and CEVA, Inc.:
Advanced Micro Devices, Inc. Grades
This table lists the latest grades assigned by reputable financial institutions to AMD:
| Grading Company | Action | New Grade | Date |
|---|---|---|---|
| Wells Fargo | Maintain | Overweight | 2026-01-30 |
| Piper Sandler | Maintain | Overweight | 2026-01-26 |
| UBS | Maintain | Buy | 2026-01-26 |
| Bernstein | Maintain | Market Perform | 2026-01-21 |
| Keybanc | Upgrade | Overweight | 2026-01-13 |
| Truist Securities | Maintain | Buy | 2025-12-19 |
| Cantor Fitzgerald | Maintain | Overweight | 2025-12-16 |
| Morgan Stanley | Maintain | Equal Weight | 2025-11-12 |
| Wedbush | Maintain | Outperform | 2025-11-12 |
| Rosenblatt | Maintain | Buy | 2025-11-12 |
CEVA, Inc. Grades
This table presents recent grades from established grading firms for CEVA:
| Grading Company | Action | New Grade | Date |
|---|---|---|---|
| Barclays | Maintain | Overweight | 2025-11-12 |
| Rosenblatt | Maintain | Buy | 2025-11-11 |
| Rosenblatt | Maintain | Buy | 2025-08-14 |
| Oppenheimer | Maintain | Outperform | 2025-05-09 |
| Rosenblatt | Maintain | Buy | 2025-05-08 |
| Barclays | Maintain | Overweight | 2025-05-08 |
| Rosenblatt | Maintain | Buy | 2025-04-23 |
| Barclays | Maintain | Overweight | 2025-02-14 |
| Rosenblatt | Maintain | Buy | 2025-02-14 |
| Rosenblatt | Maintain | Buy | 2025-02-11 |
Which company has the best grades?
AMD generally holds higher and more recent grades, including multiple “Buy” and “Overweight” ratings from top-tier firms. CEVA’s ratings remain positive but are dated earlier and cluster around “Buy” and “Overweight.” Investors may interpret AMD’s current, consistent upgrades as a stronger institutional endorsement.
Risks specific to each company
The following categories identify the critical pressure points and systemic threats facing both firms in the 2026 market environment:
1. Market & Competition
Advanced Micro Devices, Inc.
- Faces intense competition from Intel, Nvidia, and others in semiconductors, demanding constant innovation and scale.
CEVA, Inc.
- Competes in IP licensing for wireless and AI processors, vulnerable to shifts in OEM partnerships and larger incumbents.
2. Capital Structure & Debt
Advanced Micro Devices, Inc.
- Maintains favorable debt metrics with low leverage but shows weak interest coverage, signaling caution on servicing debt.
CEVA, Inc.
- Low debt-to-equity ratio signals financial prudence, but zero interest coverage ratio implies tight liquidity or earnings pressure.
3. Stock Volatility
Advanced Micro Devices, Inc.
- Beta near 1.95 shows sensitivity to market swings, typical in semiconductors but increases risk in downturns.
CEVA, Inc.
- Lower beta at 1.5 indicates less volatility but still exposed to tech sector cyclicality and innovation cycles.
4. Regulatory & Legal
Advanced Micro Devices, Inc.
- Subject to global trade restrictions, export controls, and IP litigation risks inherent to semiconductor manufacturing.
CEVA, Inc.
- Faces regulatory scrutiny on IP licensing agreements and compliance with evolving wireless technology standards.
5. Supply Chain & Operations
Advanced Micro Devices, Inc.
- Dependent on complex global supply chains, with risks from geopolitical tensions and raw material shortages.
CEVA, Inc.
- Relies on licensees’ production capabilities; indirect supply chain exposure but sensitive to OEMs’ operational disruptions.
6. ESG & Climate Transition
Advanced Micro Devices, Inc.
- Increasing pressure to reduce carbon footprint in manufacturing and improve sustainability reporting.
CEVA, Inc.
- Smaller scale limits ESG impact but growing investor focus on governance and environmental compliance.
7. Geopolitical Exposure
Advanced Micro Devices, Inc.
- High exposure to US-China tensions affecting chip exports and technology transfers.
CEVA, Inc.
- Moderate exposure through global licensing clients, with risks from trade policy shifts.
Which company shows a better risk-adjusted profile?
AMD’s greatest risk lies in its high market volatility and intense competitive pressures demanding constant innovation. CEVA’s key vulnerability is its weak profitability and liquidity, despite low leverage. AMD’s robust Altman Z-score and Piotroski score reflect stronger financial health. CEVA’s weaker scores and reliance on licensees increase its risk profile. Thus, AMD presents a better risk-adjusted profile in 2026 despite market cyclicality, supported by its scale and financial resilience.
Final Verdict: Which stock to choose?
Advanced Micro Devices, Inc. (AMD) stands out as a high-octane growth engine fueled by impressive revenue acceleration and a robust cash flow profile. Its main point of vigilance lies in declining returns on invested capital, which signals caution on capital efficiency. AMD suits portfolios aiming for aggressive growth exposure in the semiconductor space.
CEVA, Inc. offers a niche strategic moat with its specialized IP licensing model and strong balance sheet liquidity. Although it exhibits lower profitability and value destruction signs, it carries a safety edge over AMD in terms of financial stability. CEVA fits portfolios targeting GARP—growth at a reasonable price—with a readiness to weather profitability headwinds.
If you prioritize aggressive growth and market leadership in semiconductors, AMD is the compelling choice due to its superior income growth and cash generation despite capital efficiency concerns. However, if you seek steadier financial footing and a defensible niche position, CEVA offers better stability with a conservative balance sheet, albeit at the cost of profitability challenges.
Disclaimer: Investment carries a risk of loss of initial capital. The past performance is not a reliable indicator of future results. Be sure to understand risks before making an investment decision.
Go Further
I encourage you to read the complete analyses of Advanced Micro Devices, Inc. and CEVA, Inc. to enhance your investment decisions: