IonQ, Inc. is not just redefining computing; it’s pioneering a future where quantum technology transforms industries and daily lives. As a leading player in the computer hardware sector, IonQ delivers access to cutting-edge quantum computing systems, enabling groundbreaking advancements across various fields. With a strong reputation for innovation and quality, I find myself questioning whether IonQ’s current market valuation truly reflects its robust growth potential and solid fundamentals. Let’s delve into the investment possibilities this dynamic company presents.

Table of contents
Company Description
IonQ, Inc. is a pioneering player in the quantum computing sector, focused on developing general-purpose quantum computing systems. Founded in 2015 and headquartered in College Park, Maryland, the company offers access to its quantum computers equipped with 20 qubits through leading cloud platforms, including AWS, Microsoft Azure, and Google Cloud. With a market capitalization of approximately $13.88B, IonQ positions itself as a leader in the rapidly evolving tech landscape, emphasizing innovation in quantum technologies. Operating primarily in the United States, the company reflects a commitment to shaping the future of computing, driving advancements that may revolutionize industries through enhanced computational capabilities.
Fundamental Analysis
In this section, I will analyze IonQ, Inc.’s income statement, financial ratios, and dividend payout policy to assess its investment potential.
Income Statement
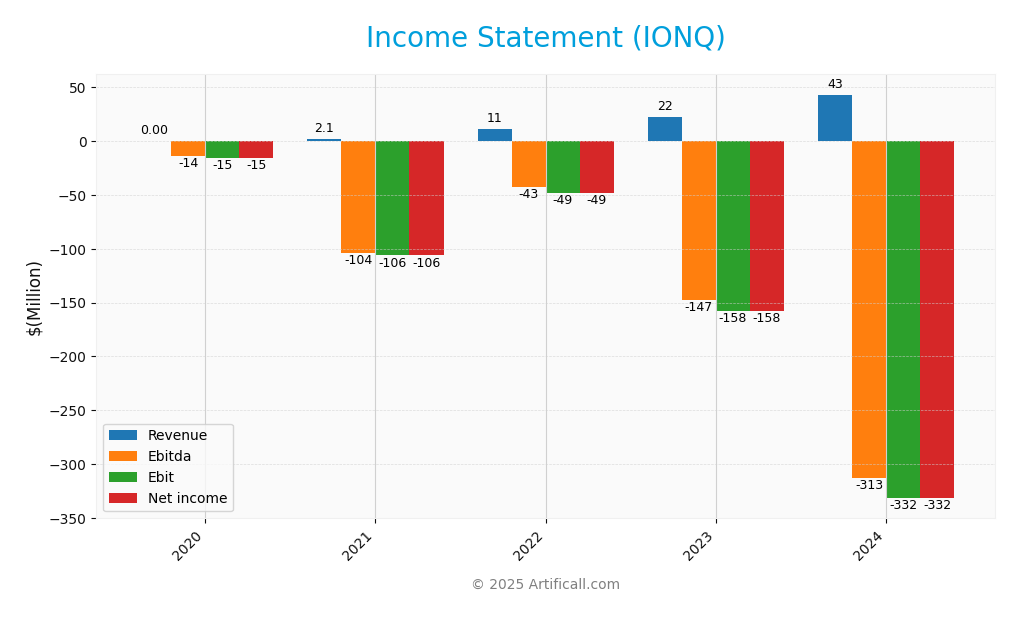
The following table summarizes the income statement for IonQ, Inc. over the past five fiscal years, providing insights into revenue, expenses, and net income.

| Metric | 2020 | 2021 | 2022 | 2023 | 2024 |
|---|---|---|---|---|---|
| Revenue | 0 | 2.1M | 11.1M | 22.0M | 43.1M |
| Cost of Revenue | 1.4M | 3.6M | 8.5M | 8.1M | 39.3M |
| Operating Expenses | 14.3M | 37.2M | 88.3M | 171.7M | 234.8M |
| Gross Profit | -1.4M | -1.5M | 2.6M | 13.9M | 3.8M |
| EBITDA | -14.0M | -103.6M | -42.9M | -147.4M | -312.9M |
| EBIT | -15.4M | -106.2M | -48.5M | -157.8M | -331.6M |
| Interest Expense | 0 | 0 | 0 | 0 | 0 |
| Net Income | -15.4M | -106.2M | -48.5M | -157.8M | -331.6M |
| EPS | -0.08 | -0.55 | -0.25 | -0.78 | -1.56 |
| Filing Date | 2021-03-25 | 2022-03-29 | 2023-03-30 | 2024-02-28 | 2025-02-26 |
Interpretation of Income Statement
Over the past five years, IonQ has experienced significant revenue growth, climbing from zero in 2020 to 43.1M in 2024. However, net income has consistently been negative, worsening from -15.4M in 2020 to -331.6M in 2024. The gross profit margin fluctuated, indicating challenges in cost management, particularly as operating expenses surged sharply. In 2024, despite increased revenue, losses deepened, suggesting that while growth is occurring, operational efficiency remains a critical area for improvement. Investors should remain cautious, as the rising expenses outweigh revenue gains, posing a risk to future profitability.
Financial Ratios
Here are the financial ratios for IonQ, Inc. over the past years.
| Metrics | 2020 | 2021 | 2022 | 2023 | 2024 |
|---|---|---|---|---|---|
| Net Margin | 0% | -50.59% | -4.36% | -7.16% | -7.70% |
| ROE | -28.72% | -17.96% | -8.54% | -32.53% | -86.40% |
| ROIC | -26.85% | -6.11% | -14.82% | -30.52% | -48.22% |
| P/E | -134.78 | -30.24 | -14.06 | -15.91 | -26.83 |
| P/B | 38.71 | 5.43 | 1.20 | 5.18 | 23.18 |
| Current Ratio | 20.51 | 54.65 | 18.43 | 10.49 | 10.50 |
| Quick Ratio | 20.51 | 54.65 | 18.18 | 10.16 | 9.98 |
| D/E | 0.079 | 0.007 | 0.007 | 0.017 | 0.046 |
| Debt-to-Assets | 7.06% | 0.66% | 0.68% | 1.46% | 3.49% |
| Interest Coverage | 0 | 0 | 0 | 0 | 0 |
| Asset Turnover | 0 | 0.003 | 0.019 | 0.040 | 0.085 |
| Fixed Asset Turnover | 0 | 0.092 | 0.374 | 0.523 | 0.692 |
| Dividend Yield | 0 | 0 | 0 | 0 | 0 |
Interpretation of Financial Ratios
Analyzing IonQ, Inc.’s financial ratios for FY 2024 reveals several concerning aspects. The company exhibits a current ratio of 10.50 and a quick ratio of 9.98, indicating strong liquidity; however, the solvency ratio is negative at -2.51, raising concerns about long-term financial stability. Profitability ratios are weak, with a net profit margin of -7.70% and an EBITDA margin of -60%, suggesting significant operational inefficiencies. The debt-to-equity ratio is low at 0.046, indicating minimal leverage, but the debt service coverage ratio is also negative, emphasizing potential cash flow issues. Overall, while liquidity appears robust, profitability and solvency issues could pose significant risks.
Evolution of Financial Ratios
Over the past five years, IonQ’s financial ratios show a troubling trend. While liquidity ratios have remained high, profitability ratios have consistently worsened, with net profit margins declining from -4.36% in 2022 to -7.70% in 2024, reflecting ongoing operational challenges.
Distribution Policy
IonQ, Inc. does not pay dividends, reflecting its focus on reinvestment for growth and innovation within the quantum computing sector. The company is likely in a high-growth phase, prioritizing research and development over shareholder payouts. IonQ also engages in share buybacks, albeit modestly. This strategy may align with long-term value creation, provided that it effectively enhances shareholder equity and capitalizes on future opportunities. However, the absence of dividends may deter income-focused investors.
Sector Analysis
IonQ, Inc. operates in the Computer Hardware industry, focusing on quantum computing systems, with competitive advantages stemming from its cloud access partnerships and innovative technology.
Strategic Positioning
IonQ, Inc. holds a significant position in the quantum computing sector, boasting a market cap of approximately $13.88B. With its innovative 20-qubit quantum systems, the company commands a competitive market share, particularly in cloud services like AWS, Microsoft Azure, and Google Cloud. Benchmarking against competitors reveals a robust technological edge, though the industry faces intense pressure from emerging players and potential disruptions in quantum technology. As the market evolves, IonQ’s ability to adapt and lead will be crucial for maintaining its strategic advantage.
Key Products
IonQ, Inc. focuses on developing advanced quantum computing systems. Below is a table summarizing some of their key products:
| Product | Description |
|---|---|
| IonQ Quantum Computer | A general-purpose quantum computer featuring 20 qubits, designed for complex computational tasks. |
| Quantum Cloud Access | A service providing access to IonQ’s quantum computers via cloud platforms like AWS and Azure. |
| Quantum Software Toolkit | A set of tools and libraries for developers to build and run quantum algorithms and applications. |
| Quantum Simulation Platform | A platform that allows users to simulate quantum circuits and algorithms before running them on actual hardware. |
| Quantum Education Programs | Training and resources for developers and researchers to understand and implement quantum computing concepts. |
These products position IonQ as a leader in the emerging field of quantum computing, catering to diverse applications across various industries.
Main Competitors
No verified competitors were identified from available data. IonQ, Inc. is currently positioned in the competitive landscape of quantum computing, focusing on developing general-purpose quantum computing systems. The company holds a significant market share in the technology sector, leveraging cloud platforms for access to its quantum computers.
Competitive Advantages
IonQ, Inc. holds a significant edge in the rapidly evolving quantum computing sector. With its advanced 20-qubit quantum computing systems, the company is at the forefront of providing cloud-based access through major platforms like AWS, Microsoft Azure, and Google Cloud. This strategic positioning not only enhances its market reach but also opens avenues for collaboration and innovation. Looking ahead, IonQ plans to expand its product offerings and target new markets, capitalizing on the increasing demand for quantum solutions across various industries, which could substantially boost its growth potential in the coming years.
SWOT Analysis
The purpose of this analysis is to identify the strengths, weaknesses, opportunities, and threats that IonQ, Inc. faces in the current market environment.
Strengths
- Leading in quantum computing
- Strong partnerships with major cloud platforms
- Innovative technology
Weaknesses
- High volatility in stock price
- Limited consumer awareness
- Dependence on cloud service revenues
Opportunities
- Growing demand for quantum computing solutions
- Expansion into new markets
- Potential for strategic collaborations
Threats
- Intense competition in the tech sector
- Regulatory challenges
- Rapid technological changes
The overall SWOT assessment suggests that IonQ, Inc. is well-positioned to leverage its strengths and opportunities while addressing its weaknesses and potential threats. This balanced approach could enhance its strategic initiatives and mitigate risks in the competitive landscape.
Stock Analysis
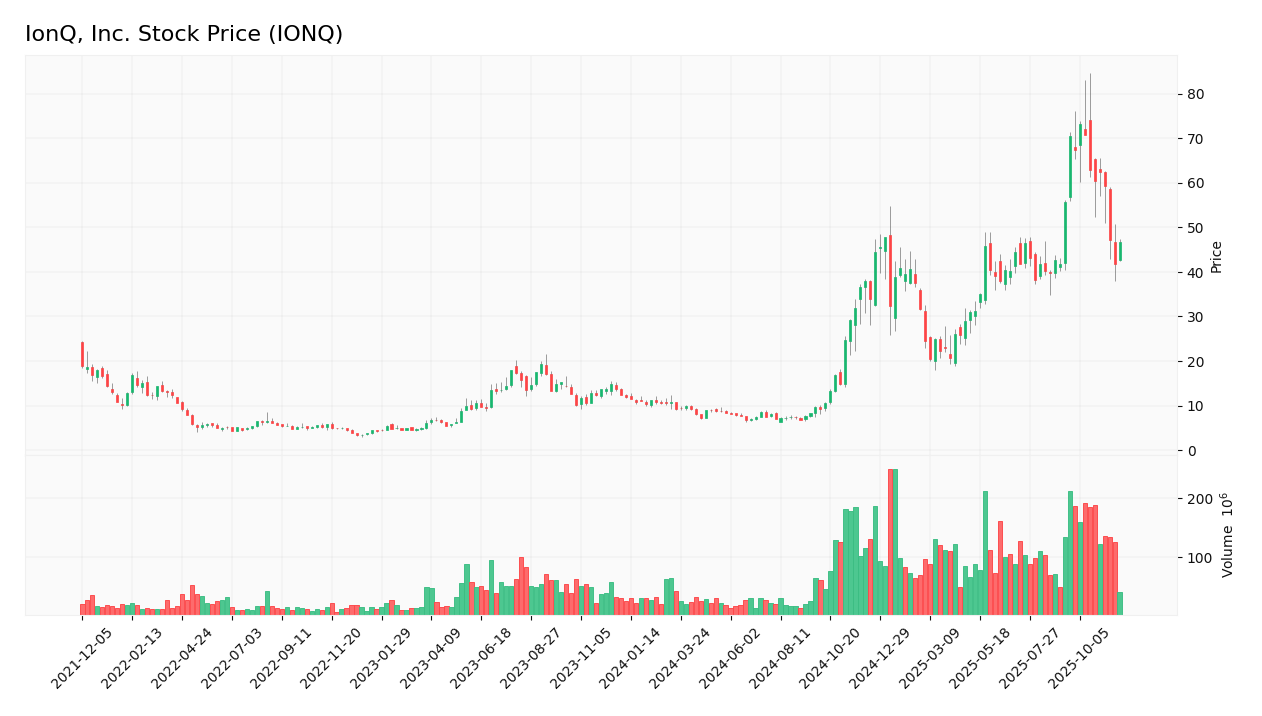
IonQ, Inc. has experienced significant price movements over the past year, highlighted by a remarkable increase of 289.67%. This bullish trend indicates strong investor interest, despite a recent downturn that has raised questions about future performance.

Trend Analysis
Over the past two years, IonQ’s stock has demonstrated a bullish trend with a percentage change of +289.67%. Despite this strong overall increase, the recent trend from September 14, 2025, to November 30, 2025, shows a decline of -15.91%. This negative variation indicates a bearish trend in the short term, suggesting some volatility in investor sentiment. The highest price recorded during this period was 73.28, while the lowest was 6.76. Notably, the overall trend demonstrates a deceleration, indicating that while the stock has surged significantly, recent momentum may be waning.
Volume Analysis
In the last three months, trading volumes have reached a total of 9.26B shares, with buyer-driven activity accounting for approximately 52.78% of the trades. Volume is currently increasing, although recent activity has shifted to being seller-dominant, with only 36.82% of the last three months’ volume coming from buyers. This shift suggests a potential cooling of bullish sentiment among investors, indicating that market participation may be more cautious moving forward.
Analyst Opinions
Recent analyst recommendations for IonQ, Inc. (IONQ) indicate a cautious stance, with a consensus rating of “sell.” The overall score is a low C-, primarily due to weak financial metrics such as a return on equity and price-to-earnings ratio, both rated at 1. Analysts highlight concerns regarding the company’s debt-to-equity ratio, which received a better score of 3, suggesting some stability. Given these factors, I would advise caution for investors considering IONQ in their portfolios.
Stock Grades
IonQ, Inc. (IONQ) has garnered consistent ratings from reputable grading companies, reflecting a stable outlook among analysts. Below is a summary of recent stock grades:
| Grading Company | Action | New Grade | Date |
|---|---|---|---|
| Benchmark | Maintain | Buy | 2024-08-12 |
| Goldman Sachs | Maintain | Neutral | 2024-08-09 |
| Craig-Hallum | Maintain | Buy | 2024-08-08 |
| Needham | Maintain | Buy | 2024-05-16 |
| Needham | Maintain | Buy | 2024-05-09 |
| Goldman Sachs | Maintain | Neutral | 2024-02-29 |
| Needham | Maintain | Buy | 2024-02-29 |
| Morgan Stanley | Maintain | Equal Weight | 2023-10-30 |
| Needham | Maintain | Buy | 2023-09-20 |
| Needham | Maintain | Buy | 2023-09-19 |
The overall trend indicates that IonQ has maintained strong buy ratings from several analysts, particularly from Needham, while Goldman Sachs has taken a more cautious stance with neutral ratings. This suggests a general confidence in IonQ’s potential, balanced by some market hesitance.
Target Prices
Analysts have reached a consensus on target prices for IonQ, Inc. (IONQ).
| Target High | Target Low | Consensus |
|---|---|---|
| 75 | 55 | 64.5 |
The target prices indicate a positive outlook, with a consensus suggesting a potential for growth in IonQ’s stock value.
Consumer Opinions
Consumer sentiment surrounding IonQ, Inc. indicates a blend of enthusiasm and skepticism, reflecting the evolving perceptions of the quantum computing landscape.
| Positive Reviews | Negative Reviews |
|---|---|
| “IonQ’s technology is ahead of its time.” | “High pricing limits accessibility.” |
| “Exceptional customer support.” | “Still in early development stages.” |
| “Innovative solutions for complex problems.” | “Competitors are catching up quickly.” |
Overall, consumer feedback highlights IonQ’s advanced technology and strong support services as key strengths, while concerns about pricing and competition from other firms present notable weaknesses.
Risk Analysis
In evaluating IonQ, Inc. (ticker: IONQ), it’s critical to consider various risks that could impact the company’s performance.
| Category | Description | Probability | Impact |
|---|---|---|---|
| Market Risk | Fluctuations in demand for quantum computing | High | High |
| Technology Risk | Rapid advancements in competing technologies | Medium | High |
| Regulatory Risk | Changes in government policies affecting tech | Medium | Medium |
| Financial Risk | Dependency on funding and investment | High | Medium |
| Operational Risk | Challenges in scaling production and delivery | Medium | High |
IonQ faces significant market risk due to increasing competition in quantum computing, with the potential for high impact if demand shifts. Recent investments in the sector highlight the urgency for IonQ to maintain its competitive edge.
Should You Buy IonQ, Inc.?
IonQ, Inc. has reported a negative net margin of -7.70%, indicating a lack of profitability. The company holds a low debt level with a debt-to-equity ratio of 0.046, suggesting a manageable financial structure. Over time, the company has shown a substantial revenue increase of 73.36%, although it continues to face significant operating losses. The current rating for IonQ is C-, reflecting concerns about its financial performance.
Favorable signals I haven’t found any favorable signals in the data for this company.
Unfavorable signals The company has a negative net margin of -7.70%, which highlights its ongoing struggle to generate profit. Additionally, the long-term trend for the stock is bearish, with a recent price change of -15.91%, indicating a negative momentum in the market. The recent seller volume surpassing buyer volume suggests that sellers are currently dominating the market.
Conclusion Given the negative net margin, the ongoing bearish trend, and the presence of seller dominance, it would be prudent to wait for more favorable conditions before considering any investment in IonQ, Inc.
Additional Resources
- Will IonQ Be a $1 Trillion Company 10 Years From Now? – The Motley Fool (Nov 23, 2025)
- Mirion, Jacobs Solutions, Planet Labs, Dell, and IonQ Shares Skyrocket, What You Need To Know – Yahoo Finance (Nov 24, 2025)
- This Is the Biggest Risk to Quantum Computing Stocks IonQ, Rigetti Computing, and D-Wave Quantum, and It’s Gone Virtually Undetected by Investors – Nasdaq (Nov 24, 2025)
- IonQ’s Steep Selloff: Why Quantum Computing Stock Is Being Hammered? – Trefis (Nov 21, 2025)
- Scott Millard Named IonQ’s New Chief Business Officer – IonQ (Nov 19, 2025)
For more information about IonQ, Inc., please visit the official website: ionq.com


