Home > Analyses > Technology > Nutanix, Inc.
Nutanix, Inc. is reshaping the enterprise cloud landscape by delivering seamless hybrid and multi-cloud infrastructure that powers modern business operations worldwide. Renowned for its innovative Acropolis platform and comprehensive cloud solutions, Nutanix leads the infrastructure software industry with a reputation for reliability and cutting-edge technology. As cloud adoption accelerates, I explore whether Nutanix’s robust product suite and market influence continue to support its valuation and growth prospects in a competitive sector.
Table of contents
Business Model & Company Overview
Nutanix, Inc., founded in 2009 and headquartered in San Jose, California, stands as a leading player in the software infrastructure industry. Its core mission revolves around delivering an integrated enterprise cloud platform that unifies virtualization, storage, and networking services into a streamlined ecosystem. This cohesive approach supports a broad range of industries, from healthcare to telecommunications, enhancing operational efficiency across multiple markets.
The company generates revenue by balancing hardware-enabled solutions with robust software offerings and recurring services, including virtualization, cloud governance, and database automation. Nutanix maintains a strategic footprint across the Americas, Europe, and Asia Pacific, capitalizing on global demand for hybrid and multi-cloud environments. Its competitive advantage lies in a scalable platform that shapes the future of enterprise cloud computing with a durable economic moat rooted in innovation and customer reliance.
Financial Performance & Fundamental Metrics
In this section, I analyze Nutanix, Inc.’s income statement, key financial ratios, and dividend payout policy to assess its overall financial health and investment potential.
Income Statement
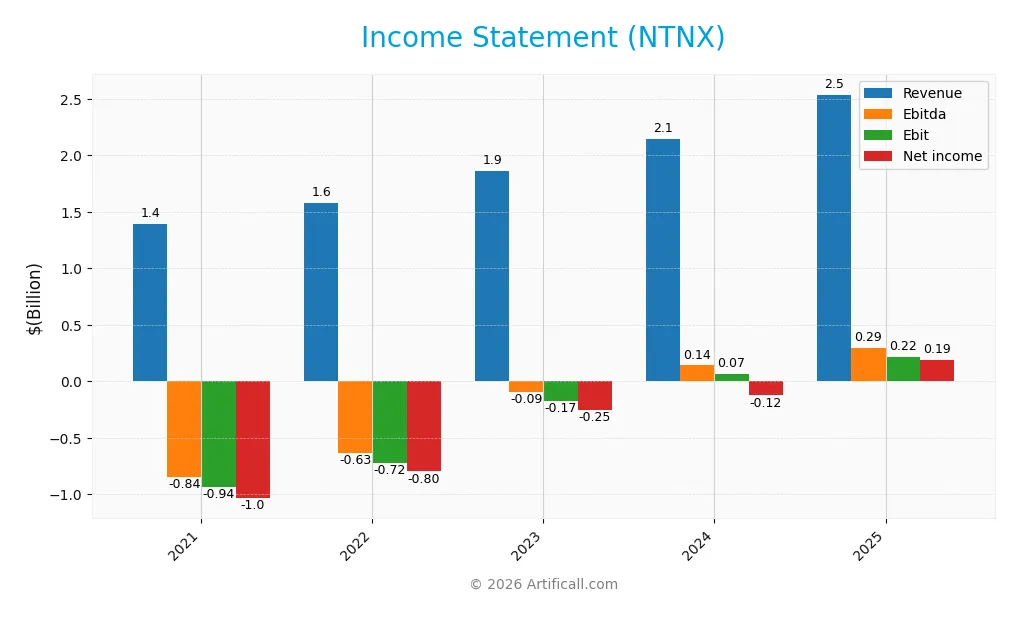
The table below summarizes Nutanix, Inc.’s income statement figures for fiscal years 2021 through 2025, showing key financial metrics in USD.
| 2021 | 2022 | 2023 | 2024 | 2025 | |
|---|---|---|---|---|---|
| Revenue | 1.39B | 1.58B | 1.86B | 2.15B | 2.54B |
| Cost of Revenue | 292M | 321M | 332M | 324M | 335M |
| Operating Expenses | 1.76B | 1.72B | 1.74B | 1.82B | 2.03B |
| Gross Profit | 1.10B | 1.26B | 1.53B | 1.82B | 2.20B |
| EBITDA | -843M | -631M | -93M | 141M | 293M |
| EBIT | -937M | -719M | -169M | 68M | 220M |
| Interest Expense | 80M | 61M | 64M | 169M | 20M |
| Net Income | -1.03B | -798M | -255M | -125M | 188M |
| EPS | -5.01 | -3.62 | -1.09 | -0.51 | 0.70 |
| Filing Date | 2021-09-21 | 2023-05-24 | 2023-09-21 | 2024-09-19 | 2025-09-24 |
Income Statement Evolution
Nutanix, Inc. showed strong revenue growth of 18.11% in 2025, continuing an overall increase of 82.01% since 2021. Net income improved substantially, rising 118.21% over the period, with a notable turnaround from losses in earlier years to a positive net margin of 7.42%. Gross margin remained high and favorable at 86.81%, while EBIT margin was stable and neutral at 8.67%.
Is the Income Statement Favorable?
In 2025, Nutanix reported $2.54B in revenue and $188M in net income, reflecting significant profitability gains. Margins improved, with a favorable net margin and low interest expense of 0.78% of revenue. EBIT grew by 223.27% year-over-year, underlining operational progress. Overall, the income statement fundamentals appear favorable, supported by strong margin performance and consistent revenue expansion.
Financial Ratios
The following table presents key financial ratios for Nutanix, Inc. over the fiscal years 2021 to 2025, illustrating profitability, liquidity, leverage, efficiency, and dividend metrics:
| Ratios | 2021 | 2022 | 2023 | 2024 | 2025 |
|---|---|---|---|---|---|
| Net Margin | -74% | -50% | -14% | -6% | 7% |
| ROE | 102% | 100% | 36% | 17% | -27% |
| ROIC | -47% | -33% | -15% | 1% | 8% |
| P/E | -7.2 | -4.2 | -27.7 | -99.1 | 107 |
| P/B | -7.3 | -4.2 | -10 | -17 | -29 |
| Current Ratio | 1.56 | 1.33 | 1.53 | 1.06 | 1.72 |
| Quick Ratio | 1.56 | 1.33 | 1.53 | 1.06 | 1.72 |
| D/E | -1.18 | -1.80 | -1.88 | -0.95 | -2.14 |
| Debt-to-Assets | 52% | 61% | 53% | 32% | 45% |
| Interest Coverage | -8.3 | -7.6 | -3.2 | 0.04 | 8.7 |
| Asset Turnover | 0.61 | 0.67 | 0.74 | 1.00 | 0.77 |
| Fixed Asset Turnover | 5.9 | 6.8 | 9.1 | 8.8 | 9.2 |
| Dividend Yield | 0% | 0% | 0% | 0% | 0% |
Evolution of Financial Ratios
From 2021 to 2025, Nutanix, Inc. exhibited fluctuating trends in key financial ratios. The Return on Equity (ROE) showed volatility, peaking positively in 2023 but dropping sharply to -27.12% in 2025, indicating declining profitability. The Current Ratio improved steadily, reaching 1.72 in 2025, reflecting better short-term liquidity. The Debt-to-Equity Ratio remained negative but improved to -2.14 by 2025, suggesting changes in capital structure and leverage.
Are the Financial Ratios Favorable?
In 2025, Nutanix’s financial ratios present a mixed picture. Profitability is neutral with a 7.42% net margin but unfavorable ROE at -27.12%. Liquidity ratios, including a current ratio and quick ratio of 1.72, are favorable, indicating good short-term financial health. Leverage measures show a favorable negative debt-to-equity ratio and neutral debt-to-assets ratio of 45.16%. Market valuation ratios are mixed, with a high, unfavorable P/E of 106.74 and favorable negative Price-to-Book. Overall, half of the ratios are favorable, supporting a slightly favorable financial standing.
Shareholder Return Policy
Nutanix, Inc. (NTNX) does not pay dividends, reflecting a reinvestment strategy likely aimed at supporting growth and innovation. The company maintains positive net income in 2025, but historical losses suggest prioritization of R&D and acquisitions over shareholder payouts.
No share buyback program is indicated. This approach aligns with sustaining long-term value creation by focusing on operational improvements and free cash flow generation rather than immediate shareholder distributions.
Score analysis
The following radar chart presents a summary of Nutanix, Inc.’s key financial scores across valuation and performance metrics:
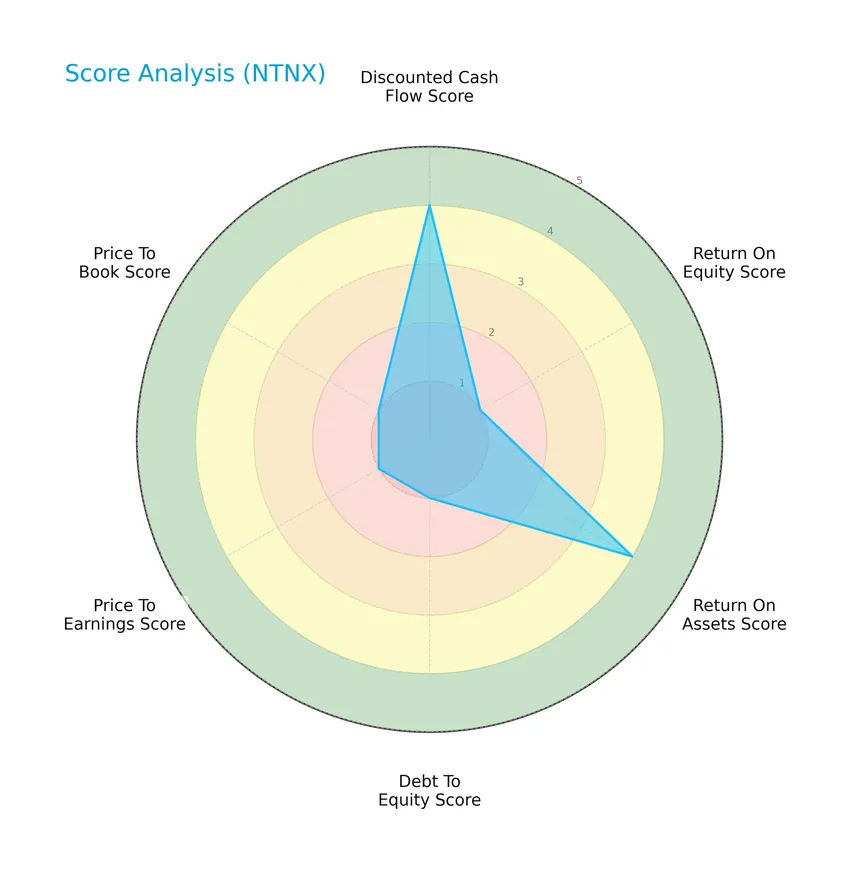
Nutanix shows a mixed financial profile with favorable scores in discounted cash flow (4) and return on assets (4), contrasted by very unfavorable scores in return on equity (1), debt to equity (1), price to earnings (1), and price to book (1). Overall, the score is moderate at 2.
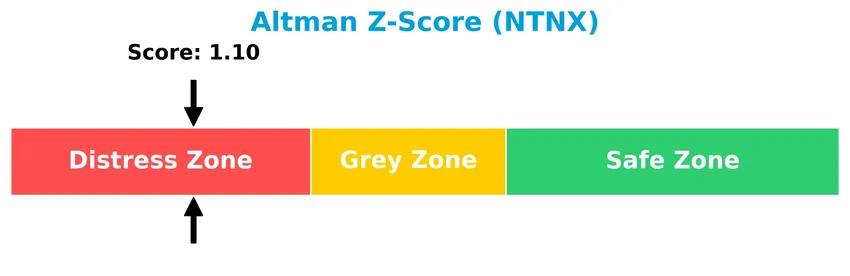
Analysis of the company’s bankruptcy risk
Nutanix’s Altman Z-Score of approximately 1.10 places the company in the distress zone, indicating a high risk of financial distress and potential bankruptcy:
Is the company in good financial health?
The Piotroski F-Score diagram illustrates Nutanix’s financial strength based on nine accounting criteria:

With a Piotroski Score of 6, Nutanix is considered to have average financial health, reflecting moderate operational efficiency and profitability relative to stronger firms.
Competitive Landscape & Sector Positioning
This sector analysis will examine Nutanix, Inc.’s strategic positioning, revenue by segment, key products, main competitors, and competitive advantages. I will assess whether Nutanix holds a competitive advantage over its rivals in the software infrastructure industry.
Strategic Positioning
Nutanix, Inc. operates a diversified product portfolio centered on subscription services, professional services, and non-subscription products, with subscription revenue reaching $2B in FY 2024. Geographically, it maintains broad exposure across North America, EMEA, Asia Pacific, Latin America, and Africa, with the US representing the largest market at $1.19B in FY 2024.
Revenue by Segment
This pie chart presents Nutanix, Inc.’s revenue distribution by product and service segments for the fiscal year 2024, illustrating how different revenue streams contribute to the overall business.
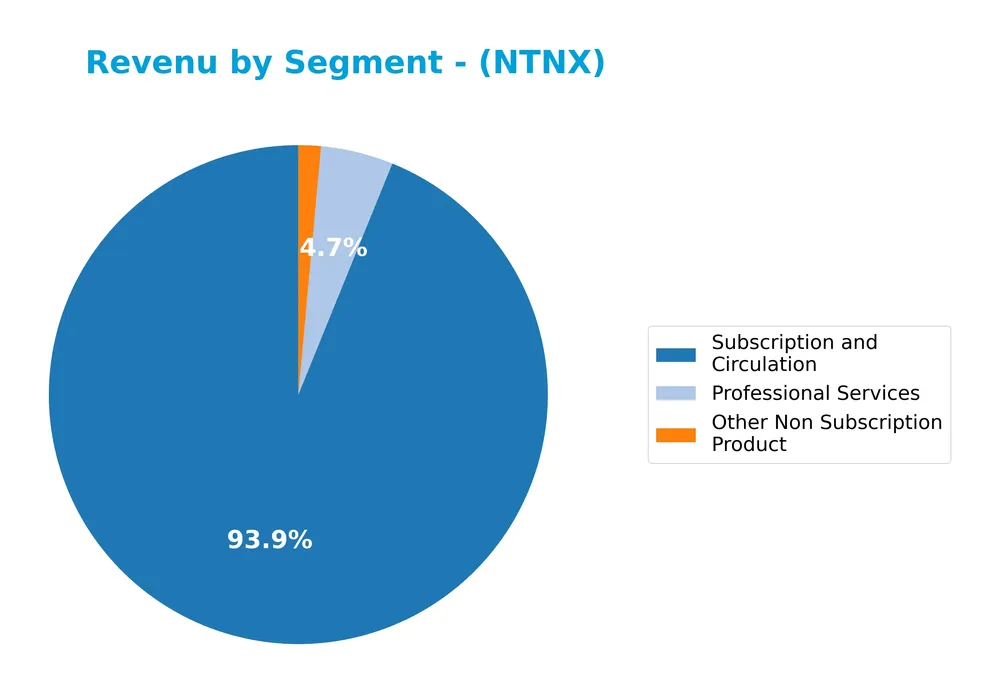
In 2024, Nutanix’s revenue is heavily concentrated in the Subscription and Circulation segment, generating $2B, which clearly drives the business forward. Professional Services contributed $101M, while Other Non-Subscription Products accounted for about $31M. Comparing to prior years, there is a clear shift from the traditional Product and Service categories towards subscription-based revenue, reflecting an ongoing transition to recurring revenue models with potential concentration risk but also stable cash flow prospects.
Key Products & Brands
The following table presents Nutanix, Inc.’s main products and brands along with their descriptions:
| Product | Description |
|---|---|
| Acropolis | Converged virtualization platform offering enterprise storage, networking visualization, and security. |
| Acropolis Hypervisor | Enterprise-grade virtualization solution. |
| Nutanix Karbon | Automated deployment and management of Kubernetes clusters for cloud-native environments. |
| Nutanix Clusters | Hybrid cloud orchestration solution. |
| Prism Pro | Management tool for infrastructure and operations. |
| Nutanix Beam | Cloud governance service. |
| Nutanix Calm | Application marketplace providing automation for application lifecycle management. |
| Nutanix Files | Enterprise-grade NFS and SMB file services. |
| Nutanix Objects | S3-compatible object storage service. |
| Nutanix Era | Database automation and database-as-a-service solution. |
| Nutanix Frame | Desktop-as-a-service product delivering virtual apps and desktops from public and private clouds. |
| Professional Services | Consulting and implementation services supporting product deployment and integration. |
| Subscription and Circulation | Recurring revenue from software subscriptions and related services. |
| Other Non Subscription Product | Additional product offerings outside subscription models. |
Nutanix’s product portfolio focuses on enterprise cloud platforms and hybrid cloud solutions, emphasizing virtualization, cloud-native management, and automation services, supported by professional and subscription-based services.
Main Competitors
In the Technology sector’s Software – Infrastructure industry, 32 competitors are identified, with the top 10 leaders by market capitalization listed below:
| Competitor | Market Cap. |
|---|---|
| Microsoft Corporation | 3.52T |
| Oracle Corporation | 553B |
| Palantir Technologies Inc. | 383B |
| Adobe Inc. | 140B |
| Palo Alto Networks, Inc. | 120B |
| CrowdStrike Holdings, Inc. | 113B |
| Synopsys, Inc. | 92B |
| Cloudflare, Inc. | 69B |
| Fortinet, Inc. | 59B |
| Block, Inc. | 40B |
Nutanix, Inc. ranks 22nd among 32 competitors, with a market cap just 0.33% of the leader, Microsoft Corporation. The company sits below both the average market cap of the top 10 competitors (508B) and the median market cap of the sector (18.8B). It maintains a significant 26.58% market cap gap to the next competitor directly above it, indicating a notable distance in scale within the competitive landscape.
Comparisons with competitors
Check out how we compare the company to its competitors:
Does Nutanix have a competitive advantage?
Nutanix, Inc. demonstrates a durable competitive advantage, evidenced by its ROIC exceeding WACC by over 2%, indicating value creation and efficient capital use. The company’s profitability and income statement metrics are largely favorable, supporting this competitive position.
Looking ahead, Nutanix’s diverse enterprise cloud platform offerings, including virtualization, Kubernetes management, and hybrid cloud orchestration, position it well for growth across multiple global markets. Expanding product suites and geographic reach in North America, EMEA, and Asia Pacific offer ongoing opportunities.
SWOT Analysis
This SWOT analysis highlights Nutanix, Inc.’s key internal strengths and weaknesses alongside external opportunities and threats to guide investment decisions.
Strengths
- strong revenue growth (18% YoY)
- high gross margin (87%)
- durable competitive advantage with growing ROIC
Weaknesses
- high PE ratio (107) indicating overvaluation
- negative ROE (-27%) signaling profitability issues
- Altman Z-score in distress zone (1.1)
Opportunities
- expanding cloud infrastructure market
- growth in hybrid cloud and Kubernetes adoption
- geographic expansion in EMEA and Asia Pacific
Threats
- intense competition in cloud software
- rapid technological change
- macroeconomic uncertainty affecting IT spending
Overall, Nutanix demonstrates robust growth and a solid market position with increasing profitability, but faces valuation concerns and profitability challenges. Investors should weigh growth potential against financial risks and market volatility in their strategy.
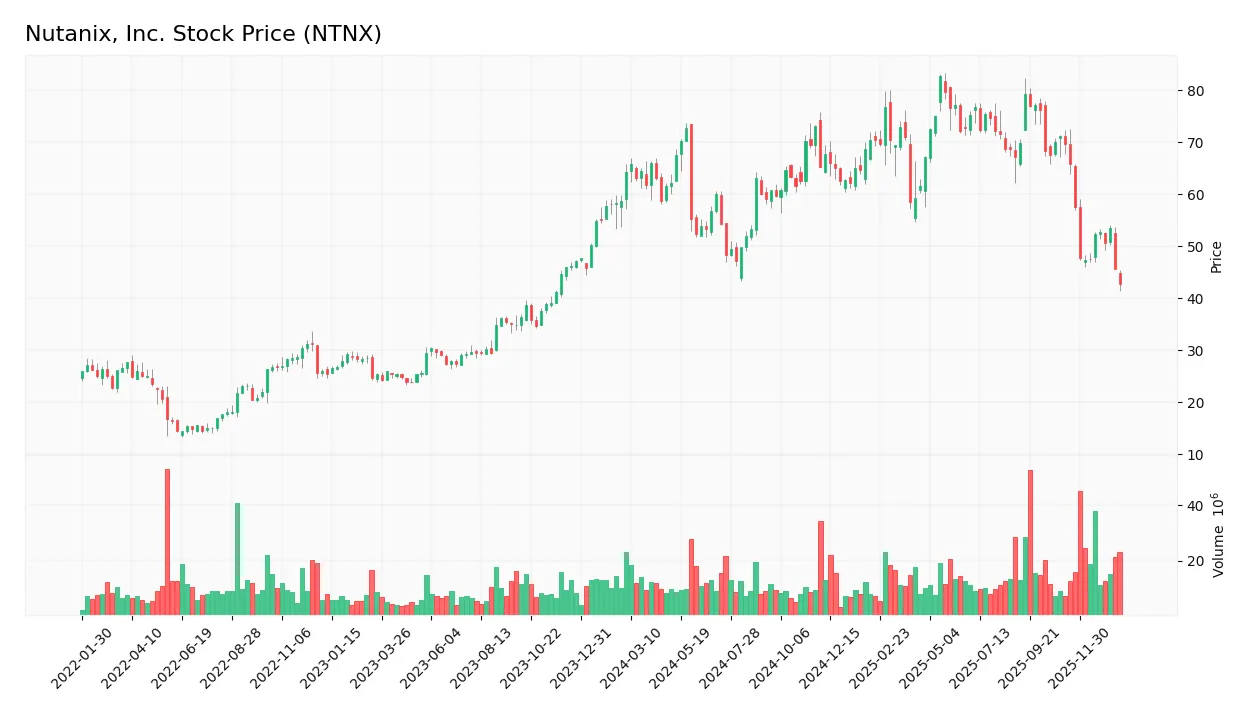
Stock Price Action Analysis
The weekly chart of Nutanix, Inc. (NTNX) illustrates price movements and volatility over the recent 12-week period:
Trend Analysis
Over the past 12 weeks, NTNX stock declined by 33.52%, indicating a bearish trend. The price moved from a high of 82.77 to a low of 42.81 with a deceleration in the downward momentum. Volatility is moderate with a standard deviation of 8.92, reflecting consistent selling pressure without sharp fluctuations.
Volume Analysis
In the last three months, trading volume has been increasing, with buyers accounting for 50.89% of the total 1.62B shares traded, suggesting balanced but slightly buyer-favored activity overall. However, the recent 12-week period shows seller dominance at 66.23%, highlighting increased selling pressure and cautious investor sentiment.
Target Prices
The consensus target prices for Nutanix, Inc. indicate a moderately optimistic outlook among analysts.
| Target High | Target Low | Consensus |
|---|---|---|
| 90 | 53 | 64.67 |
Analysts expect Nutanix’s stock price to range between $53 and $90, with an average target near $65, reflecting cautious optimism about its growth potential.

Don’t Let Luck Decide Your Entry Point
Optimize your entry points with our advanced ProRealTime indicators. You’ll get efficient buy signals with precise price targets for maximum performance. Start outperforming now!
Analyst & Consumer Opinions
This section examines the latest analyst ratings and consumer feedback concerning Nutanix, Inc. (NTNX) performance.
Stock Grades
Here is a summary of recent stock grades for Nutanix, Inc. from recognized financial institutions showing changes and current stances:
| Grading Company | Action | New Grade | Date |
|---|---|---|---|
| Barclays | Downgrade | Equal Weight | 2026-01-15 |
| Morgan Stanley | Downgrade | Equal Weight | 2026-01-12 |
| RBC Capital | Maintain | Outperform | 2026-01-05 |
| Goldman Sachs | Maintain | Buy | 2025-11-28 |
| JP Morgan | Maintain | Overweight | 2025-11-26 |
| Keybanc | Maintain | Overweight | 2025-11-26 |
| Needham | Maintain | Buy | 2025-11-26 |
| Wells Fargo | Maintain | Equal Weight | 2025-11-26 |
| Morgan Stanley | Maintain | Overweight | 2025-11-26 |
| B of A Securities | Maintain | Buy | 2025-11-26 |
The overall trend shows a slight recent shift with Barclays and Morgan Stanley downgrading from Overweight to Equal Weight early in 2026, while other firms have maintained Buy or Overweight ratings, reflecting mixed but generally positive sentiment toward Nutanix.
Consumer Opinions
Consumer sentiment around Nutanix, Inc. (NTNX) reflects a mix of appreciation for its innovation and concerns over certain service aspects.
| Positive Reviews | Negative Reviews |
|---|---|
| Intuitive software platform enhances cloud management efficiency. | Customer support response times can be slow during peak periods. |
| Strong integration capabilities with existing IT infrastructure. | Occasional bugs reported after updates impact workflow temporarily. |
| Scalable solutions suitable for growing enterprises. | Pricing structure may be complex for smaller businesses. |
Overall, consumers praise Nutanix for its robust and scalable cloud solutions, though they express frustration with customer service delays and some pricing challenges. These insights suggest solid product value but room for improvement in user support.
Risk Analysis
Below is a table summarizing key risks facing Nutanix, Inc. based on financial and market data as of 2026:
| Category | Description | Probability | Impact |
|---|---|---|---|
| Financial Stability | Altman Z-Score at 1.10 indicates high bankruptcy risk (distress zone). | High | High |
| Profitability | Negative ROE (-27.12%) and high P/E (106.74) signal weak profitability and valuation risk. | High | High |
| Leverage & Debt | Debt to assets at 45.16% with negative debt-to-equity ratio suggests complex capital structure. | Medium | Medium |
| Market Volatility | Low beta (0.49) implies lower stock price volatility but limited upside in volatile markets. | Medium | Low |
| Dividend Policy | No dividend yield poses risk for income-focused investors. | High | Medium |
| Operational Efficiency | Neutral net margin (7.42%) and asset turnover (0.77) reflect moderate operational risks. | Medium | Medium |
The most pressing risks are financial distress and poor profitability. The Altman Z-Score firmly places Nutanix in the distress zone, highlighting bankruptcy risk. Coupled with an unfavorable return on equity and a very high price-to-earnings ratio, these factors emphasize caution. Investors should weigh these risks carefully despite favorable liquidity and some operational strengths.
Should You Buy Nutanix, Inc.?
Nutanix, Inc. appears to be generating value with a durable competitive moat supported by growing ROIC, yet it faces a challenging leverage profile and mixed profitability signals. Despite a moderate Piotroski score, the overall rating could be seen as C+, suggesting cautious investor consideration.
Strength & Efficiency Pillars
Nutanix, Inc. exhibits commendable value creation with a return on invested capital (ROIC) of 8.11% surpassing its weighted average cost of capital (WACC) at 5.9%, confirming its status as a value creator. The company’s gross margin stands at an impressive 86.81%, underscoring operational efficiency, while its net margin of 7.42% further supports profitability. Favorable liquidity, evidenced by a current ratio of 1.72 and a strong interest coverage ratio of 11.15, complements its financial health. Though its Altman Z-Score of 1.1 indicates distress zone risk, the Piotroski score of 6 suggests average financial strength, balancing concerns with moderate stability.
Weaknesses and Drawbacks
The investment case is tempered by several unfavorable metrics. Nutanix’s price-to-earnings (P/E) ratio is extremely elevated at 106.74, signaling a premium valuation that may expose investors to downside risk if earnings fail to meet expectations. Its return on equity (ROE) is negative at -27.12%, highlighting challenges in generating shareholder returns. While debt-to-equity is reported as -2.14, suggesting an unusual capital structure or accounting anomaly, the company’s bearish stock trend with a recent 38.5% price decline and seller dominance (only 33.77% buyer volume) reflects significant market pressure and short-term headwinds.
Our Verdict about Nutanix, Inc.
Nutanix presents a fundamentally favorable long-term profile as a value creator with strong margins and improving ROIC trends. However, the bearish technical trend and seller dominance in the recent period suggest caution. Despite its durable competitive advantage, the premium valuation and negative ROE imply that investors might consider a wait-and-see approach for a more attractive entry point before increasing exposure.
Disclaimer: This content is for informational purposes only and does not constitute financial, investment, or other professional advice. Investing in financial markets involves a significant risk of loss, and past performance is not indicative of future results.
Additional Resources
- Kaplan Fox Announces an Investigation Into Nutanix, Inc. (NTNX) for Potential Securities Law Violations – FinancialContent (Jan 24, 2026)
- NUTANIX INVESTIGATION ALERT: Bragar Eagel & Squire, P.C. is – GlobeNewswire (Jan 24, 2026)
- Rosen Law Firm Encourages Nutanix, Inc. Investors to Inquire About Securities Class Action Investigation – NTNX – Business Wire (Jan 23, 2026)
- INVESTOR ALERT: Pomerantz Law Firm Investigates Claims On Behalf of Investors of Nutanix, Inc. – NTNX – Sahm (Jan 22, 2026)
- Nutanix Inc (NTNX) Trading Down 3.21% on Jan 20 – GuruFocus (Jan 20, 2026)
For more information about Nutanix, Inc., please visit the official website: nutanix.com