Home > Comparison > Technology > PANW vs FTNT
The strategic rivalry between Palo Alto Networks, Inc. and Fortinet, Inc. shapes the cybersecurity infrastructure sector’s evolution. Palo Alto Networks operates as a cloud-centric, subscription-driven cybersecurity leader. Fortinet combines hardware and software solutions, emphasizing integrated network security. This battle highlights differing operational models amid a race for market dominance and innovation. This analysis aims to identify which company offers a superior risk-adjusted investment profile for a diversified portfolio in 2026.
Table of contents
Companies Overview
Palo Alto Networks and Fortinet dominate the cybersecurity software infrastructure landscape with distinct approaches.
Palo Alto Networks, Inc.: Cybersecurity Innovator
Palo Alto Networks leads in cybersecurity infrastructure with a focus on firewall appliances and software. It generates revenue through subscription services like threat prevention, cloud security, and threat intelligence. In 2026, its strategy emphasizes cloud security, secure access, and automation to counter evolving cyber threats across enterprise and government sectors.
Fortinet, Inc.: Integrated Security Solutions Provider
Fortinet specializes in broad, automated cybersecurity with hardware and software licenses covering firewalls, endpoint protection, and secure networking. Its revenue comes from FortiGate products and security subscriptions. The 2026 strategy targets integrated security solutions with centralized management and machine-learning endpoint defense for diverse industries worldwide.
Strategic Collision: Similarities & Divergences
Both firms compete in cybersecurity but diverge in approach: Palo Alto Networks pursues a cloud-centric, software-driven model, while Fortinet offers a hardware-integrated, broad product suite. Their primary battleground is enterprise network defense and cloud security. Investors face contrasting profiles: Palo Alto Networks bets on innovation and automation; Fortinet plays scale and integration.
Income Statement Comparison
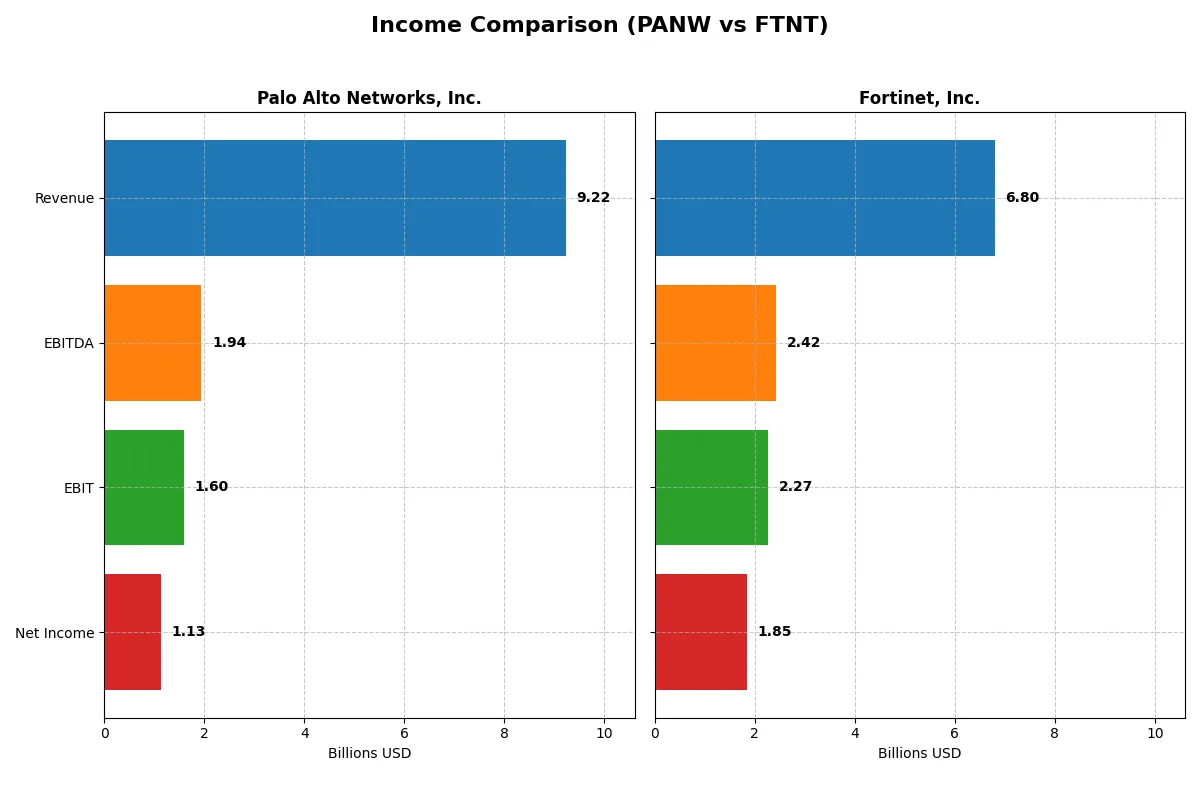
This data dissects the core profitability and scalability of both corporate engines to reveal who dominates the bottom line:
| Metric | Palo Alto Networks, Inc. (PANW) | Fortinet, Inc. (FTNT) |
|---|---|---|
| Revenue | 9.22B | 6.80B |
| Cost of Revenue | 2.45B | 1.30B |
| Operating Expenses | 5.53B | 3.42B |
| Gross Profit | 6.77B | 5.50B |
| EBITDA | 1.94B | 2.42B |
| EBIT | 1.60B | 2.27B |
| Interest Expense | 3.0M | 20.1M |
| Net Income | 1.13B | 1.85B |
| EPS | 1.71 | 2.44 |
| Fiscal Year | 2025 | 2025 |
Income Statement Analysis: The Bottom-Line Duel
This income statement comparison reveals which company runs its financial engine with superior efficiency and momentum over recent years.
Palo Alto Networks, Inc. Analysis
Palo Alto Networks grew revenue from 4.3B in 2021 to 9.2B in 2025, with net income turning positive after early losses. Its gross margin holds strong near 73%, and EBIT margin rose sharply to 17.3% in 2025. Despite a one-year dip in net margin and EPS, the company shows robust long-term growth and improving profitability momentum.
Fortinet, Inc. Analysis
Fortinet’s revenue more than doubled from 3.3B in 2021 to 6.8B in 2025, consistently delivering solid net income growth. Its gross margin outperforms at 80.8%, with an impressive EBIT margin of 33.4% in 2025. Fortinet maintains stable net margin near 27%, reflecting efficient cost management and steady earnings expansion, supported by positive EPS growth over the past year.
Margin Power vs. Revenue Scale
Fortinet dominates in margin quality and sustained profitability, with superior gross and EBIT margins. Palo Alto Networks boasts faster revenue growth and a remarkable net income turnaround. Investors seeking margin resilience might prefer Fortinet, while those valuing high growth potential could find Palo Alto Networks’ trajectory more compelling.
Financial Ratios Comparison
These vital ratios act as a diagnostic tool to expose the underlying fiscal health, valuation premiums, and capital efficiency of the companies compared below:
| Ratios | Palo Alto Networks (PANW) | Fortinet (FTNT) |
|---|---|---|
| ROE | 14.49% | 149.77% |
| ROIC | 5.67% | 28.76% |
| P/E | 101.4 | 32.5 |
| P/B | 14.7 | 48.6 |
| Current Ratio | 0.89 | 1.17 |
| Quick Ratio | 0.89 | 1.09 |
| D/E | 0.04 | 0.81 |
| Debt-to-Assets | 1.43% | 9.59% |
| Interest Coverage | 414.3 | 103.7 |
| Asset Turnover | 0.39 | 0.65 |
| Fixed Asset Turnover | 12.56 | 4.20 |
| Payout ratio | 0 | 0 |
| Dividend yield | 0 | 0 |
| Fiscal Year | 2025 | 2025 |
Efficiency & Valuation Duel: The Vital Signs
Financial ratios act as a company’s DNA, uncovering hidden risks and operational strengths that raw numbers often mask.
Palo Alto Networks, Inc.
Palo Alto Networks posts a neutral 14.5% ROE and 12.3% net margin, signaling moderate profitability. Its valuation appears stretched with a P/E of 101.4 and P/B of 14.7, reflecting high market expectations. The firm lacks dividends, prioritizing reinvestment heavily in R&D, which consumes 21.5% of revenue, aiming for growth over immediate returns.
Fortinet, Inc.
Fortinet delivers exceptional profitability with a 149.8% ROE and 27.3% net margin, demonstrating operational efficiency. Despite a lower P/E of 32.5, its P/B at 48.6 suggests some premium pricing. Fortinet’s balance sheet shows a solid current ratio of 1.17 and strong coverage metrics. Like Palo Alto, it pays no dividend, focusing on capital allocation to sustain growth.
Premium Valuation vs. Operational Safety
Fortinet offers superior profitability and a healthier liquidity profile, balancing risk and reward better than Palo Alto’s stretched valuation and weaker current ratio. Investors seeking operational strength and value may prefer Fortinet’s profile, while those betting on Palo Alto’s innovation-driven growth face greater valuation risk.
Which one offers the Superior Shareholder Reward?
I observe that neither Palo Alto Networks (PANW) nor Fortinet (FTNT) pays dividends, focusing instead on reinvestment and buybacks. PANW shows zero dividend yield and payout but generates strong free cash flow (5.2/share) with modest buybacks. FTNT also has zero dividend yield but delivers solid free cash flow (2.9/share) and a more intense buyback program. Historically, FTNT’s higher EBIT margin (30.6% vs. PANW’s 17.3%) and consistent cash flow coverage suggest a more sustainable distribution via buybacks. I conclude FTNT offers a superior total return profile in 2026, balancing growth reinvestment with shareholder returns more effectively.
Comparative Score Analysis: The Strategic Profile
The radar chart reveals the fundamental DNA and trade-offs of Palo Alto Networks and Fortinet, highlighting their financial strengths and valuation challenges:
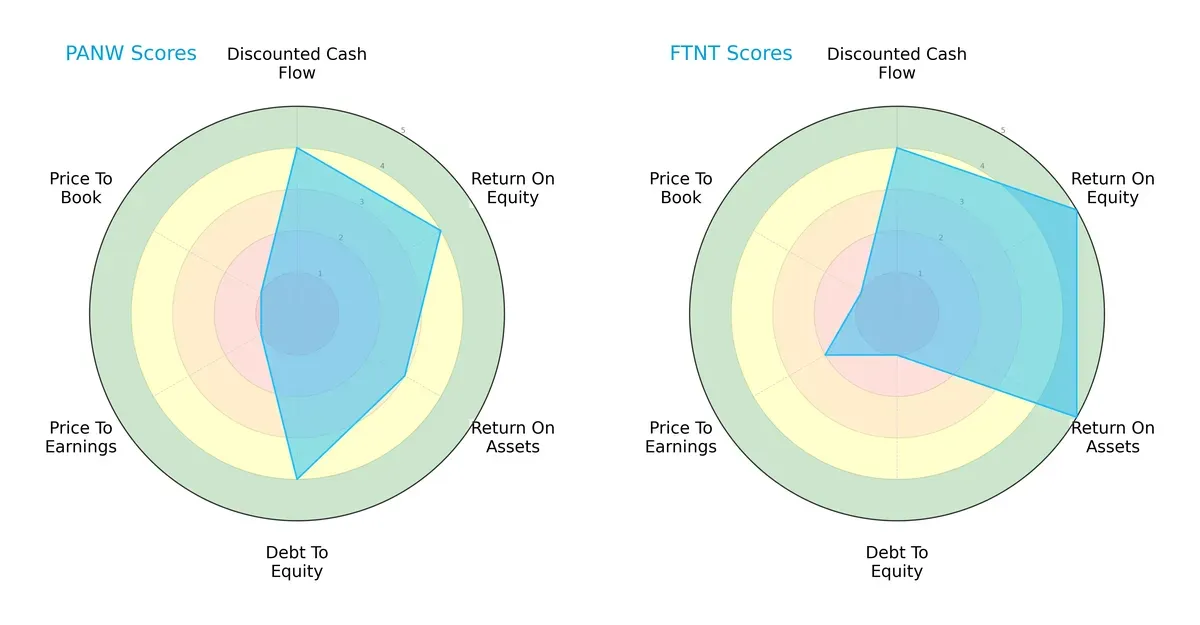
Palo Alto Networks and Fortinet share strong discounted cash flow scores (4), but Fortinet leads with superior return on equity (5 vs. 4) and return on assets (5 vs. 3). Palo Alto Networks exhibits a more conservative debt profile (debt/equity score 4 vs. 1), indicating stronger balance sheet discipline. Both firms suffer from weak valuation metrics (P/E and P/B scores at or near 1), reflecting market skepticism or overpricing. Palo Alto Networks shows a more balanced profile, while Fortinet relies heavily on operational efficiency despite higher leverage.
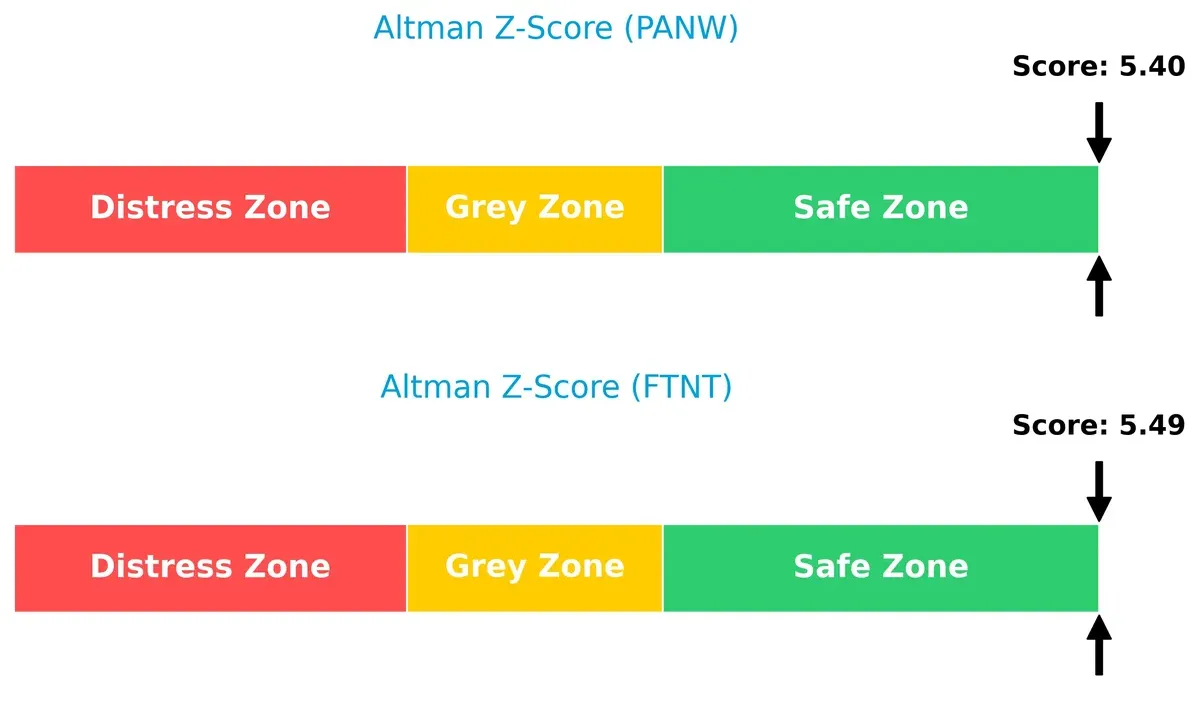
Bankruptcy Risk: Solvency Showdown
Fortinet and Palo Alto Networks boast healthy Altman Z-Scores above 5, signaling robust financial stability and low bankruptcy risk in this cycle:
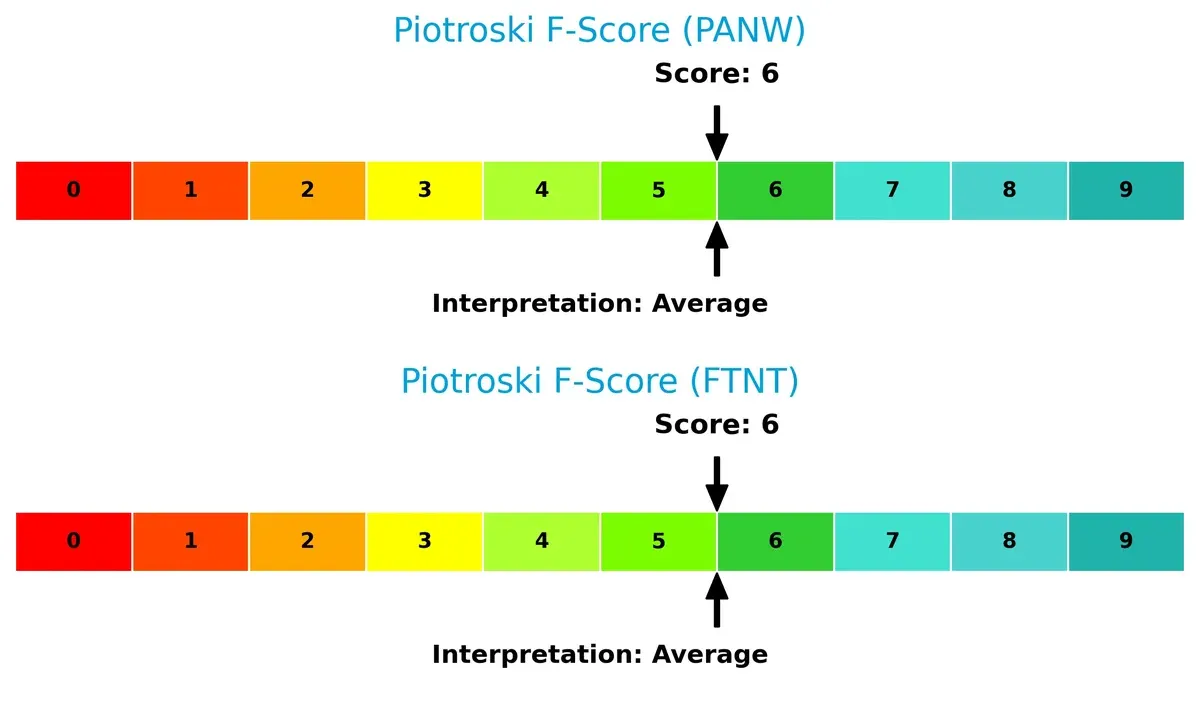
Financial Health: Quality of Operations
Both companies register identical Piotroski F-Scores of 6, indicating average financial health but no clear red flags in internal metrics:
How are the two companies positioned?
This section dissects PANW and FTNT’s operational DNA by comparing their revenue distribution and internal dynamics. The goal is to confront their economic moats to reveal which model offers the most resilient competitive advantage today.
Revenue Segmentation: The Strategic Mix
This visual comparison dissects how Palo Alto Networks and Fortinet diversify their income streams and where their primary sector bets currently lie:
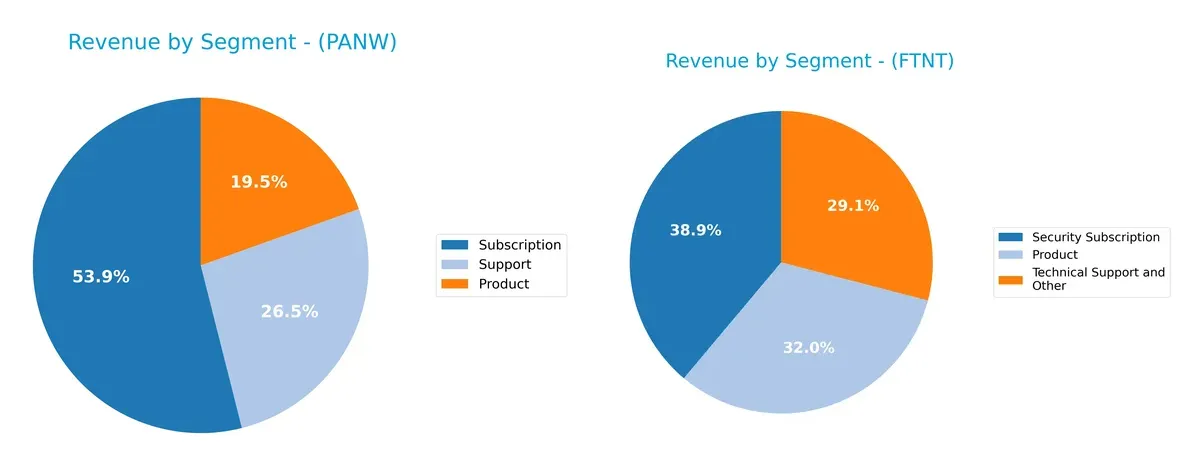
Palo Alto Networks anchors its revenue in Subscriptions at $4.97B, dwarfing its Product segment at $1.80B. Fortinet shows a more balanced mix, with Product at $1.91B and Security Subscription at $2.32B. PANW’s heavy subscription reliance signals strong ecosystem lock-in but raises concentration risk. FTNT’s diversified split suggests infrastructure dominance and resilience amid market shifts. Both leverage Support services meaningfully, underscoring customer retention focus.
Strengths and Weaknesses Comparison
This table compares the strengths and weaknesses of Palo Alto Networks and Fortinet based on key financial and operational criteria:
Palo Alto Networks Strengths
- Balanced revenue streams across product, subscription, and support
- Favorable net margin at 12.3%
- Low debt-to-assets ratio at 1.43%
- Very high interest coverage at 533
- Strong fixed asset turnover at 12.56
Fortinet Strengths
- Higher net margin at 27.26%
- Exceptional ROE at 149.77% and ROIC at 28.76%
- Favorable debt-to-assets at 9.59%
- Strong quick ratio at 1.09
- Solid asset turnover at 0.65
- Balanced geographic revenue with significant EMEA presence
Palo Alto Networks Weaknesses
- Unfavorable P/E at 101.43 and P/B at 14.7 suggest valuation concerns
- Current ratio below 1 at 0.89 indicates liquidity risk
- Asset turnover low at 0.39
- Zero dividend yield
- Neutral ROE and ROIC versus WACC at 7.29%
Fortinet Weaknesses
- Unfavorable P/E at 32.48 and very high P/B at 48.64
- Higher debt-to-equity at 0.81 reflects more leverage
- ROIC vs. WACC neutral at 8.62%
- Zero dividend yield
Both companies demonstrate slightly favorable overall financial health but differ in profitability and capital structure. Palo Alto Networks’ low leverage and strong liquidity contrast with Fortinet’s superior profitability and asset efficiency. Each firm’s strategic focus likely reflects these financial profiles.
The Moat Duel: Analyzing Competitive Defensibility
A structural moat shields long-term profits from relentless competitive pressure. Without it, gains erode quickly. Let’s examine how these two cybersecurity giants defend their turf:
Palo Alto Networks, Inc.: Innovation-Driven Intangible Assets
Palo Alto’s moat centers on intangible assets like proprietary technology and brand strength. Its gross margin above 73% shows pricing power and margin resilience. New cloud security offerings in 2026 could deepen this moat but rising competition pressures ROIC below WACC, signaling risk.
Fortinet, Inc.: Cost Leadership and Efficient Capital Use
Fortinet leverages cost advantage with integrated, automated cybersecurity solutions, reflected in an 80%+ gross margin and EBIT margin over 33%. Its ROIC outpaces WACC by 20%, confirming efficient capital use. Expansion into emerging markets and AI-powered security tools may widen its moat.
Cost Efficiency vs. Innovation Edge: Fortinet’s Clear Lead
Fortinet’s deeper moat derives from robust ROIC spread and cost leadership, outperforming Palo Alto’s innovation moat, which faces profitability challenges. Fortinet stands better poised to defend market share amid intensifying competition.
Which stock offers better returns?
Over the past year, both stocks showed strong gains with decelerating momentum, highlighting significant price appreciation followed by recent contrasting short-term trends.
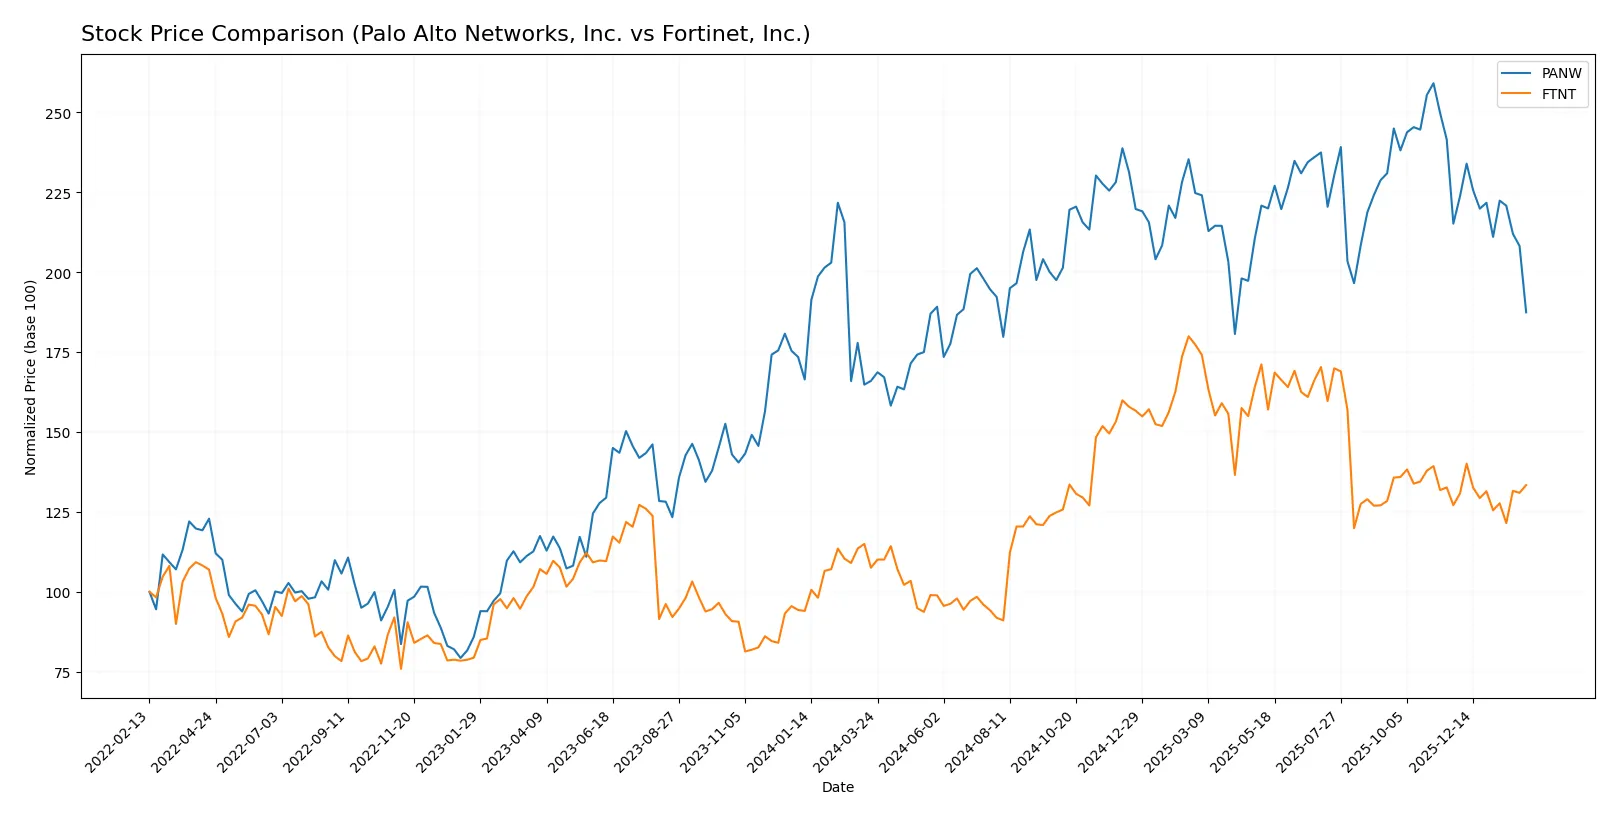
Trend Comparison
Palo Alto Networks, Inc. posted a 12.93% price increase over 12 months, signaling a bullish trend with decelerating momentum despite a recent 12.89% decline. Fortinet, Inc. delivered a 24.04% gain, also bullish with deceleration, and a modest 4.95% rise recently. Fortinet’s stock outperformed Palo Alto Networks with a higher overall return and steadier short-term trend.
Target Prices
Analysts show a bullish consensus for both Palo Alto Networks and Fortinet, signaling potential upside from current prices.
| Company | Target Low | Target High | Consensus |
|---|---|---|---|
| Palo Alto Networks, Inc. | 157 | 265 | 231.07 |
| Fortinet, Inc. | 70 | 90 | 85 |
Palo Alto Networks’ consensus target of 231 sharply exceeds its current 159 price, suggesting strong growth expectations. Fortinet’s 85 target also implies modest upside from its 83 price level.

Don’t Let Luck Decide Your Entry Point
Optimize your entry points with our advanced ProRealTime indicators. You’ll get efficient buy signals with precise price targets for maximum performance. Start outperforming now!
How do institutions grade them?
Palo Alto Networks, Inc. Grades
The following table summarizes recent institutional grades for Palo Alto Networks, Inc.:
| Grading Company | Action | New Grade | Date |
|---|---|---|---|
| Needham | Maintain | Buy | 2026-01-28 |
| UBS | Maintain | Neutral | 2026-01-13 |
| Piper Sandler | Maintain | Overweight | 2026-01-05 |
| Guggenheim | Upgrade | Neutral | 2026-01-05 |
| Morgan Stanley | Maintain | Overweight | 2025-12-18 |
| HSBC | Downgrade | Reduce | 2025-11-21 |
| Goldman Sachs | Maintain | Buy | 2025-11-21 |
| Rosenblatt | Maintain | Buy | 2025-11-20 |
| Oppenheimer | Maintain | Outperform | 2025-11-20 |
| BTIG | Maintain | Buy | 2025-11-20 |
Fortinet, Inc. Grades
The following table summarizes recent institutional grades for Fortinet, Inc.:
| Grading Company | Action | New Grade | Date |
|---|---|---|---|
| Rosenblatt | Maintain | Buy | 2026-02-06 |
| Mizuho | Maintain | Underperform | 2026-02-06 |
| JP Morgan | Maintain | Underweight | 2026-02-06 |
| RBC Capital | Maintain | Sector Perform | 2026-02-06 |
| Wedbush | Maintain | Outperform | 2026-02-06 |
| Scotiabank | Downgrade | Sector Perform | 2026-02-02 |
| JP Morgan | Maintain | Underweight | 2026-01-30 |
| Rosenblatt | Upgrade | Buy | 2026-01-29 |
| TD Cowen | Upgrade | Buy | 2026-01-23 |
| Citigroup | Maintain | Neutral | 2026-01-13 |
Which company has the best grades?
Palo Alto Networks generally receives stronger grades, including multiple Buy and Overweight ratings, compared to Fortinet’s mixed Buy and Underperform assessments. This suggests investors may view Palo Alto Networks as having a more favorable outlook.
Risks specific to each company
The following categories identify critical pressure points and systemic threats facing Palo Alto Networks, Inc. and Fortinet, Inc. in the 2026 market environment:
1. Market & Competition
Palo Alto Networks, Inc.
- Faces intense competition in cybersecurity, with high valuation pressure due to premium pricing.
Fortinet, Inc.
- Competes aggressively with a broader product portfolio but trades at a lower premium, easing valuation risk.
2. Capital Structure & Debt
Palo Alto Networks, Inc.
- Maintains very low debt levels, strengthening financial stability and lowering risk.
Fortinet, Inc.
- Carries higher debt-to-equity ratio, increasing leverage risk despite manageable interest coverage.
3. Stock Volatility
Palo Alto Networks, Inc.
- Exhibits lower beta (0.75), indicating less price volatility relative to market.
Fortinet, Inc.
- Shows higher beta (1.05), suggesting greater sensitivity to market swings and risk.
4. Regulatory & Legal
Palo Alto Networks, Inc.
- Operates globally with exposure to evolving cybersecurity regulations, posing compliance challenges.
Fortinet, Inc.
- Faces similar regulatory risks but with broader international exposure increasing complexity.
5. Supply Chain & Operations
Palo Alto Networks, Inc.
- Relies on complex supply chains for hardware and software, vulnerable to disruption risks.
Fortinet, Inc.
- Also dependent on global supply networks but benefits from diversified product lines.
6. ESG & Climate Transition
Palo Alto Networks, Inc.
- ESG initiatives are evolving; risk of lagging peers in climate transition efforts.
Fortinet, Inc.
- Shows moderate ESG engagement but must improve transparency and sustainability practices.
7. Geopolitical Exposure
Palo Alto Networks, Inc.
- US-based with significant government and enterprise exposure; potential impact from geopolitical tensions.
Fortinet, Inc.
- Wider global footprint increases exposure to geopolitical risks but diversifies regional dependence.
Which company shows a better risk-adjusted profile?
Fortinet’s higher leverage and stock volatility represent notable risks, but its superior profitability and operational efficiency offset these. Palo Alto Networks maintains a conservative capital structure and lower volatility but faces valuation and operational challenges. Fortinet’s stronger returns on equity and assets signal a better risk-adjusted profile despite debt concerns. I remain cautious about Palo Alto’s stretched valuation, which poses downside risk if growth falters.
Final Verdict: Which stock to choose?
Palo Alto Networks stands out as a cash machine fueled by strong revenue growth and solid profitability. Its key vigilance point remains a weaker current ratio, signaling liquidity caution. It suits investors with an appetite for aggressive growth and market leadership bets in cybersecurity.
Fortinet’s strategic moat lies in its exceptional return on invested capital, showcasing efficient capital use and a durable competitive advantage. Its healthier liquidity profile offers better stability than Palo Alto Networks. This makes it a fitting choice for GARP investors seeking balanced growth with reasonable risk.
If you prioritize high-growth potential and can tolerate short-term liquidity risks, Palo Alto Networks is compelling due to its accelerating profitability. However, if you seek superior capital efficiency and a safer liquidity position, Fortinet outshines with a robust economic moat and steadier fundamentals. Both present slightly favorable prospects, but investor risk tolerance will guide the optimal choice.
Disclaimer: Investment carries a risk of loss of initial capital. The past performance is not a reliable indicator of future results. Be sure to understand risks before making an investment decision.
Go Further
I encourage you to read the complete analyses of Palo Alto Networks, Inc. and Fortinet, Inc. to enhance your investment decisions: