Workday, Inc. and Paychex, Inc. are two leading players in the human capital management arena, each offering distinct yet overlapping solutions for workforce and financial management. Workday shines with its innovative cloud applications for enterprise planning and analytics, while Paychex excels in payroll and HR services tailored to small and medium businesses. This article will help you identify which company presents the most compelling investment opportunity in 2026.
Table of contents
Companies Overview
I will begin the comparison between Workday and Paychex by providing an overview of these two companies and their main differences.
Workday Overview
Workday, Inc. delivers enterprise cloud applications designed to help organizations plan, execute, analyze, and manage their business operations. Its product suite includes financial management, human capital management, and analytics applications that serve sectors like professional services, healthcare, education, and technology. The company emphasizes real-time insights and automation to improve financial and HR processes globally. Workday is headquartered in Pleasanton, California, with a market cap of approximately 54.9B USD.
Paychex Overview
Paychex, Inc. specializes in integrated human capital management solutions for small to medium-sized businesses, focusing on payroll, HR, benefits, and insurance services. Its offerings include payroll processing, regulatory compliance, retirement administration, and risk management. Paychex operates primarily in the US, Europe, and India, targeting smaller businesses with cloud-based HR software and extensive insurance products. The company is based in Rochester, New York, and has a market cap near 39.1B USD.
Key similarities and differences
Both Workday and Paychex provide human capital management solutions, but they differ in scale and client focus. Workday targets large enterprises with cloud-based financial and HR applications, emphasizing automation and analytics. Paychex serves smaller businesses with payroll and comprehensive HR outsourcing services, including insurance and compliance. While Workday operates primarily in technology, Paychex is classified in the industrials sector, reflecting their distinct market positioning.
Income Statement Comparison
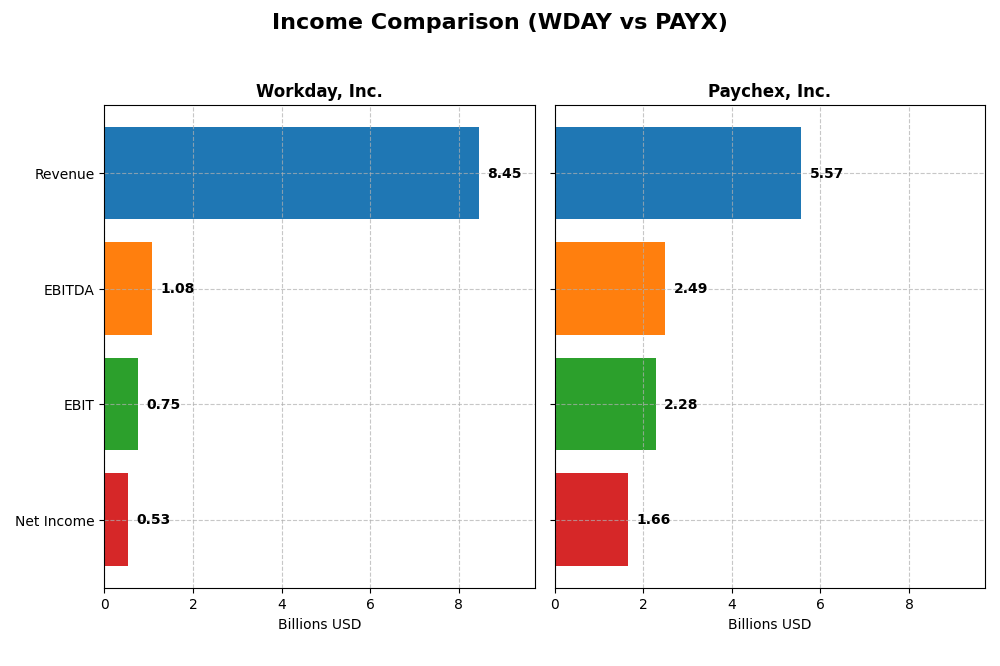
The table below compares key income statement metrics for Workday, Inc. and Paychex, Inc. based on their most recent fiscal year data.
| Metric | Workday, Inc. (WDAY) | Paychex, Inc. (PAYX) |
|---|---|---|
| Market Cap | 54.9B | 39.1B |
| Revenue | 8.45B | 5.57B |
| EBITDA | 1.08B | 2.49B |
| EBIT | 752M | 2.28B |
| Net Income | 526M | 1.66B |
| EPS | 1.98 | 4.60 |
| Fiscal Year | 2025 | 2025 |
Income Statement Interpretations
Workday, Inc.
Workday, Inc. showed strong revenue growth from $4.32B in 2021 to $8.45B in 2025, nearly doubling over five years. Net income fluctuated, with a loss in early years but reaching $526M in 2025. Gross margins remained favorable around 75.5%, while net margin was 6.23% in 2025. The latest year saw robust revenue and EBIT growth, though net margin and EPS declined sharply.
Paychex, Inc.
Paychex reported steady revenue growth from $4.06B in 2021 to $5.57B in 2025, a 37% increase. Net income rose moderately to $1.66B in 2025. Margins were strong and stable, with a favorable net margin near 29.74% and EBIT margin over 40%. In 2025, revenue growth slowed to 5.56%, and net margin and EPS showed slight declines, indicating some margin pressure.
Which one has the stronger fundamentals?
Workday exhibits impressive top-line growth and margin expansion over five years but faces volatility in net profitability and EPS recently. Paychex maintains solid profitability with high and stable margins, though growth rates are more modest and recent margin trends show some softness. Overall, both companies demonstrate favorable fundamentals with distinct growth and margin profiles.
Financial Ratios Comparison
Below is a comparison of key financial ratios for Workday, Inc. (WDAY) and Paychex, Inc. (PAYX), based on their most recent fiscal year data.
| Ratios | Workday, Inc. (WDAY) FY 2025 | Paychex, Inc. (PAYX) FY 2025 |
|---|---|---|
| ROE | 5.82% | 40.15% |
| ROIC | 2.73% | 16.77% |
| P/E | 132.15 | 34.32 |
| P/B | 7.69 | 13.78 |
| Current Ratio | 1.85 | 1.28 |
| Quick Ratio | 1.85 | 1.28 |
| D/E (Debt to Equity) | 0.37 | 1.22 |
| Debt-to-Assets | 18.70% | 30.32% |
| Interest Coverage | 3.64 | 20.95 |
| Asset Turnover | 0.47 | 0.34 |
| Fixed Asset Turnover | 5.36 | 9.68 |
| Payout Ratio | 0 | 87.40% |
| Dividend Yield | 0% | 2.55% |
Interpretation of the Ratios
Workday, Inc.
Workday’s ratios present a mixed picture with favorable liquidity and debt metrics but unfavorable returns on equity and invested capital, alongside a high P/E and P/B ratio suggesting valuation concerns. Asset turnover is weak, indicating potential efficiency issues. The company does not pay dividends, consistent with its reinvestment strategy and high R&D spending, which may prioritize growth over immediate shareholder returns.
Paychex, Inc.
Paychex shows strong profitability and returns with favorable net margin, ROE, and ROIC ratios, supported by solid interest coverage and fixed asset turnover. However, its debt-to-equity is high and valuation multiples are elevated, posing some risks. The firm pays a dividend with a 2.55% yield, indicating steady shareholder returns, while maintaining a generally favorable ratio profile.
Which one has the best ratios?
Paychex holds a more favorable overall ratio profile with stronger profitability and returns, better interest coverage, and dividend payments. Workday has balanced liquidity and debt levels but is weaker in profitability and valuation metrics. Thus, Paychex stands out for its financial strength, while Workday’s ratios reflect a growth-focused, reinvestment approach.
Strategic Positioning
This section compares the strategic positioning of Workday and Paychex, covering market position, key segments, and exposure to technological disruption:
Workday, Inc.
- Market position and competitive pressure
- Key segments and business drivers
- Exposure to technological disruption
Paychex, Inc.
- Leading enterprise cloud applications provider; faces tech sector competition.
- Subscription services dominate revenue; professional services support enterprise clients.
- High exposure due to cloud applications and machine learning integration.
Workday, Inc. vs Paychex, Inc. Positioning
Workday’s strategy is concentrated on enterprise cloud software with a focus on subscription revenue growth, while Paychex maintains a more diversified approach across payroll, HR, benefits, and insurance for SMBs. Workday’s tech orientation offers innovation leverage; Paychex’s broader service mix supports stability.
Which has the best competitive advantage?
Paychex demonstrates a stronger competitive advantage by creating value with ROIC above WACC despite declining profitability, whereas Workday is shedding value though its ROIC is growing, indicating weaker moat sustainability.
Stock Comparison
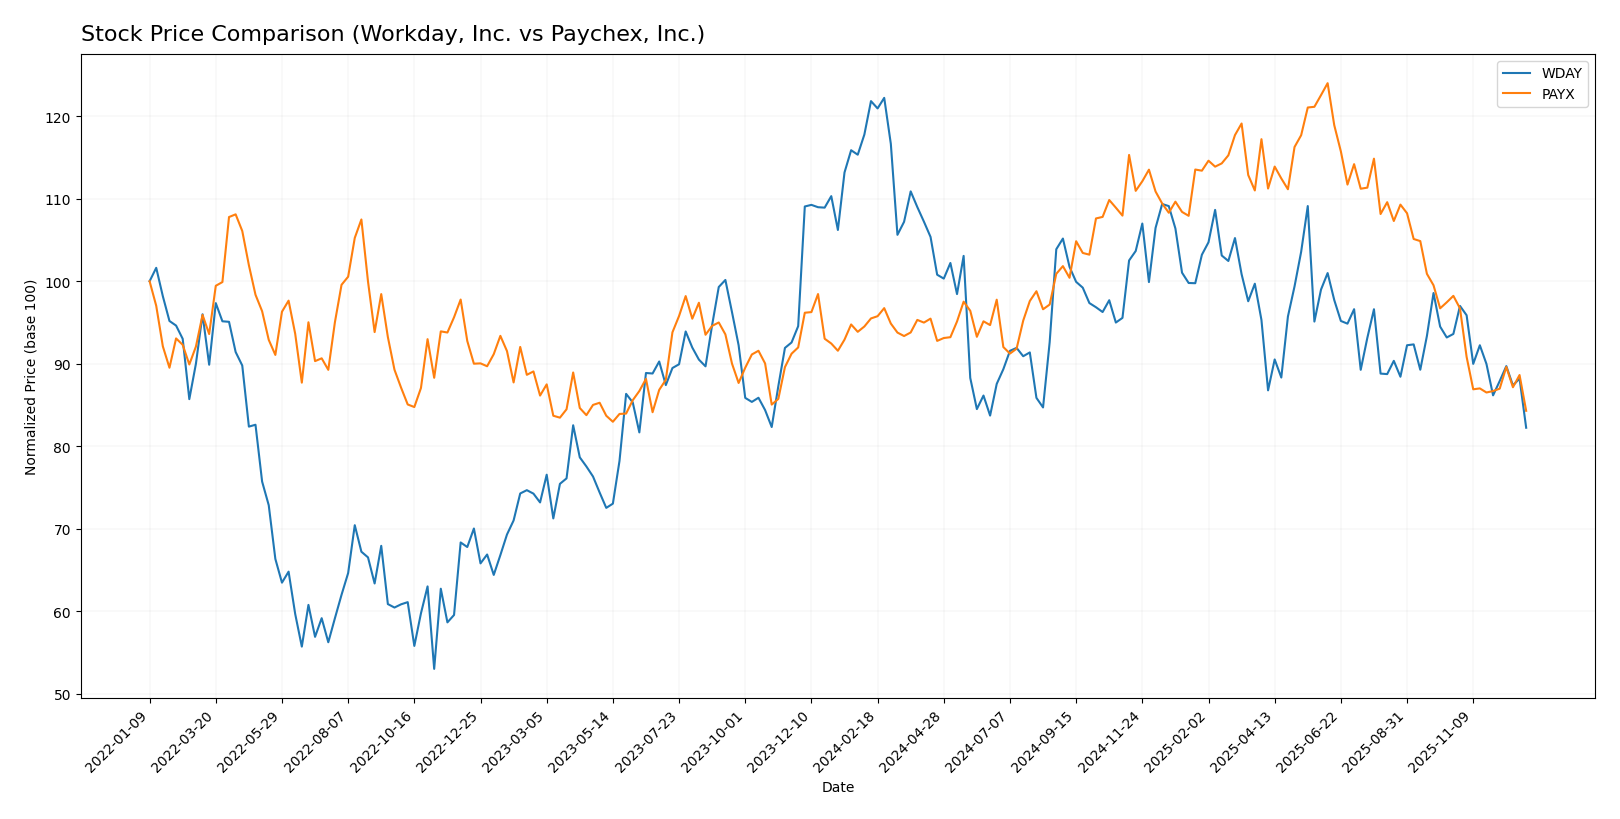
The stock price dynamics of Workday, Inc. (WDAY) and Paychex, Inc. (PAYX) over the past 12 months reveal notable declines, with both experiencing bearish trends accompanied by decelerating momentum.
Trend Analysis
Workday, Inc. (WDAY) exhibited a bearish trend with a 32.5% price decline over the past year, marked by deceleration and a high volatility level indicated by a 20.93 std deviation. The stock peaked at 305.88 and bottomed at 205.79.
Paychex, Inc. (PAYX) also showed a bearish trend, with an 11.73% decrease in price over the same period, experiencing deceleration and moderate volatility with a 12.96 std deviation. The stock’s price ranged between 159.78 and 108.6.
Comparing the two, Workday’s stock suffered a steeper decline than Paychex’s, making Paychex the better performing stock in terms of market price retention over the past year.
Target Prices
Analyst consensus target prices indicate moderate upside potential for both Workday, Inc. and Paychex, Inc.
| Company | Target High | Target Low | Consensus |
|---|---|---|---|
| Workday, Inc. | 320 | 235 | 277.06 |
| Paychex, Inc. | 140 | 110 | 124.5 |
Workday’s consensus target price of 277.06 suggests a roughly 35% upside from the current 205.79 price, while Paychex’s consensus at 124.5 indicates about a 15% potential gain versus its 108.6 stock price.
Analyst Opinions Comparison
This section compares analysts’ ratings and grades for Workday, Inc. and Paychex, Inc.:
Rating Comparison
WDAY Rating
- Rating: B-, assessed as Very Favorable overall rating by analysts.
- Discounted Cash Flow Score: 4, indicating a Favorable outlook on future cash flows.
- ROE Score: 3, reflecting Moderate efficiency in generating profits from equity.
- ROA Score: 3, showing Moderate effectiveness in asset utilization.
- Debt To Equity Score: 2, representing Moderate financial risk and balance sheet strength.
- Overall Score: 2, considered Moderate by analysts.
PAYX Rating
- Rating: A-, assessed as Very Favorable overall rating by analysts.
- Discounted Cash Flow Score: 4, indicating a Favorable outlook on future cash flows.
- ROE Score: 5, reflecting Very Favorable efficiency in generating profits from equity.
- ROA Score: 5, showing Very Favorable effectiveness in asset utilization.
- Debt To Equity Score: 4, representing Favorable financial risk and balance sheet strength.
- Overall Score: 4, considered Favorable by analysts.
Which one is the best rated?
Based strictly on the provided data, Paychex, Inc. holds higher ratings and scores across all key financial metrics compared to Workday, Inc. Paychex’s overall score and profitability measures notably outperform Workday’s moderate scores.
Scores Comparison
Here is a comparison of the financial health scores for Workday, Inc. and Paychex, Inc.:
WDAY Scores
- Altman Z-Score: 4.82, indicating a safe zone with low bankruptcy risk.
- Piotroski Score: 6, classified as average financial strength.
PAYX Scores
- Altman Z-Score: 3.01, in the safe zone suggesting low bankruptcy risk.
- Piotroski Score: 7, showing strong financial health.
Which company has the best scores?
Paychex exhibits a stronger Piotroski Score of 7 compared to Workday’s 6, indicating better financial strength. Workday has a higher Altman Z-Score, but both companies are in the safe zone for bankruptcy risk.
Grades Comparison
The following presents the latest reliable grades from established financial institutions for both companies:
Workday, Inc. Grades
This table shows the recent grades and actions from reputable grading companies for Workday, Inc.:
| Grading Company | Action | New Grade | Date |
|---|---|---|---|
| Bernstein | Maintain | Outperform | 2025-11-26 |
| DA Davidson | Maintain | Neutral | 2025-11-26 |
| Barclays | Maintain | Overweight | 2025-11-26 |
| TD Cowen | Maintain | Buy | 2025-11-26 |
| Keybanc | Maintain | Overweight | 2025-11-26 |
| JP Morgan | Maintain | Overweight | 2025-11-26 |
| UBS | Maintain | Neutral | 2025-11-26 |
| Citigroup | Maintain | Neutral | 2025-11-26 |
| RBC Capital | Maintain | Outperform | 2025-11-26 |
| Wells Fargo | Maintain | Overweight | 2025-11-26 |
Overall, Workday, Inc. receives predominantly positive grades, with multiple “Outperform,” “Overweight,” and “Buy” ratings, indicating a strong consensus on its favorable outlook.
Paychex, Inc. Grades
This table displays the most recent grades and actions from established grading companies for Paychex, Inc.:
| Grading Company | Action | New Grade | Date |
|---|---|---|---|
| Citigroup | Maintain | Neutral | 2025-12-22 |
| Morgan Stanley | Maintain | Equal Weight | 2025-12-22 |
| JP Morgan | Maintain | Underweight | 2025-12-22 |
| Stifel | Maintain | Hold | 2025-12-17 |
| Wells Fargo | Maintain | Underweight | 2025-12-09 |
| BMO Capital | Maintain | Market Perform | 2025-12-09 |
| Jefferies | Maintain | Hold | 2025-12-08 |
| TD Cowen | Maintain | Hold | 2025-12-01 |
| Morgan Stanley | Maintain | Equal Weight | 2025-10-20 |
| JP Morgan | Maintain | Underweight | 2025-10-01 |
Paychex, Inc. shows a neutral to cautious grading trend, with several “Hold,” “Equal Weight,” and “Underweight” ratings, reflecting a more conservative stance by analysts.
Which company has the best grades?
Workday, Inc. has received significantly stronger grades compared to Paychex, Inc., with an emphasis on “Outperform” and “Buy” ratings versus Paychex’s predominately neutral or underweight grades. This contrast could influence investors seeking higher growth potential versus more conservative positioning.
Strengths and Weaknesses
Below is a comparative overview of the key strengths and weaknesses of Workday, Inc. (WDAY) and Paychex, Inc. (PAYX) based on the most recent financial and operational data.
| Criterion | Workday, Inc. (WDAY) | Paychex, Inc. (PAYX) |
|---|---|---|
| Diversification | Focused mainly on subscription and professional services; moderate product diversification within HR tech | Broader range with management solutions and PEO/insurance services; more diversified within HR and payroll services |
| Profitability | Lower profitability with net margin 6.23%, ROIC 2.73%, ROE 5.82%; slightly unfavorable profitability metrics | Strong profitability: net margin 29.74%, ROIC 16.77%, ROE 40.15%; favorable profitability ratios |
| Innovation | Growing ROIC trend (+162%) suggests improving operational efficiency and innovation | Declining ROIC trend (-35.5%) indicates potential challenges in sustaining innovation and profitability |
| Global presence | Primarily US-focused but expanding subscription services globally | Established global presence with diversified product offerings supporting broad client base |
| Market Share | Strong in cloud-based HR software but faces intense competition; market share growth visible in subscription revenue | Leading market share in payroll and HR solutions with steady revenue growth in management solutions |
Key takeaways: Workday is improving its profitability and innovation trajectory but still faces challenges in value creation and market diversification. Paychex demonstrates robust profitability and market leadership, though its profitability is showing signs of decline. Investors should weigh Workday’s growth potential against Paychex’s established financial strength and broader diversification.
Risk Analysis
Below is a comparative table highlighting key risk factors for Workday, Inc. (WDAY) and Paychex, Inc. (PAYX) based on the most recent 2025 data:
| Metric | Workday, Inc. (WDAY) | Paychex, Inc. (PAYX) |
|---|---|---|
| Market Risk | Beta 1.15 (moderate volatility) | Beta 0.90 (lower volatility) |
| Debt level | Debt/Equity 0.37 (low risk) | Debt/Equity 1.22 (higher risk) |
| Regulatory Risk | Moderate (Tech sector regulation) | Moderate (HR compliance focus) |
| Operational Risk | Moderate (Cloud services dependency) | Moderate (Service delivery scale) |
| Environmental Risk | Low (software company) | Low (service provider) |
| Geopolitical Risk | Moderate (global client exposure) | Moderate (US/Europe/India focus) |
The most impactful risks are market volatility for Workday, with its beta above 1, indicating sensitivity to market swings, and Paychex’s higher debt level, which could increase financial risk. Operational dependence on cloud infrastructure for Workday and regulatory compliance in multiple regions for Paychex are also notable considerations. Both companies maintain low environmental risk given their industry profiles.
Which Stock to Choose?
Workday, Inc. (WDAY) shows a favorable income evolution with 16.35% revenue growth in 2025 and an overall positive margin trend, despite some unfavorable profitability ratios like ROE at 5.82%. Its debt levels are moderate with a net debt to EBITDA of 1.69, and the rating is very favorable (B-), though financial ratios are balanced between favorable and unfavorable, reflecting a neutral overall stance.
Paychex, Inc. (PAYX) exhibits stable income growth with a modest 5.56% revenue increase in 2025 and strong profitability including a 40.15% ROE and 29.74% net margin. Debt is higher (debt to equity 1.22) but manageable, supported by a solid interest coverage of 21.64. PAYX holds a very favorable rating (A-) and favorable overall financial ratios, suggesting strong financial health.
Investors prioritizing growth and improving profitability might find WDAY’s rising income and improving ROIC profile appealing despite mixed ratios. In contrast, those valuing consistent profitability and stronger financial stability may view PAYX’s favorable ratings and higher returns as more suitable, although its ROIC trend is declining. The choice could depend on the investor’s risk tolerance and preference for growth versus quality.
Disclaimer: Investment carries a risk of loss of initial capital. The past performance is not a reliable indicator of future results. Be sure to understand risks before making an investment decision.
Go Further
I encourage you to read the complete analyses of Workday, Inc. and Paychex, Inc. to enhance your investment decisions: