In the dynamic world of semiconductors, two giants stand out: Advanced Micro Devices, Inc. (AMD) and Intel Corporation (INTC). Both companies are pivotal players in the technology sector, focusing on innovation in microprocessors and graphics solutions. Their market overlap and contrasting strategies make them prime candidates for comparison. In this article, I will analyze their strengths, weaknesses, and potential for growth, ultimately guiding you to determine which company might be the more intriguing investment opportunity.

Table of contents
Company Overview
Advanced Micro Devices, Inc. Overview
Advanced Micro Devices, Inc. (AMD) is a prominent player in the semiconductor industry, specializing in the design and manufacturing of microprocessors, GPUs, and other computing technologies. Founded in 1969 and headquartered in Santa Clara, California, AMD focuses on two main segments: Computing and Graphics, and Enterprise, Embedded and Semi-Custom solutions. The company is renowned for its competitive processors, such as the AMD Ryzen and EPYC series, which cater to a variety of applications, including gaming and data centers. With a market capitalization of approximately $331B, AMD has positioned itself as a formidable rival to larger incumbents in the semiconductor space, continuously pushing the boundaries of performance and innovation.
Intel Corporation Overview
Intel Corporation, established in 1968 and also based in Santa Clara, California, is one of the largest semiconductor manufacturers globally. With a diverse range of products that span Central Processing Units (CPUs), memory and storage solutions, and specialized platforms for artificial intelligence and autonomous driving, Intel operates through multiple segments, including Client Computing and Data Center Groups. As a pioneer in the industry with a market capitalization of around $152B, Intel has a well-entrenched market position, known for its extensive research and development capabilities and its strategic partnerships, such as its collaboration with MILA in AI advancements.
Key Similarities and Differences
Both AMD and Intel operate within the semiconductor industry and focus on designing and manufacturing processors. However, AMD has carved a niche in high-performance gaming and data center solutions, often competing on price and performance. In contrast, Intel maintains a broader product portfolio, including solutions for diverse sectors like healthcare and automotive, reflecting its more extensive market reach and established legacy.
Income Statement Comparison
The following table presents a comparative analysis of the income statements for Advanced Micro Devices, Inc. (AMD) and Intel Corporation (INTC) for the fiscal year 2024.
| Metric | AMD | INTC |
|---|---|---|
| Revenue | 25.79B | 53.10B |
| EBITDA | 5.26B | 1.20B |
| EBIT | 2.08B | -10.18B |
| Net Income | 1.64B | -18.76B |
| EPS | 1.01 | -4.38 |
Interpretation of Income Statement
In 2024, AMD experienced significant growth in revenue, increasing from $22.68B in 2023 to $25.79B, while INTC faced a decline, falling from $54.23B to $53.10B. Despite this, AMD’s net income rose to $1.64B, showcasing improved margins. In contrast, INTC recorded a substantial loss of $18.76B, reflecting ongoing challenges. The stark disparity in operating performance indicates that AMD is capitalizing on market opportunities, while INTC’s margins deteriorated significantly, raising concerns about its strategic direction and operational efficiency.
Financial Ratios Comparison
Below is a comparative table showcasing the most recent financial ratios for Advanced Micro Devices, Inc. (AMD) and Intel Corporation (INTC).
| Metric | AMD | INTC |
|---|---|---|
| ROE | 2.85% | -18.89% |
| ROIC | 2.48% | -12.18% |
| P/E | 123.59 | -4.63 |
| P/B | 3.52 | 0.88 |
| Current Ratio | 2.62 | 1.33 |
| Quick Ratio | 1.83 | 0.98 |
| D/E | 0.04 | 0.50 |
| Debt-to-Assets | 0.03 | 0.26 |
| Interest Coverage | 20.65 | -14.17 |
| Asset Turnover | 0.37 | 0.27 |
| Fixed Asset Turnover | 10.63 | 0.49 |
| Payout ratio | 0% | 184.83% |
| Dividend yield | 0% | 1.84% |
Interpretation of Financial Ratios
AMD’s ratios indicate a strong operational and financial position, notably with a high current ratio and low debt levels, suggesting good liquidity and solvency. Conversely, Intel displays concerning metrics, such as negative ROE and P/E ratios, which may reflect underlying challenges in profitability and market perception. The high payout ratio in Intel suggests aggressive dividend distribution despite losses, raising sustainability concerns.
Dividend and Shareholder Returns
Advanced Micro Devices, Inc. (AMD) does not pay dividends, focusing instead on reinvestment for growth and innovation. The company has been engaged in share buybacks, which can enhance shareholder value but also poses risks if done excessively. Conversely, Intel Corporation (INTC) maintains a dividend yield of 1.47% and has a payout ratio of 75%, reflecting a commitment to returning value to shareholders. However, its declining profitability raises concerns about the sustainability of these distributions. Overall, both strategies suggest differing approaches to long-term shareholder value creation.
Strategic Positioning
In the semiconductor market, AMD currently captures a market share of approximately 36% compared to Intel’s 64%. AMD’s aggressive pricing and innovative product offerings have increased competitive pressure on Intel, which is struggling with production delays and technological disruptions. As both companies pivot towards AI and cloud computing, AMD’s recent advancements in GPUs and processors position it favorably against Intel’s legacy products, emphasizing the need for ongoing innovation to maintain market relevance.
Stock Comparison
Over the past year, the stock prices of Advanced Micro Devices, Inc. (AMD) and Intel Corporation (INTC) have exhibited significant movements, reflecting the dynamic nature of the semiconductor industry.
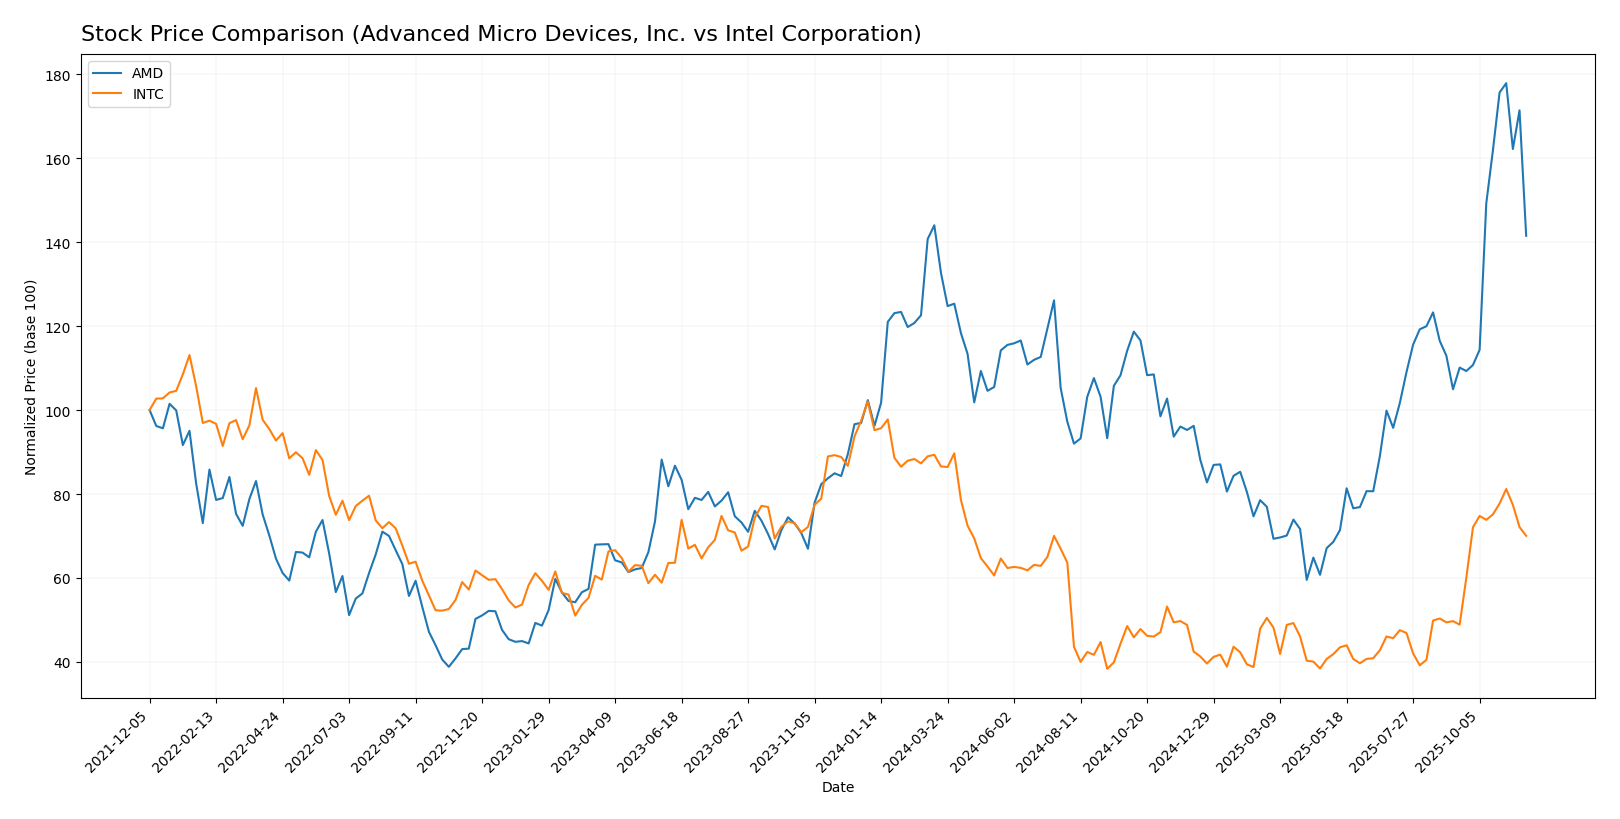
Trend Analysis
For AMD, the overall trend shows a price change of +38.24% over the past year, indicating a bullish trend. Notably, the stock reached a high of 256.12 and a low of 85.76, with an acceleration status suggesting that the upward movement is gaining strength. The standard deviation of 35.18 indicates a relatively high level of volatility in its price movements.
In the recent analysis period from September 7, 2025, to November 23, 2025, AMD recorded a price change of +34.83%, maintaining its bullish trend with an upward slope of 9.34.
In contrast, Intel Corporation has experienced a price change of -31.34% over the past year, categorizing it within a bearish trend. The stock fluctuated between a high of 50.25 and a low of 18.89, also displaying acceleration in its downward trajectory. The standard deviation of 8.72 reflects lower volatility compared to AMD.
Recently, from September 7, 2025, to November 23, 2025, Intel’s stock saw a price change of +40.87%, showing signs of recovery, but the overall trend remains bearish with a slight upward slope of 1.05.
In summary, while AMD is firmly in a bullish phase with both recent and overall trends supporting a positive outlook, Intel’s situation illustrates a recovery attempt after a significant decline, though it still faces challenges.
Analyst Opinions
Recent analyst recommendations indicate a cautious outlook for the semiconductor sector. For Advanced Micro Devices, Inc. (AMD), analysts have issued a “Buy” rating, citing strong performance in return on assets and overall solid financial health. In contrast, Intel Corporation (INTC) has received a “Hold” rating due to concerns over its discounted cash flow and return on equity metrics. Analysts suggest that while AMD is on a growth trajectory, Intel faces challenges that may hinder its performance. The consensus for AMD is a strong buy, while INTC leans towards a hold.
Stock Grades
Recent evaluations from reputable grading companies provide insight into the current outlook for two key technology stocks: Advanced Micro Devices, Inc. (AMD) and Intel Corporation (INTC).
Advanced Micro Devices, Inc. Grades
| Grading Company | Action | New Grade | Date |
|---|---|---|---|
| Piper Sandler | maintain | Overweight | 2025-11-12 |
| B of A Securities | maintain | Buy | 2025-11-12 |
| Wells Fargo | maintain | Overweight | 2025-11-12 |
| Morgan Stanley | maintain | Equal Weight | 2025-11-12 |
| Wedbush | maintain | Outperform | 2025-11-12 |
| Roth Capital | maintain | Buy | 2025-11-12 |
| Rosenblatt | maintain | Buy | 2025-11-12 |
| Mizuho | maintain | Outperform | 2025-11-12 |
| Evercore ISI Group | maintain | Outperform | 2025-11-12 |
Intel Corporation Grades
| Grading Company | Action | New Grade | Date |
|---|---|---|---|
| Tigress Financial | maintain | Buy | 2025-11-04 |
| Barclays | maintain | Equal Weight | 2025-10-27 |
| Mizuho | maintain | Neutral | 2025-10-24 |
| Wedbush | maintain | Neutral | 2025-10-24 |
| Wells Fargo | maintain | Equal Weight | 2025-10-24 |
| Cantor Fitzgerald | maintain | Neutral | 2025-10-24 |
| Morgan Stanley | maintain | Equal Weight | 2025-10-24 |
| Truist Securities | maintain | Hold | 2025-10-24 |
| Rosenblatt | maintain | Sell | 2025-10-24 |
| JP Morgan | maintain | Underweight | 2025-10-24 |
The overall trend indicates a stable sentiment towards AMD, with all grades maintained at favorable levels, predominantly in the overweight and buy categories. In contrast, INTC shows a mixed sentiment, with several neutral and hold ratings, reflecting a more cautious outlook among analysts. This divergence highlights the varying investor sentiment in the semiconductor sector, suggesting that while AMD is currently favored, INTC may present both challenges and opportunities for investors.
Target Prices
Analysts have provided reliable target price data for both Advanced Micro Devices, Inc. (AMD) and Intel Corporation (INTC).
| Company | Target High | Target Low | Consensus |
|---|---|---|---|
| AMD | 380 | 200 | 295.24 |
| INTC | 52 | 20 | 35.22 |
The consensus target prices indicate that AMD is expected to see potential growth, with a target consensus of 295.24 compared to its current price of 203.78. Conversely, INTC’s target consensus of 35.22 suggests a modest upside from its current price of 34.50.
Strengths and Weaknesses
The following table summarizes the strengths and weaknesses of Advanced Micro Devices, Inc. (AMD) and Intel Corporation (INTC) based on the most recent data.
| Criterion | AMD | INTC |
|---|---|---|
| Diversification | High (multiple product lines in computing and graphics) | Moderate (focus on CPUs and integrated solutions) |
| Profitability | Moderate (net margin of 6.36%) | Negative (net margin of -35.32%) |
| Innovation | High (leading in GPU technology) | Moderate (lagging in recent advancements) |
| Global presence | Strong (extensive global sales network) | Strong (established market presence) |
| Market Share | Growing (increasing in CPU market) | Decreasing (loss of market share to competitors) |
| Debt level | Low (debt-to-equity ratio of 0.04) | High (debt-to-equity ratio of 0.50) |
Key takeaways: AMD exhibits strong diversification and innovation, contributing to its growing market share, while Intel faces challenges with profitability and high debt levels, indicating potential risks for investors.
Risk Analysis
The following table outlines the key risks associated with Advanced Micro Devices, Inc. (AMD) and Intel Corporation (INTC).
| Metric | AMD | INTC |
|---|---|---|
| Market Risk | High | Moderate |
| Regulatory Risk | Moderate | High |
| Operational Risk | Moderate | High |
| Environmental Risk | Low | Moderate |
| Geopolitical Risk | Moderate | High |
Both AMD and INTC face significant market and operational risks, primarily due to the competitive semiconductor landscape and global supply chain disruptions. Recent regulatory scrutiny also poses challenges, particularly for INTC.
Which one to choose?
When comparing Advanced Micro Devices, Inc. (AMD) and Intel Corporation (INTC), AMD appears to be a more favorable choice for investors. AMD has demonstrated a bullish stock trend with a 38.24% price change over the past year, while INTC has faced a bearish trend with a -31.34% decrease. AMD’s financials reflect a solid gross profit margin of 49.35% and a net profit margin of 6.36%, compared to INTC’s gross margin of 32.66% and a negative net margin. Furthermore, AMD holds a rating of B, signaling better overall performance than INTC’s C+ rating.
For growth-oriented investors, AMD is likely the better option, while those seeking stability may still consider INTC despite its recent challenges. However, I caution that INTC’s heavy debt load and competitive pressures in the semiconductor industry present significant risks.
Disclaimer: This article is not financial advice. Each investor is responsible for their own investment decisions.
Go further
I encourage you to read the complete analyses of Advanced Micro Devices, Inc. and Intel Corporation to enhance your investment decisions: