In the dynamic world of semiconductors, Broadcom Inc. (AVGO) and Texas Instruments Incorporated (TXN) stand out as two titans with distinct strategies and market approaches. Both companies operate in the same industry and share overlapping market segments, yet their innovation strategies and product offerings differ significantly. As an investor, understanding these nuances is crucial for making informed decisions. Join me as I explore which of these two companies presents the most compelling opportunity for your investment portfolio.

Table of contents
Company Overview
Broadcom Inc. Overview
Broadcom Inc. (AVGO) is a leading global technology company specializing in the design, development, and supply of semiconductor and infrastructure software solutions. Headquartered in San Jose, California, with a workforce of approximately 37K employees, Broadcom operates through four main segments: Wired Infrastructure, Wireless Communications, Enterprise Storage, and Industrial & Other. The company’s diverse product portfolio caters to various applications, including data center networking, telecommunication equipment, and factory automation. Broadcom’s mission is to enable the digital economy by providing innovative solutions that enhance connectivity and efficiency.
Texas Instruments Incorporated Overview
Texas Instruments Incorporated (TXN) is a prominent player in the semiconductor industry, known for its design and manufacturing of innovative semiconductor products. Founded in 1930 and headquartered in Dallas, Texas, the company operates primarily in two segments: Analog and Embedded Processing. Texas Instruments focuses on providing power management solutions and signal chain products, serving various sectors such as industrial, automotive, and personal electronics. The company’s mission is to empower customers by delivering high-performance semiconductor solutions that improve efficiency and drive technological advancement.
Key similarities between Broadcom and Texas Instruments include their focus on the semiconductor industry and commitment to technological innovation. However, they differ in their operational segments; Broadcom emphasizes a broader range of infrastructure solutions, whereas Texas Instruments specializes in analog and embedded processing solutions. This distinction allows each company to cater to unique market needs while sharing a common goal of advancing technology.
Income Statement Comparison
The following table illustrates a comparison of key financial metrics for Broadcom Inc. (AVGO) and Texas Instruments Incorporated (TXN) for their most recent fiscal years.
| Metric | Broadcom Inc. | Texas Instruments |
|---|---|---|
| Revenue | 51.57B | 15.64B |
| EBITDA | 23.88B | 7.54B |
| EBIT | 13.87B | 5.96B |
| Net Income | 5.90B | 4.80B |
| EPS | 1.27 | 5.24 |
Interpretation of Income Statement
In the latest fiscal year, Broadcom Inc. experienced significant revenue growth of approximately 44% compared to the previous year, reflecting robust demand in its sector. However, net income saw a decline of about 58%, indicating increased expenses and a drop in margins. Conversely, Texas Instruments reported a revenue decrease of around 11%, but net income remained relatively stable, showing resilience despite challenging market conditions. The company’s margins improved slightly, hinting at effective cost management strategies. Overall, Broadcom’s substantial revenue growth was overshadowed by its declining profitability, while Texas Instruments maintained steady performance amidst market fluctuations.
Financial Ratios Comparison
The following table presents a comparative analysis of key financial ratios for Broadcom Inc. (AVGO) and Texas Instruments Incorporated (TXN) based on the most recent fiscal year data.
| Metric | Broadcom Inc. (AVGO) | Texas Instruments (TXN) |
|---|---|---|
| ROE | 8.71% | 28.39% |
| ROIC | 5.57% | 14.75% |
| P/E | 133.17 | 23.78 |
| P/B | 11.60 | 9.16 |
| Current Ratio | 1.17 | 4.12 |
| Quick Ratio | 1.07 | 2.88 |
| D/E | 1.00 | 0.80 |
| Debt-to-Assets | 40.79% | 34.69% |
| Interest Coverage | 3.41 | 10.76 |
| Asset Turnover | 0.31 | 0.54 |
| Fixed Asset Turnover | 20.46 | 1.38 |
| Payout ratio | 166.48% | 99.92% |
| Dividend yield | 1.25% | 2.90% |
Interpretation of Financial Ratios
Broadcom Inc. exhibits a high P/E ratio of 133.17, indicating elevated growth expectations, but it has significantly lower returns on equity (ROE) and invested capital (ROIC) compared to Texas Instruments, which demonstrates stronger profitability and efficiency. TXN’s current and quick ratios indicate superior liquidity, while AVGO’s debt levels are concerning. The high payout ratio for AVGO suggests potential vulnerabilities in sustaining dividends during downturns, whereas TXN maintains a more conservative distribution policy. Overall, TXN appears to be the safer investment choice based on these metrics.
Dividend and Shareholder Returns
Broadcom Inc. (AVGO) offers a dividend with a yield of 1.25% and a payout ratio of approximately 166.5%, indicating a potential risk of unsustainable distributions. The company also engages in share buybacks, which may provide additional shareholder returns. In contrast, Texas Instruments (TXN) has a dividend yield of 2.8% with a payout ratio of 99.9%, suggesting a stable income stream for investors. Both companies appear to prioritize shareholder value, but careful monitoring of their cash flows is essential to ensure sustainability.
Strategic Positioning
Broadcom Inc. (AVGO) holds a significant market share in the semiconductor industry, particularly in infrastructure software solutions and networking products, which positions it favorably against competitors like Texas Instruments (TXN). The competitive pressure is notable as both companies innovate amidst rapid technological advancements. However, TXN’s strong presence in analog and embedded processing segments allows it to maintain a robust stance in various end markets, minimizing disruption risks. Effective risk management remains essential as market dynamics evolve.
Stock Comparison
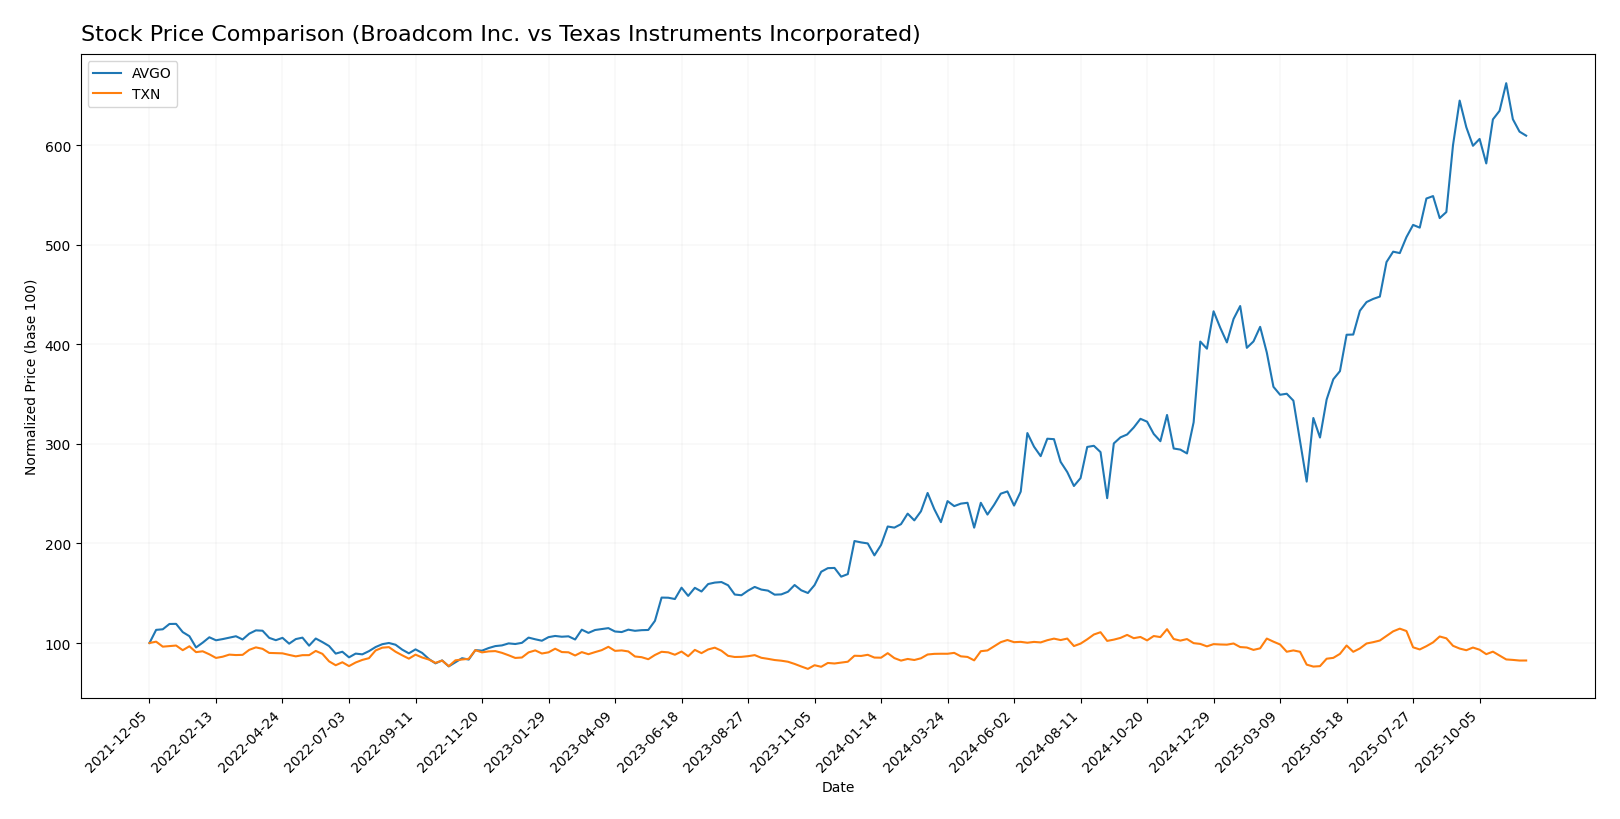
Over the past year, Broadcom Inc. (AVGO) and Texas Instruments Incorporated (TXN) have exhibited distinct stock price movements and trading dynamics, reflecting divergent trends in their performance and market sentiment.

Trend Analysis
Broadcom Inc. (AVGO) has experienced a significant price change of +204.76% over the past year, indicating a bullish trend. Despite this strong overall performance, the recent trend from September 7, 2025, to November 23, 2025, shows a moderate increase of +1.59%, with a trend slope of 0.63, suggesting some deceleration in momentum. The stock has reached notable highs at 369.63 and lows at 104.93, with a standard deviation of 71.95 highlighting considerable volatility in its price movements.
Texas Instruments Incorporated (TXN), on the other hand, has faced a price decline of -6.49% over the past year, categorizing it as a bearish trend. The recent analysis reveals a more pronounced drop of -15.18% from September 7, 2025, to November 23, 2025, with a trend slope of -2.79, indicating a deceleration in price. The stock has fluctuated between a high of 221.25 and a low of 147.6, accompanied by a standard deviation of 16.86, reflecting a relatively stable but downward trajectory.
In summary, AVGO shows strong long-term growth potential despite recent deceleration, while TXN’s downtrend suggests caution for investors considering this stock for their portfolios.
Analyst Opinions
Recent ratings for Broadcom Inc. (AVGO) and Texas Instruments Incorporated (TXN) indicate a consensus “Buy” for both stocks. Analysts have given AVGO a “B” rating, highlighting strong return on equity and assets, though they note concerns regarding price-to-earnings metrics. TXN also received a “B” rating, with similar strengths in returns but slightly lower price-to-earnings scores. Analysts suggest that both companies are well-positioned for growth despite some valuation concerns, making them attractive options for investors in 2025.
Stock Grades
Recent stock ratings for Broadcom Inc. (AVGO) and Texas Instruments Incorporated (TXN) indicate a steady outlook from various reputable grading companies.
Broadcom Inc. Grades
| Grading Company | Action | New Grade | Date |
|---|---|---|---|
| Mizuho | maintain | Outperform | 2025-10-21 |
| UBS | maintain | Buy | 2025-10-14 |
| Morgan Stanley | maintain | Overweight | 2025-10-14 |
| Deutsche Bank | maintain | Buy | 2025-10-14 |
| Citigroup | maintain | Buy | 2025-10-14 |
| Barclays | maintain | Overweight | 2025-10-14 |
| Keybanc | maintain | Overweight | 2025-09-30 |
| Mizuho | maintain | Outperform | 2025-09-12 |
| Argus Research | maintain | Buy | 2025-09-08 |
| Oppenheimer | maintain | Outperform | 2025-09-05 |
Texas Instruments Incorporated Grades
| Grading Company | Action | New Grade | Date |
|---|---|---|---|
| Susquehanna | maintain | Positive | 2025-10-22 |
| Rosenblatt | maintain | Buy | 2025-10-22 |
| Truist Securities | maintain | Hold | 2025-10-22 |
| Wells Fargo | maintain | Equal Weight | 2025-10-22 |
| Goldman Sachs | maintain | Buy | 2025-10-22 |
| JP Morgan | maintain | Overweight | 2025-10-22 |
| Cantor Fitzgerald | maintain | Neutral | 2025-10-22 |
| Stifel | maintain | Hold | 2025-10-22 |
| TD Cowen | maintain | Buy | 2025-10-22 |
| Mizuho | downgrade | Underperform | 2025-10-20 |
Overall, both Broadcom and Texas Instruments maintain a favorable outlook, with numerous grades reaffirmed by analysts. Notably, Broadcom’s consistent “Outperform” and “Buy” ratings reflect strong confidence, while Texas Instruments shows a mix of ratings with a slight downgrade from Mizuho, indicating some caution in the market.
Target Prices
The consensus target prices from analysts for Broadcom Inc. and Texas Instruments Incorporated suggest optimistic growth expectations for both companies.
| Company | Target High | Target Low | Consensus |
|---|---|---|---|
| Broadcom Inc. (AVGO) | 460 | 295 | 401.73 |
| Texas Instruments Incorporated (TXN) | 245 | 145 | 190.45 |
Broadcom’s target consensus of 401.73 indicates a significant upside potential compared to its current price of 340.2. Similarly, Texas Instruments shows a target consensus of 190.45, compared to its current price of 159.4, reflecting positive analyst sentiment for both stocks.
Strengths and Weaknesses
Below is a comparative overview of the strengths and weaknesses of Broadcom Inc. (AVGO) and Texas Instruments Incorporated (TXN) based on the latest financial data.
| Criterion | Broadcom Inc. (AVGO) | Texas Instruments (TXN) |
|---|---|---|
| Diversification | High | Moderate |
| Profitability | Strong (net margin: 39.3%) | Strong (net margin: 37.2%) |
| Innovation | High | High |
| Global presence | Strong | Strong |
| Market Share | 14% | 20% |
| Debt level | Moderate (debt/equity: 1.65) | Low (debt/equity: 0.66) |
Key takeaways: Both companies exhibit strong profitability and innovation. However, Broadcom has a higher level of debt, while Texas Instruments maintains a larger market share and lower debt levels, which may appeal more to risk-averse investors.
Risk Analysis
Below is a table summarizing the key risks associated with Broadcom Inc. (AVGO) and Texas Instruments Incorporated (TXN).
| Metric | Broadcom Inc. | Texas Instruments |
|---|---|---|
| Market Risk | High | Moderate |
| Regulatory Risk | Moderate | High |
| Operational Risk | Moderate | Moderate |
| Environmental Risk | Moderate | Moderate |
| Geopolitical Risk | High | Moderate |
In summary, both companies face significant market and geopolitical risks, with Broadcom particularly exposed due to its global operations. Recent supply chain disruptions and regulatory scrutiny in the semiconductor sector present ongoing challenges.
Which one to choose?
When comparing Broadcom Inc. (AVGO) and Texas Instruments Incorporated (TXN), both companies have solid fundamentals, but they exhibit differing growth trajectories and market sentiments. AVGO has shown a bullish stock trend, with a remarkable price change of +204.76% over the last year, while TXN’s trend is bearish, reflecting a -6.49% change.
In terms of profit margins, AVGO outperforms TXN with a net profit margin of 11.43% compared to TXN’s 30.68%. However, AVGO’s high P/E ratio of 133.17 suggests it may be overvalued, whereas TXN’s P/E of 23.78 appears more reasonable.
For growth-focused investors, AVGO may seem appealing due to its recent performance, while those prioritizing stability and solid returns might favor TXN, given its consistent profit margins and lower valuation metrics.
Both companies face risks, particularly competition and market dependence, which could affect future profitability.
Disclaimer: This article is not financial advice. Each investor is responsible for their own investment decisions.
Go further
I encourage you to read the complete analyses of Broadcom Inc. and Texas Instruments Incorporated to enhance your investment decisions:


