Home > Comparison > Communication Services > NFLX vs WBD
The strategic rivalry between Netflix, Inc. and Warner Bros. Discovery, Inc. shapes the entertainment sector’s evolution. Netflix operates as a global streaming pioneer with a subscription-based model, while Warner Bros. Discovery combines traditional studios, networks, and direct-to-consumer platforms. This clash highlights a contest between pure digital innovation and diversified content production. This analysis aims to determine which business model offers the superior risk-adjusted return for a diversified portfolio in 2026.
Table of contents
Companies Overview
Netflix and Warner Bros. Discovery stand as pivotal forces reshaping global entertainment consumption.
Netflix, Inc.: Streaming Pioneer with Global Reach
Netflix dominates the streaming market with its subscription-based streaming model, offering TV series, films, documentaries, and mobile games to 222M paid members worldwide. Its core revenue derives from monthly fees paid by subscribers accessing content across internet-connected devices. In 2026, Netflix focuses sharply on expanding its content library and international penetration to sustain subscriber growth.
Warner Bros. Discovery, Inc.: Diversified Media Powerhouse
Warner Bros. Discovery operates through studios, networks, and direct-to-consumer (DTC) streaming, generating revenue from theatrical releases, TV licensing, and subscription streaming. Its content portfolio spans iconic franchises and diverse platforms, including HBO Max and Discovery+. In 2026, WBD emphasizes integrating its broad content assets to boost DTC subscriptions and leverage cross-platform synergies.
Strategic Collision: Similarities & Divergences
Both companies prioritize streaming as the battleground for market share, yet Netflix pursues growth through subscription scale and content breadth. WBD leverages a diversified content ecosystem spanning film, TV, and gaming, integrating legacy and digital assets. Their distinct strategies offer investors exposure to pure-play streaming versus a hybrid media conglomerate with varied revenue streams.
Income Statement Comparison
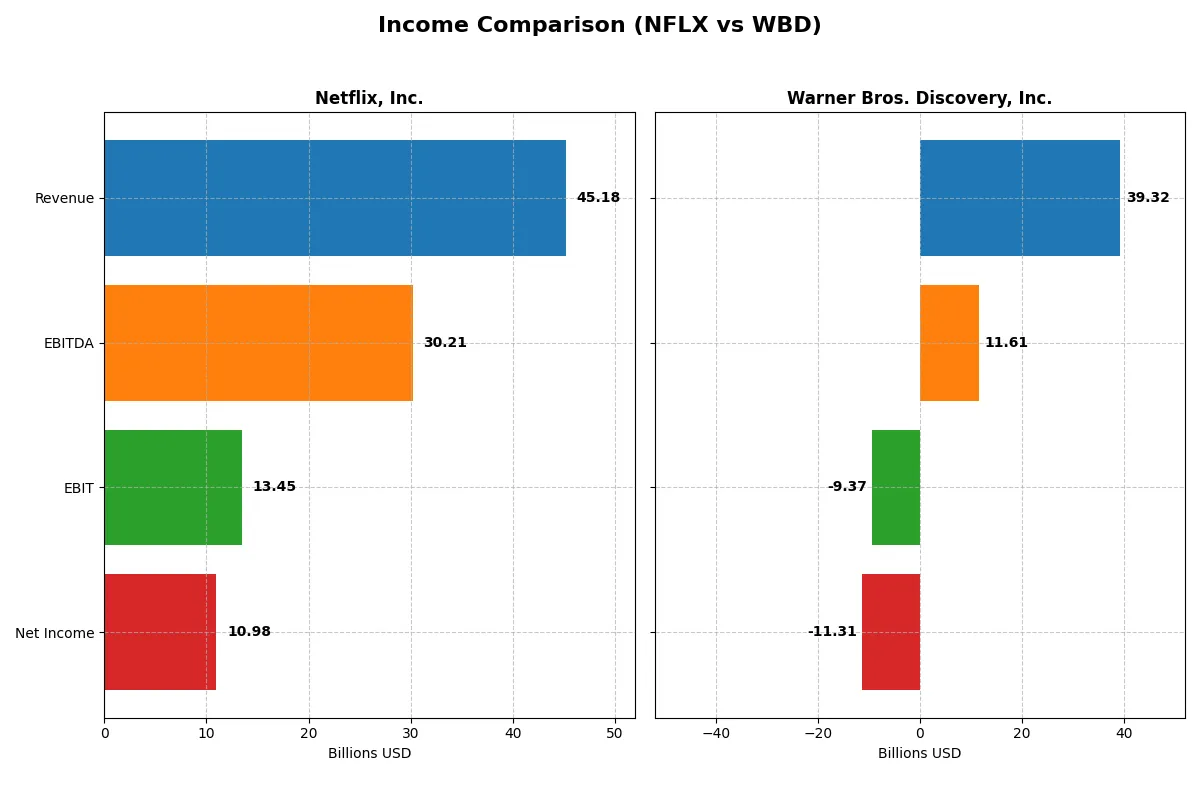
This data dissects the core profitability and scalability of both corporate engines to reveal who dominates the bottom line:
| Metric | Netflix, Inc. (NFLX) | Warner Bros. Discovery, Inc. (WBD) |
|---|---|---|
| Revenue | 45.2B | 39.3B |
| Cost of Revenue | 23.3B | 22.9B |
| Operating Expenses | 8.6B | 26.4B |
| Gross Profit | 21.9B | 16.4B |
| EBITDA | 30.2B | 11.6B |
| EBIT | 13.5B | -9.4B |
| Interest Expense | 0.78B | 2.0B |
| Net Income | 11.0B | -11.3B |
| EPS | 2.58 | -4.62 |
| Fiscal Year | 2025 | 2024 |
Income Statement Analysis: The Bottom-Line Duel
This income statement comparison reveals which company operates with superior financial efficiency and sustainable profitability.
Netflix, Inc. Analysis
Netflix’s revenue surged from $29.7B in 2021 to $45.2B in 2025, while net income more than doubled to $11B. Gross margin stands strong at 48.5%, and net margin improved to 24.3%. In 2025, Netflix’s efficient cost control and solid margin expansion demonstrate robust operational momentum.
Warner Bros. Discovery, Inc. Analysis
Warner Bros. Discovery’s revenue grew from $10.7B in 2020 to $39.3B in 2024 but with a net loss of $11.3B in 2024. Gross margin at 41.6% remains decent, but EBIT and net margins are deeply negative, reflecting operational challenges. The company’s deteriorating profitability signals weak efficiency despite top-line expansion.
Margin Excellence vs. Revenue Growth Struggles
Netflix delivers superior margin health and consistent net income growth, outperforming Warner Bros. Discovery’s volatile losses. Netflix’s profitability profile makes it the clear fundamental winner. Investors seeking operational discipline and sustainable earnings growth will find Netflix’s model more attractive.
Financial Ratios Comparison
These vital ratios act as a diagnostic tool to expose the underlying fiscal health, valuation premiums, and capital efficiency of the companies compared below:
| Ratios | Netflix, Inc. (NFLX) | Warner Bros. Discovery, Inc. (WBD) |
|---|---|---|
| ROE | 41.3% | -33.2% |
| ROIC | 25.2% | -11.0% |
| P/E | 36.1 | -2.3 |
| P/B | 14.9 | 0.76 |
| Current Ratio | 1.19 | 0.89 |
| Quick Ratio | 1.19 | 0.89 |
| D/E (Debt/Equity) | 0.54 | 1.16 |
| Debt-to-Assets | 26.0% | 37.8% |
| Interest Coverage | 17.2 | -5.0 |
| Asset Turnover | 0.81 | 0.38 |
| Fixed Asset Turnover | 22.5 | 6.46 |
| Payout ratio | 0 | 0 |
| Dividend yield | 0 | 0 |
| Fiscal Year | 2025 | 2024 |
Efficiency & Valuation Duel: The Vital Signs
Ratios act as a company’s DNA, exposing hidden risks and operational excellence critical to understanding its financial health.
Netflix, Inc.
Netflix delivers strong profitability with a 41.3% ROE and a robust 24.3% net margin, signaling efficient capital use. However, its valuation is stretched, reflected in a high P/E of 36.1 and P/B of 14.9. Netflix does not pay dividends, instead reinvesting heavily in R&D and growth to fuel future expansion.
Warner Bros. Discovery, Inc.
Warner Bros. Discovery struggles with negative profitability metrics, including a -33.2% ROE and -28.8% net margin, indicating operational challenges. The stock is attractively valued with a negative P/E and low P/B of 0.76. The company yields no dividends, likely focusing on restructuring and deleveraging efforts amid financial headwinds.
Profitability vs. Valuation: Growth or Value?
Netflix offers superior profitability but trades at a premium, reflecting investor confidence in its growth strategy. Warner Bros. Discovery presents a deeply discounted valuation but faces significant operational risks. Investors prioritizing growth may lean toward Netflix, while value seekers might consider Warner Bros. Discovery’s turnaround potential.
Which one offers the Superior Shareholder Reward?
Netflix (NFLX) and Warner Bros. Discovery (WBD) both forgo dividends, focusing instead on reinvestment and buybacks. Netflix maintains zero dividend payout but boasts robust free cash flow (FCF) of 2.24/share in 2025 and a disciplined buyback program, supporting a premium valuation (P/FCF ~42). Warner Bros. Discovery generates positive FCF (1.8/share in 2024) but suffers persistent net losses and heavy leverage (debt to market cap >1.5), limiting buyback capacity. Its low valuation multiples (P/FCF ~5.8) reflect risk. I observe Netflix’s capital allocation emphasizes growth and shareholder returns through buybacks, sustaining a high ROIC above WACC. Conversely, WBD’s distressed model and weak cash flow coverage raise sustainability concerns. I conclude Netflix offers superior total shareholder reward in 2026 due to stronger cash generation, prudent capital allocation, and a more sustainable buyback strategy.
Comparative Score Analysis: The Strategic Profile
The radar chart reveals the fundamental DNA and trade-offs of both firms, highlighting distinct strengths and vulnerabilities across key financial metrics:
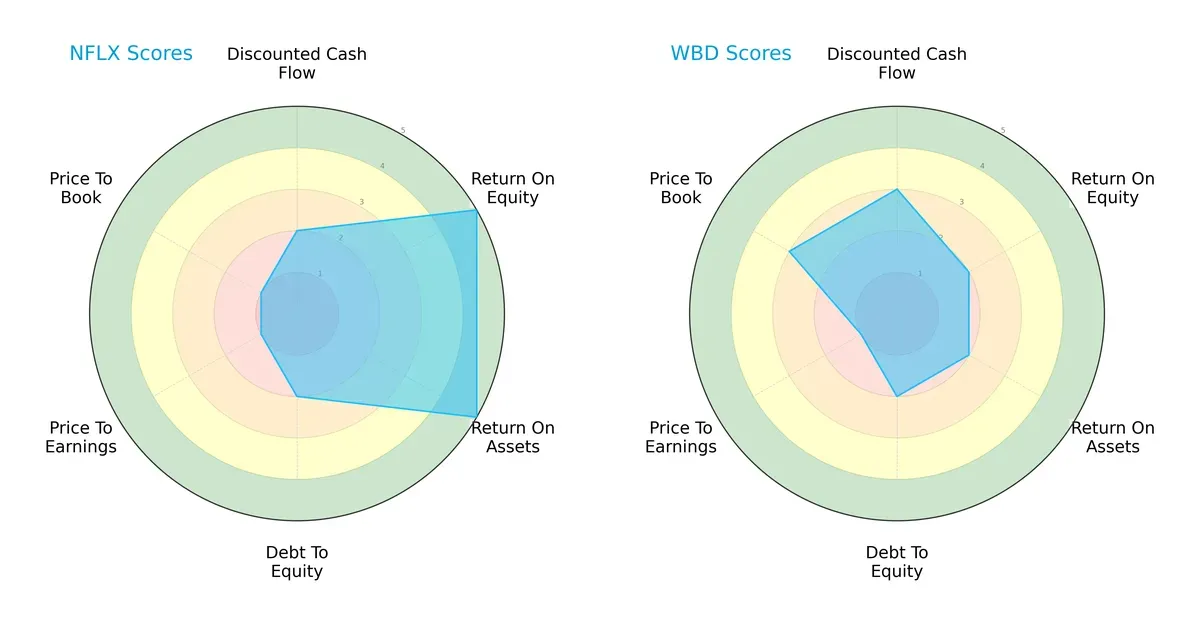
Netflix dominates in profitability metrics with very favorable ROE and ROA scores (5 each), signaling efficient capital and asset utilization. Warner Bros. Discovery shows a more balanced valuation approach with a moderate price-to-book score (3), whereas Netflix’s valuation scores are very unfavorable (1). Both have moderate debt-to-equity scores (2), indicating similar financial leverage risks. Overall, Netflix relies heavily on operational efficiency, while Warner Bros. Discovery presents a steadier but less profitable profile.
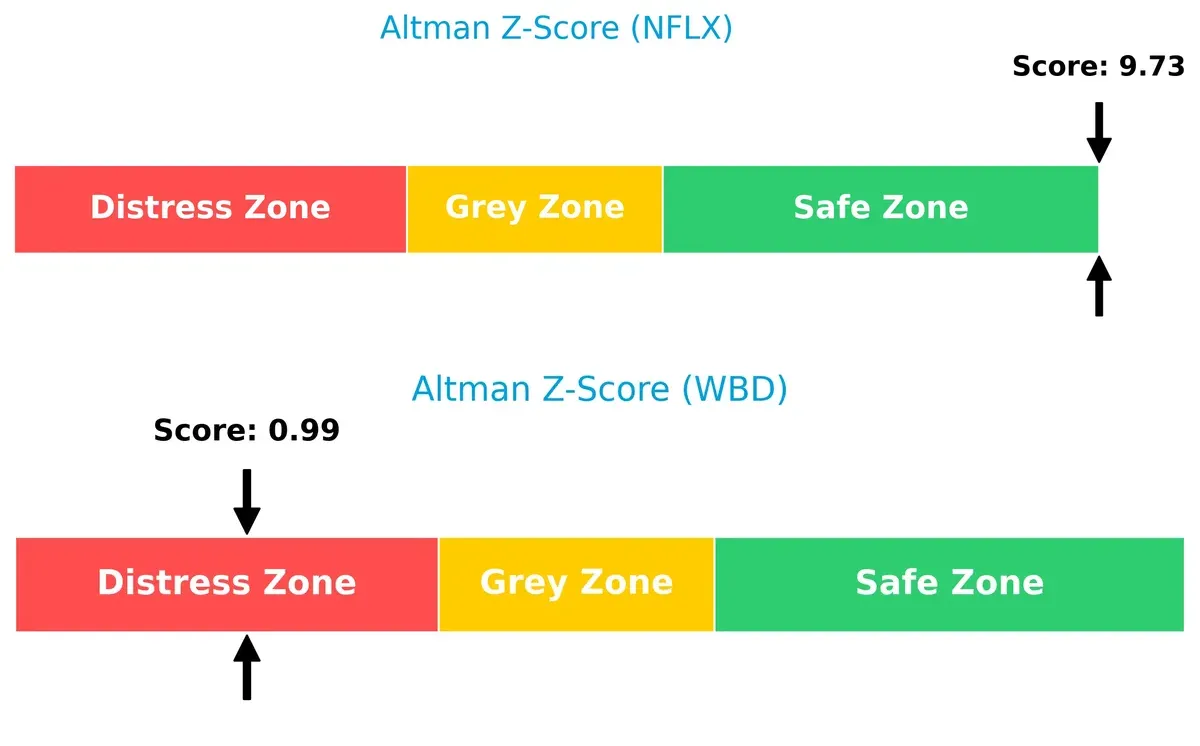
Bankruptcy Risk: Solvency Showdown
Netflix’s Altman Z-Score of 9.73 places it firmly in the safe zone, while Warner Bros. Discovery’s 0.99 signals distress, implying Netflix has a significantly stronger solvency outlook this cycle:
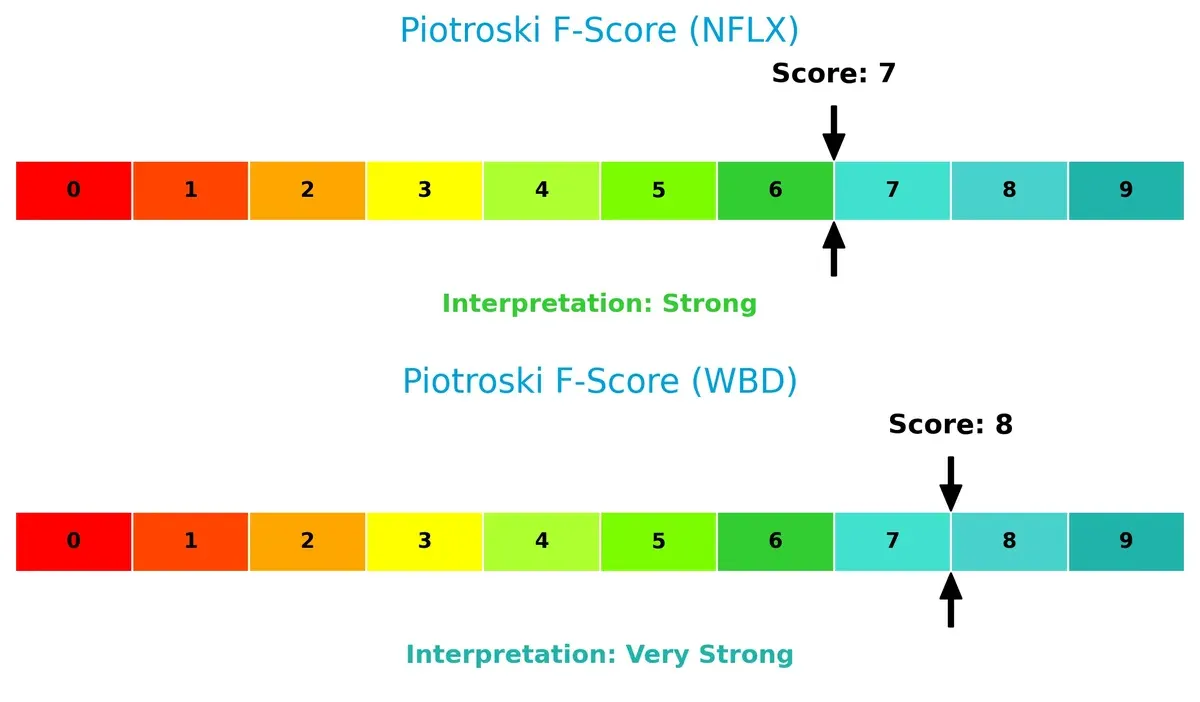
Financial Health: Quality of Operations
Warner Bros. Discovery edges Netflix with a Piotroski F-Score of 8 versus 7, suggesting slightly better internal financial health and operational quality. Netflix’s score is strong but may carry more risk in internal metrics:
How are the two companies positioned?
This section dissects Netflix and Warner Bros. Discovery’s operational DNA by comparing revenue distribution and internal dynamics. The goal is to confront their economic moats to identify the most resilient competitive advantage today.
Revenue Segmentation: The Strategic Mix
This comparison dissects how Netflix and Warner Bros. Discovery diversify their income streams and reveals where their primary sector bets lie:
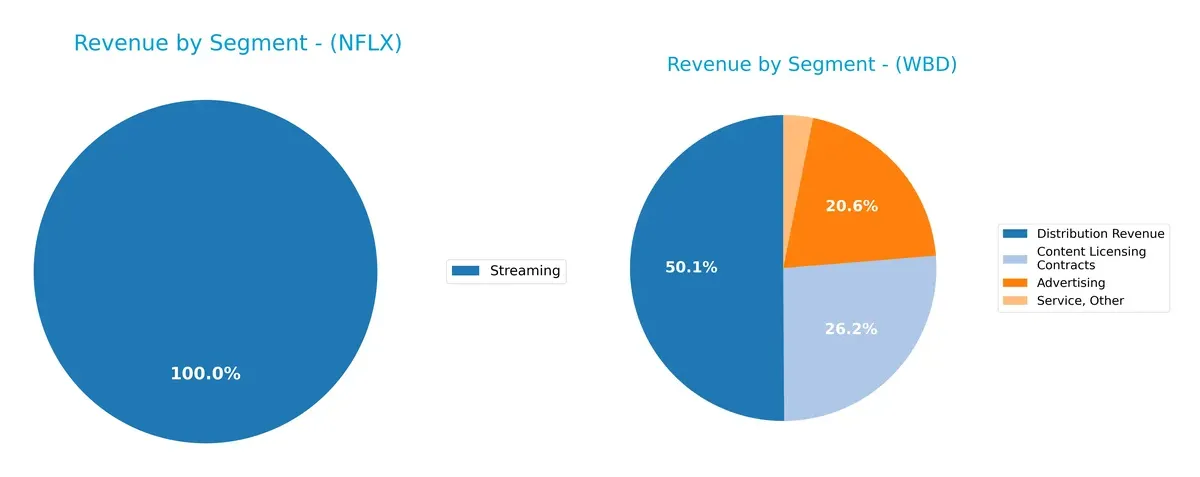
Netflix anchors almost entirely on streaming, generating $39B in 2024 with negligible DVD revenue, highlighting its focused digital entertainment model. Warner Bros. Discovery boasts a diversified mix with $19.7B from Distribution, $10.3B in Content Licensing, and $8.1B Advertising, reducing concentration risk. Netflix’s strategy pivots on ecosystem lock-in via proprietary content, while WBD leverages infrastructure dominance across multiple media channels, balancing growth and stability.
Strengths and Weaknesses Comparison
This table compares the strengths and weaknesses of Netflix, Inc. and Warner Bros. Discovery, Inc.:
Netflix Strengths
- Strong profitability with 24.3% net margin
- High ROE at 41.26%
- Favorable ROIC at 25.22%
- Low debt-to-assets at 26%
- High interest coverage at 17.33
- Diverse global revenue across US, EMEA, Latin America, Asia Pacific
Warner Bros. Discovery Strengths
- Favorable valuation metrics with low PE and PB ratios
- Diversified revenue streams including advertising, distribution, and content licensing
- Significant US market presence with $26.4B revenue
- Stable fixed asset turnover at 6.46
Netflix Weaknesses
- High WACC at 11.62%, above ROIC
- Unfavorable high PE at 36.11 and PB at 14.9
- No dividend yield
- Moderate current ratio at 1.19
- Revenue concentrated mostly in streaming segment
Warner Bros. Discovery Weaknesses
- Negative profitability with -28.77% net margin
- Negative ROE and ROIC
- High debt-to-equity at 1.16
- Low current and quick ratios
- Poor interest coverage and asset turnover
- No dividend yield
Netflix’s strengths lie in robust profitability and balanced global revenue, but elevated valuation and capital costs temper its profile. Warner Bros. Discovery shows diversified revenues and attractive valuation but suffers from poor profitability and financial stress, posing challenges for operational stability.
The Moat Duel: Analyzing Competitive Defensibility
A structural moat shields long-term profits from relentless competitive pressure. Without it, earnings erode rapidly, exposing firms to market volatility and value destruction:
Netflix, Inc.: Content Ecosystem & Scale Moat
Netflix leverages a vast global subscriber base and proprietary content, driving strong switching costs. Its 30%+ EBIT margin and rising ROIC confirm durable profitability. Expansion into interactive gaming in 2026 could deepen this moat further.
Warner Bros. Discovery, Inc.: Diverse Brand Portfolio Moat
WBD relies on a broad content library and multiple distribution channels, differing from Netflix’s scale focus. However, negative EBIT margins and declining ROIC signal weakening competitive strength. Strategic streaming consolidation offers a key turnaround opportunity.
Streaming Scale vs. Brand Depth: Netflix Holds the Edge
Netflix’s wide, growing ROIC and robust margins reveal a deeper moat than WBD’s struggling profitability and value destruction. Netflix appears better positioned to defend and expand its global market share in 2026.
Which stock offers better returns?
Over the past year, Netflix’s stock rose sharply by 31.94% before a recent decline, while Warner Bros. Discovery surged dramatically with accelerating gains, reflecting stronger bullish momentum.
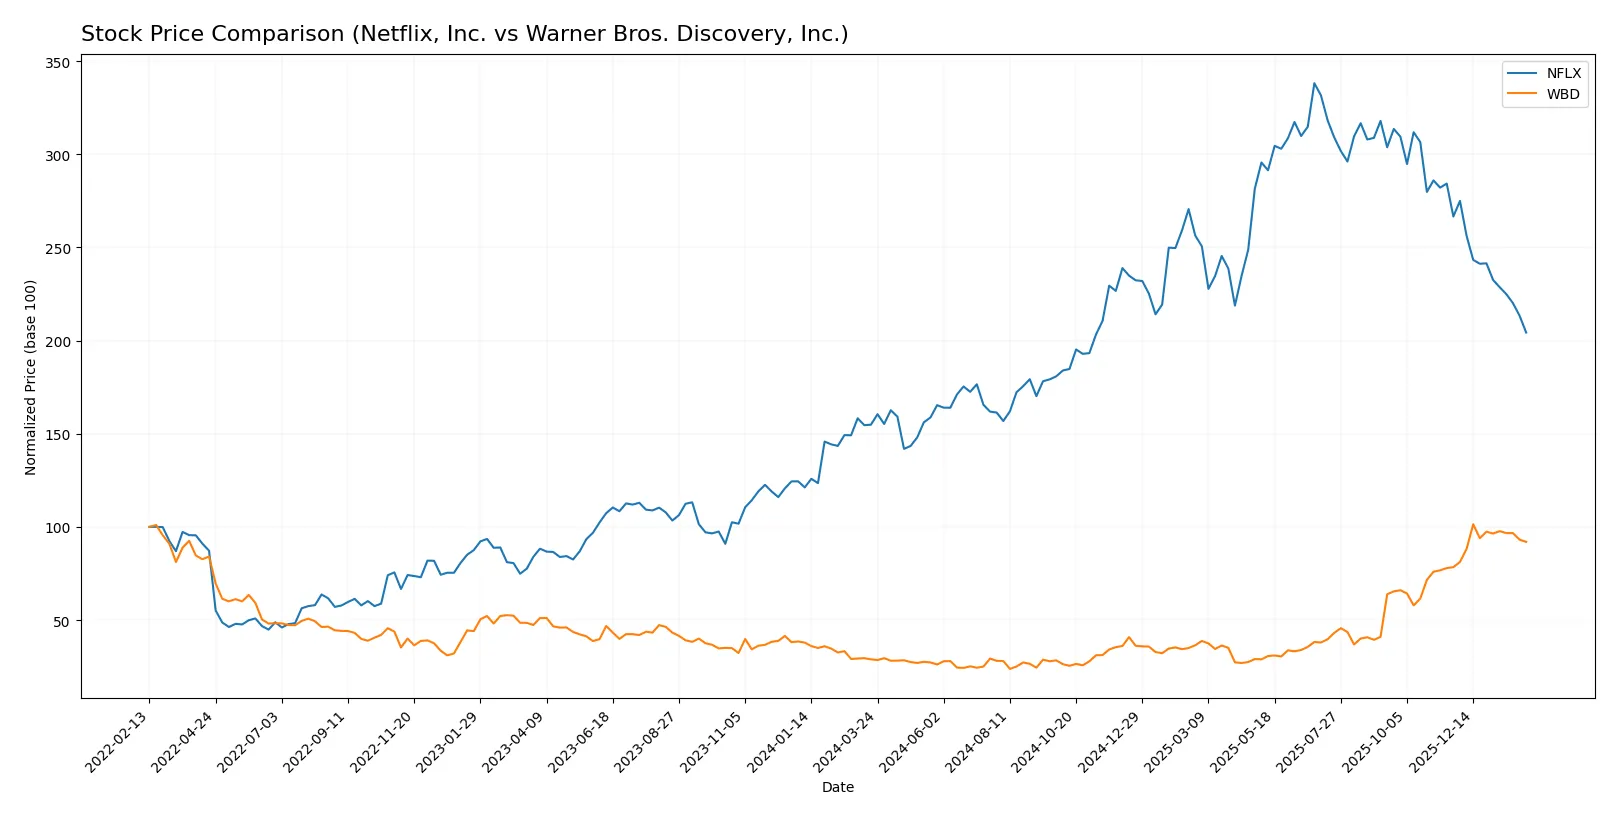
Trend Comparison
Netflix’s stock posted a 31.94% gain over the past 12 months, marking a bullish trend with decelerating growth. It reached a high of 132.31 and a low of 55.5, with notable volatility (22.19 std dev).
Warner Bros. Discovery’s stock soared 218.38% in the same period, showing bullish acceleration. It held a lower volatility (6.56 std dev), hitting highs near 30 and lows just above 7, indicating strong upward momentum.
Comparing trends, Warner Bros. Discovery delivered the highest market performance with sustained acceleration and a larger price increase than Netflix.
Target Prices
Analysts present a moderately optimistic consensus for Netflix, Inc. and Warner Bros. Discovery, Inc.
| Company | Target Low | Target High | Consensus |
|---|---|---|---|
| Netflix, Inc. | 95 | 152 | 117.25 |
| Warner Bros. Discovery, Inc. | 16 | 30 | 25.32 |
The consensus target for Netflix stands significantly above its current price of $79.94, suggesting upside potential. Warner Bros. Discovery’s target consensus slightly exceeds its current price of $27.19, indicating modest growth expectations.

Don’t Let Luck Decide Your Entry Point
Optimize your entry points with our advanced ProRealTime indicators. You’ll get efficient buy signals with precise price targets for maximum performance. Start outperforming now!
How do institutions grade them?
Here are the latest institutional grades for Netflix, Inc. and Warner Bros. Discovery, Inc.:
Netflix, Inc. Grades
The table below summarizes recent grades from reputable grading firms for Netflix, Inc.
| Grading Company | Action | New Grade | Date |
|---|---|---|---|
| Freedom Capital Markets | Upgrade | Buy | 2026-01-27 |
| Argus Research | Maintain | Buy | 2026-01-22 |
| Wedbush | Maintain | Outperform | 2026-01-21 |
| Deutsche Bank | Maintain | Hold | 2026-01-21 |
| Guggenheim | Maintain | Buy | 2026-01-21 |
| Wolfe Research | Maintain | Outperform | 2026-01-21 |
| Morgan Stanley | Maintain | Overweight | 2026-01-21 |
| Canaccord Genuity | Maintain | Buy | 2026-01-21 |
| Piper Sandler | Maintain | Overweight | 2026-01-21 |
| TD Cowen | Maintain | Buy | 2026-01-21 |
Warner Bros. Discovery, Inc. Grades
The table below lists recent institutional grades for Warner Bros. Discovery, Inc.
| Grading Company | Action | New Grade | Date |
|---|---|---|---|
| UBS | Maintain | Neutral | 2026-01-28 |
| Benchmark | Maintain | Buy | 2026-01-15 |
| Guggenheim | Maintain | Neutral | 2026-01-14 |
| Seaport Global | Downgrade | Neutral | 2025-12-09 |
| Benchmark | Maintain | Buy | 2025-12-08 |
| Barrington Research | Downgrade | Market Perform | 2025-12-05 |
| Barrington Research | Maintain | Outperform | 2025-11-14 |
| Wells Fargo | Maintain | Equal Weight | 2025-11-07 |
| Rothschild & Co | Upgrade | Buy | 2025-10-30 |
| Argus Research | Upgrade | Buy | 2025-10-28 |
Which company has the best grades?
Netflix, Inc. consistently receives strong buy and outperform ratings, indicating institutional confidence. Warner Bros. Discovery shows mixed grades with several neutral and downgrades. Investors may view Netflix’s higher grades as a sign of greater analyst conviction.
Risks specific to each company
The following categories identify critical pressure points and systemic threats facing Netflix, Inc. and Warner Bros. Discovery, Inc. in the 2026 market environment:
1. Market & Competition
Netflix, Inc.
- Dominates streaming with 222M members but faces intense competition and high content costs.
Warner Bros. Discovery, Inc.
- Diverse content portfolio but struggles with profitability amid fierce streaming and traditional media rivalry.
2. Capital Structure & Debt
Netflix, Inc.
- Moderate leverage (D/E 0.54), strong interest coverage (17.33), stable balance sheet.
Warner Bros. Discovery, Inc.
- High leverage (D/E 1.16), negative interest coverage (-4.65), signaling financial stress.
3. Stock Volatility
Netflix, Inc.
- Higher beta (1.71) indicates sensitivity to market swings but backed by strong fundamentals.
Warner Bros. Discovery, Inc.
- Slightly lower beta (1.62) but financial instability may increase downside risk.
4. Regulatory & Legal
Netflix, Inc.
- Faces regulatory scrutiny on content and data privacy globally.
Warner Bros. Discovery, Inc.
- Exposed to complex content licensing and antitrust risks in multiple jurisdictions.
5. Supply Chain & Operations
Netflix, Inc.
- Digital delivery model reduces supply chain risk but relies on stable internet infrastructure.
Warner Bros. Discovery, Inc.
- Operations fragmented across studios, networks, and DTC segments, increasing complexity and cost pressures.
6. ESG & Climate Transition
Netflix, Inc.
- Increasing focus on sustainable production; efforts underway but still evolving.
Warner Bros. Discovery, Inc.
- Larger carbon footprint due to extensive physical operations, requiring aggressive ESG measures.
7. Geopolitical Exposure
Netflix, Inc.
- Global reach with exposure to regulatory and censorship risks in 190 countries.
Warner Bros. Discovery, Inc.
- Significant international presence, vulnerable to geopolitical tensions affecting content distribution.
Which company shows a better risk-adjusted profile?
Netflix’s strongest risk lies in fierce market competition and content cost escalation, while Warner Bros. Discovery’s critical risk is its strained capital structure and negative profitability. Netflix’s safer balance sheet and superior profitability offer a better risk-adjusted profile. The stark contrast in interest coverage—Netflix at 17.33 versus WBD’s negative 4.65—justifies my caution on WBD’s financial health.
Final Verdict: Which stock to choose?
Netflix, Inc. wields a powerful moat through its consistently high return on invested capital, signaling efficient capital use and sustained competitive advantage. Its unmatched content delivery engine drives strong growth, though investors should monitor its premium valuation as a point of vigilance. It suits aggressive growth portfolios seeking durable profitability.
Warner Bros. Discovery, Inc. holds a strategic moat in its vast content library and potential for recurring revenue streams. While it currently faces profitability challenges, its lower valuation and recent price acceleration suggest a turnaround opportunity with a higher risk profile. It fits well with GARP investors focused on value and recovery potential.
If you prioritize durable profitability and proven capital efficiency, Netflix outshines with a very favorable moat and strong income growth. However, if you seek value in a turnaround narrative with a willingness to tolerate volatility, Warner Bros. Discovery offers better stability at a discount and accelerating momentum. Both cases require careful risk assessment aligned to investor appetite.
Disclaimer: Investment carries a risk of loss of initial capital. The past performance is not a reliable indicator of future results. Be sure to understand risks before making an investment decision.
Go Further
I encourage you to read the complete analyses of Netflix, Inc. and Warner Bros. Discovery, Inc. to enhance your investment decisions: