In the competitive landscape of non-alcoholic beverages, Coca-Cola Europacific Partners PLC (CCEP) and PepsiCo, Inc. (PEP) stand out as industry giants, each vying for consumer loyalty and market share. Both companies share a similar market space, focusing on innovative beverage solutions and extensive distribution networks. This article will delve into their strategies, financial health, and growth potential, helping you discern which company may be the more compelling investment opportunity.
Table of contents
Company Overview
Coca-Cola Europacific Partners PLC Overview
Coca-Cola Europacific Partners PLC (CCEP) operates as a leading beverage bottler, providing an extensive portfolio of non-alcoholic beverages. Founded in 1986 and headquartered in Uxbridge, UK, CCEP serves around 600M consumers, offering products under iconic brands such as Coca-Cola, Fanta, and Monster Energy. With a market capitalization of approximately $40.9B, the company is strategically positioned in the consumer defensive sector, focusing on sustainability and innovation in beverage production and distribution. CCEP’s commitment to quality and environmental stewardship reinforces its competitive edge in the beverage market.
PepsiCo, Inc. Overview
PepsiCo, Inc. is a global powerhouse in the food and beverage industry, with a diversified portfolio that spans snacks, cereals, and ready-to-drink beverages. Established in 1898 and based in Purchase, NY, PepsiCo has a market capitalization of about $199.8B. The company operates through multiple segments, including Frito-Lay and Quaker Foods, and serves consumers through a broad network, including e-commerce platforms. With a strong focus on health and wellness, PepsiCo is committed to sustainability and innovation, making it a formidable player in the non-alcoholic beverage market.
Key Similarities and Differences
Both CCEP and PepsiCo operate in the non-alcoholic beverage sector, but their business models differ significantly. CCEP primarily focuses on bottling and distribution, while PepsiCo combines food and beverage production across various segments. CCEP’s strength lies in its partnerships with Coca-Cola brands, whereas PepsiCo’s diverse portfolio spans multiple product categories, providing a broader market reach and revenue streams.
Income Statement Comparison
In this section, I present a comparison of the income statements for Coca-Cola Europacific Partners PLC (CCEP) and PepsiCo, Inc. (PEP) for the fiscal year 2024, highlighting key performance metrics.
| Metric | CCEP | PEP |
|---|---|---|
| Revenue | 20.44B | 91.85B |
| EBITDA | 3.27B | 16.68B |
| EBIT | 2.34B | 12.87B |
| Net Income | 1.42B | 9.58B |
| EPS | 3.08 | 6.98 |
Interpretation of Income Statement
The revenue for CCEP increased from 18.30B in 2023 to 20.44B in 2024, reflecting a solid growth trajectory despite market challenges. Meanwhile, PEP’s revenue saw a slight increase, maintaining a robust position in the market. CCEP’s net income decreased from 1.67B to 1.42B, indicating pressure on margins, possibly due to rising operational costs. Conversely, PEP’s net income remains strong, showcasing effective cost management and operational efficiency. Overall, both companies exhibit resilience, but CCEP’s decline in net income highlights the need for tighter cost control and strategic adjustments to sustain growth.
Financial Ratios Comparison
The table below compares the most recent revenue and financial ratios for Coca-Cola Europacific Partners PLC (CCEP) and PepsiCo, Inc. (PEP):
| Metric | CCEP | PEP |
|---|---|---|
| ROE | 16.70% | 53.09% |
| ROIC | 6.53% | 13.73% |
| P/E | 24.08 | 21.80 |
| P/B | 4.02 | 12.63 |
| Current Ratio | 0.81 | 0.85 |
| Quick Ratio | 0.62 | 0.65 |
| D/E | 1.33 | 2.49 |
| Debt-to-Assets | 36.43% | 44.44% |
| Interest Coverage | 8.81 | 14.02 |
| Asset Turnover | 0.66 | 0.92 |
| Fixed Asset Turnover | 3.18 | 2.93 |
| Payout Ratio | 64.17% | 73.64% |
| Dividend Yield | 2.66% | 3.46% |
Interpretation of Financial Ratios
CCEP’s return on equity (ROE) is significantly lower than PEP’s, indicating less efficiency in generating profits from equity. The current and quick ratios suggest both companies have similar liquidity positions, but CCEP has a higher debt-to-equity ratio, indicating a greater reliance on debt financing. PEP’s higher interest coverage ratio reflects a stronger ability to meet interest obligations. Overall, PEP appears more robust, but CCEP’s performance is improving and should be monitored closely.
Dividend and Shareholder Returns
Coca-Cola Europacific Partners PLC (CCEP) pays dividends with a payout ratio of 64.2%, offering a dividend yield of 2.66% and a consistent increase in dividend per share over recent years. The company also engages in share buybacks, albeit with potential risks of unsustainable distributions. Conversely, PepsiCo, Inc. (PEP) boasts a higher payout ratio of 75.5%, yielding 3.46% and also utilizes share repurchase programs. Both companies demonstrate a commitment to returning value to shareholders, which supports sustainable long-term value creation.
Strategic Positioning
Coca-Cola Europacific Partners PLC (CCEP) and PepsiCo, Inc. (PEP) operate in a fiercely competitive non-alcoholic beverage market. As of now, PEP leads with a market cap of approximately 200B, while CCEP trails at about 41B. Both companies face competitive pressure due to emerging health trends and consumer preferences shifting towards healthier options. Technological disruptions, such as enhanced distribution channels and e-commerce, further reshape the landscape, demanding agility and innovation to maintain market share.
Stock Comparison
In this section, I will analyze the stock price movements of Coca-Cola Europacific Partners PLC (CCEP) and PepsiCo, Inc. (PEP) over the past year, highlighting significant fluctuations and trading dynamics that could impact investor decisions.
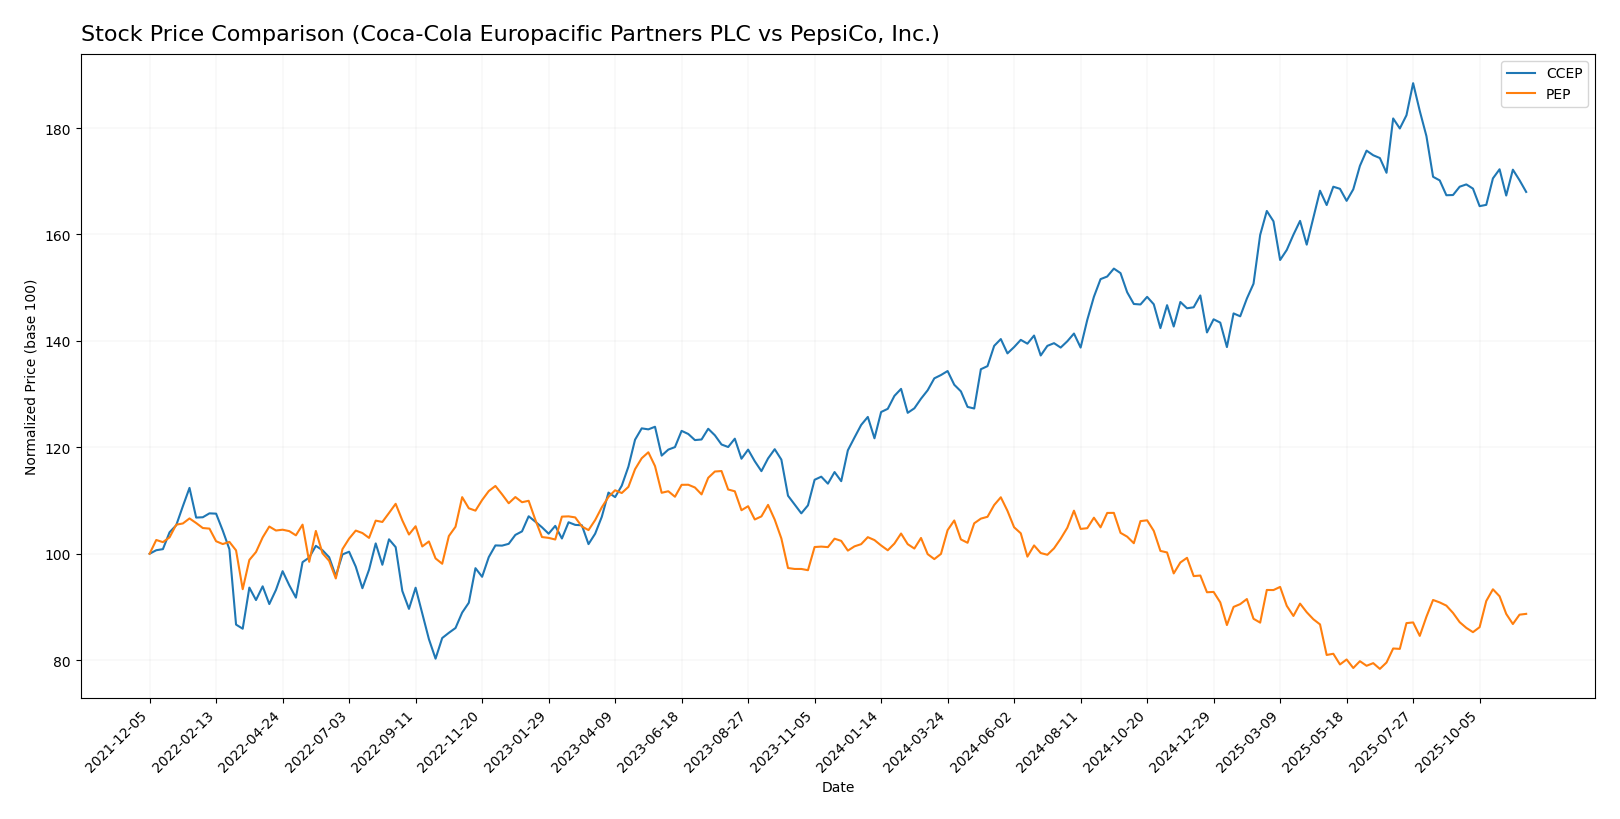
Trend Analysis
1. Coca-Cola Europacific Partners PLC (CCEP) Over the past year, CCEP has experienced a price change of +33.64%. This indicates a bullish trend. Notably, the stock reached a high of 100.04 and a low of 64.61, suggesting considerable volatility with a standard deviation of 8.81. Currently, the trend shows signs of deceleration, as the recent price change is only +0.35% over the past 2.5 months, with a lower standard deviation of 1.15, indicating reduced volatility.
2. PepsiCo, Inc. (PEP) In stark contrast, PEP has seen a price change of -13.98% over the past year, which confirms a bearish trend. The stock’s price fluctuated between a high of 182.19 and a low of 129.07, displaying a higher volatility with a standard deviation of 14.75. The recent trend reflects a slight decline of -0.2% over the same 2.5 months, with a standard deviation of 3.95, suggesting a slight acceleration in the bearish trend.
In summary, while CCEP is positioned well with a bullish trend, PEP is facing challenges that could deter potential investors.
Analyst Opinions
Recent analyst recommendations for Coca-Cola Europacific Partners PLC (CCEP) and PepsiCo, Inc. (PEP) indicate a consensus “Buy” rating for both companies. Analysts highlight CCEP’s strong discounted cash flow and return on equity, resulting in a B+ rating. Similarly, PEP received a B+ rating, praised for its superior return on assets and equity. Notable analysts suggest that both companies are well-positioned for growth, despite market challenges. I believe investors should consider these insights when evaluating their portfolios for the current year.
Stock Grades
In this section, I present the latest stock grades for Coca-Cola Europacific Partners PLC (CCEP) and PepsiCo, Inc. (PEP), as provided by recognized grading companies.
Coca-Cola Europacific Partners PLC Grades
| Grading Company | Action | New Grade | Date |
|---|---|---|---|
| Barclays | maintain | Overweight | 2025-08-08 |
| Barclays | maintain | Overweight | 2025-07-15 |
| UBS | maintain | Buy | 2025-07-02 |
| Barclays | maintain | Overweight | 2025-05-01 |
| UBS | maintain | Buy | 2025-04-30 |
| Barclays | maintain | Overweight | 2025-04-11 |
| Barclays | maintain | Overweight | 2025-03-27 |
| Barclays | maintain | Overweight | 2025-03-06 |
| Evercore ISI Group | maintain | Outperform | 2025-02-18 |
| UBS | maintain | Buy | 2025-02-17 |
PepsiCo, Inc. Grades
| Grading Company | Action | New Grade | Date |
|---|---|---|---|
| Freedom Capital Markets | downgrade | Hold | 2025-10-23 |
| Wells Fargo | maintain | Equal Weight | 2025-10-10 |
| JP Morgan | maintain | Neutral | 2025-10-06 |
| Barclays | maintain | Equal Weight | 2025-10-03 |
| Citigroup | maintain | Buy | 2025-09-25 |
| Wells Fargo | maintain | Equal Weight | 2025-09-25 |
| UBS | maintain | Buy | 2025-09-11 |
| RBC Capital | maintain | Sector Perform | 2025-09-03 |
| Barclays | maintain | Equal Weight | 2025-07-21 |
| Citigroup | maintain | Buy | 2025-07-18 |
Overall, CCEP maintains strong ratings with consistent “Overweight” and “Buy” grades, indicating solid investor confidence. In contrast, PEP has seen a recent downgrade to “Hold,” reflecting a shift in sentiment, although several analysts still maintain positive ratings. This suggests a mixed outlook for PEP, warranting careful consideration for potential investors.
Target Prices
The latest consensus target prices for Coca-Cola Europacific Partners PLC (CCEP) and PepsiCo, Inc. (PEP) indicate optimistic expectations from analysts.
| Company | Target High | Target Low | Consensus |
|---|---|---|---|
| Coca-Cola Europacific Partners PLC (CCEP) | 98 | 46.22 | 74.69 |
| PepsiCo, Inc. (PEP) | 164 | 140 | 150.5 |
Analysts have set a consensus target price of 74.69 for CCEP, which is a potential upside from its current price of 89.19. For PEP, the consensus target is 150.5, suggesting room for growth from its current price of 146.1.
Strengths and Weaknesses
The following table outlines the strengths and weaknesses of Coca-Cola Europacific Partners PLC (CCEP) and PepsiCo, Inc. (PEP) based on the latest financial data.
| Criterion | CCEP | PEP |
|---|---|---|
| Diversification | Moderate | High |
| Profitability | Moderate | High |
| Innovation | Moderate | High |
| Global presence | Strong | Very Strong |
| Market Share | 13% | 20% |
| Debt level | High | Very High |
Key takeaways indicate that while PepsiCo exhibits higher profitability and innovation, Coca-Cola Europacific Partners maintains a strong market presence. However, both companies have notable levels of debt, with CCEP’s being relatively high.
Risk Analysis
The table below outlines key risks associated with Coca-Cola Europacific Partners PLC (CCEP) and PepsiCo, Inc. (PEP) as of the most recent fiscal year.
| Metric | CCEP | PEP |
|---|---|---|
| Market Risk | Moderate | High |
| Regulatory Risk | Moderate | High |
| Operational Risk | Low | Moderate |
| Environmental Risk | Moderate | High |
| Geopolitical Risk | High | Moderate |
Both companies face significant market and regulatory risks, particularly in evolving consumer preferences and potential regulatory changes. In 2023, PepsiCo’s revenue per share was significantly impacted by fluctuating commodity prices, emphasizing the importance of risk management in their operations.
Which one to choose?
In comparing Coca-Cola Europacific Partners PLC (CCEP) and PepsiCo, Inc. (PEP), both companies exhibit solid financial performance but diverge in key areas. CCEP’s gross profit margin stands at 36% with a net profit margin of 7%, while PEP boasts a higher gross margin of 55% and net margin at 10%. Valuation ratios show CCEP with a P/E of 24.1 compared to PEP’s 25.8, which suggests CCEP may offer better value. Both companies received a rating of B+, indicating comparable investment quality. However, CCEP’s stock trend is bullish, with a 33.6% price increase, while PEP’s is bearish, down 14%.
Investors seeking growth may prefer CCEP due to its upward momentum, while those valuing stability might favor PEP for its robust margins.
Specific risks include competitive pressures and supply chain vulnerabilities impacting both companies.
Disclaimer: This article is not financial advice. Each investor is responsible for their own investment decisions.
Go further
I encourage you to read the complete analyses of Coca-Cola Europacific Partners PLC and PepsiCo, Inc. to enhance your investment decisions: