In the rapidly evolving world of technology, two giants stand out: International Business Machines Corporation (IBM) and Oracle Corporation. Both companies are key players in the information technology sector, focusing on innovative software and infrastructure solutions. Their overlapping markets, particularly in cloud computing and enterprise services, make this comparison particularly relevant. As we delve into their strategies and performances, I aim to guide you in determining which company presents a more compelling investment opportunity.

Table of contents
Company Overview
IBM Overview
International Business Machines Corporation (IBM) is a leading player in the information technology services sector, with a market capitalization of approximately $274B. IBM’s mission is to provide integrated solutions and services worldwide, focusing on hybrid cloud and artificial intelligence. The company operates through four segments: Software, Consulting, Infrastructure, and Financing. Their software offerings include enterprise open-source solutions and data analytics, while consulting services emphasize business transformation and technology integration. Founded in 1911 and headquartered in Armonk, New York, IBM employs around 270K people and remains a stalwart in the tech landscape, adapting continuously to market demands.
Oracle Overview
Oracle Corporation, with a market capitalization of about $611B, is a prominent provider of cloud-based software and infrastructure solutions. Established in 1977 and based in Austin, Texas, Oracle’s mission revolves around delivering comprehensive enterprise IT solutions. Its offerings include cloud applications, database technologies, and hardware systems. The company is known for its robust cloud software as a service portfolio, which encompasses various enterprise resource planning and human capital management applications. With approximately 159K employees, Oracle is committed to innovation and customer service across diverse industries.
Key Similarities and Differences
Both IBM and Oracle operate within the technology sector, focusing on integrated solutions and enterprise services. However, while IBM emphasizes a broader consulting approach along with hybrid cloud solutions, Oracle is more concentrated on cloud-based applications and database technologies. Their different business models reflect distinct market strategies, with IBM leaning towards comprehensive business transformations and Oracle focusing on software-driven infrastructure solutions.
Income Statement Comparison
Below is a comparative overview of the most recent annual income statements for IBM and Oracle, highlighting their financial performance for better investment decisions.
| Metric | IBM | Oracle |
|---|---|---|
| Revenue | 63.75B | 57.40B |
| EBITDA | 12.18B | 23.91B |
| EBIT | 7.51B | 17.74B |
| Net Income | 6.02B | 12.44B |
| EPS | 6.53 | 4.46 |
Interpretation of Income Statement
In the latest fiscal year, IBM’s revenue increased marginally from 61.86B to 63.75B, indicating stable growth. However, its net income saw a decline from 7.50B to 6.02B, reflecting pressure on margins. Conversely, Oracle demonstrated robust performance with a significant revenue increase from 52.96B to 57.40B, alongside a net income rise from 10.47B to 12.44B. This suggests improved operational efficiency and strong demand for its products. Overall, while IBM shows resilience, Oracle’s performance signals a stronger growth trajectory, making it a potentially more attractive investment.
Financial Ratios Comparison
In this section, I present a comparative analysis of the most recent revenue and key financial ratios for IBM and Oracle. This will help you understand their financial health and make informed investment decisions.
| Metric | IBM | ORCL |
|---|---|---|
| ROE | 22.06% | 60.84% |
| ROIC | 9.51% | 10.86% |
| P/E | 34.21 | 37.10 |
| P/B | 7.54 | 22.57 |
| Current Ratio | 1.04 | 0.75 |
| Quick Ratio | 1.00 | 0.75 |
| D/E | 2.14 | 5.09 |
| Debt-to-Assets | 0.43 | 0.67 |
| Interest Coverage | 5.88 | 4.94 |
| Asset Turnover | 0.46 | 0.34 |
| Fixed Asset Turnover | 7.03 | 1.32 |
| Payout Ratio | 102.06% | 38.12% |
| Dividend Yield | 2.98% | 1.03% |
Interpretation of Financial Ratios
IBM exhibits solid metrics with a reasonable ROE and a manageable debt level, although its P/E ratio suggests the stock might be overvalued. In contrast, Oracle shows exceptional ROE but carries significantly higher debt, which raises concerns about financial stability. Both companies have strong asset turnover ratios, indicating efficient use of assets. However, Oracle’s lower current and quick ratios may signal liquidity risks. Investors should weigh these factors carefully before making decisions.
Dividend and Shareholder Returns
International Business Machines Corporation (IBM) pays dividends with a current yield of 2.98% and a payout ratio of 102%. However, this high payout raises concerns about sustainability given the reliance on free cash flow. In contrast, Oracle Corporation (ORCL) offers a lower dividend yield of 1.03% and maintains a payout ratio of 38%, positioning itself for growth while engaging in share buybacks. Overall, IBM’s dividend strategy may pose risks, while Oracle’s approach appears to support long-term value creation.
Strategic Positioning
In the competitive landscape of the technology sector, IBM holds a market cap of $274B, focusing on integrated solutions across software and consulting. Its hybrid cloud offerings position it strongly against Oracle, which commands a $611B market cap with robust cloud-based enterprise solutions. Both companies face significant competitive pressure, with rapid technological advancements driving innovation. Disruptive technologies, particularly in AI and cloud computing, heighten the urgency for strategic adaptation to maintain market share.
Stock Comparison
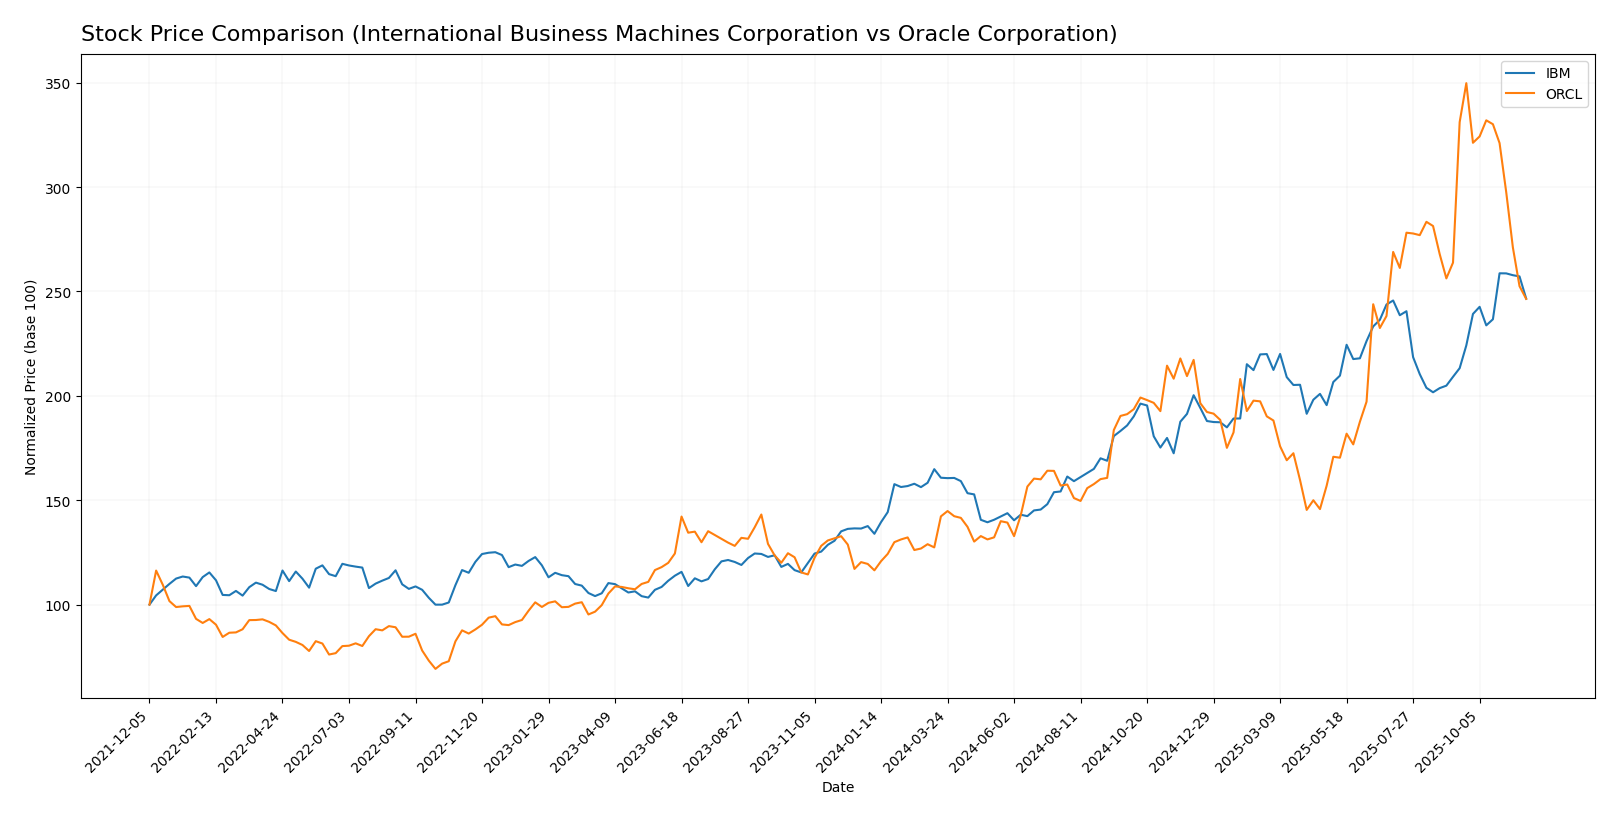
In this section, I will analyze the weekly stock price movements of IBM and Oracle over the past year, focusing on key price dynamics and overall trends.

Trend Analysis
IBM (International Business Machines Corporation) Over the past year, IBM’s stock has experienced a remarkable price change of +79.2%. This indicates a bullish trend, with the highest price reaching 307.46 and the lowest at 159.16. The trend shows acceleration, and the standard deviation of 40.65 suggests notable volatility. Recently, from September 7, 2025, to November 23, 2025, the stock price increased by +17.93%, maintaining a positive slope of 4.95.
ORCL (Oracle Corporation) In contrast, Oracle’s stock has seen a significant price increase of +106.27% over the past year, also indicating a bullish trend. The stock reached a high of 308.66 and a low of 102.73, but the trend is currently decelerating, with a standard deviation of 51.82 reflecting increased volatility. However, in the recent period from September 7, 2025, to November 23, 2025, Oracle’s stock has declined by -6.59%, along with a negative slope of -4.87, indicating a shift in market sentiment.
In summary, while both companies have shown strong overall performance over the year, IBM is currently on an upward trajectory, whereas Oracle is facing recent challenges. As always, I encourage careful consideration of these trends in the context of your investment strategies.
Analyst Opinions
Recent analyst recommendations for IBM and Oracle reflect a cautiously optimistic outlook. Analysts have rated IBM with a “B,” indicating a buy position due to strong return on equity and assets. Conversely, Oracle received a “B-” rating, suggesting a hold, primarily due to lower scores in price-to-earnings and price-to-book metrics. While both companies show potential, the consensus leans towards a buy for IBM and a hold for Oracle in 2025. I recommend monitoring these stocks closely, considering their individual strengths and market conditions.
Stock Grades
In the latest evaluations from credible grading companies, both IBM and Oracle have maintained their respective ratings, reflecting a stable outlook for investors.
IBM Grades
| Grading Company | Action | New Grade | Date |
|---|---|---|---|
| RBC Capital | maintain | Outperform | 2025-10-23 |
| Morgan Stanley | maintain | Equal Weight | 2025-10-23 |
| BMO Capital | maintain | Market Perform | 2025-10-23 |
| B of A Securities | maintain | Buy | 2025-10-23 |
| UBS | maintain | Sell | 2025-10-23 |
| Stifel | maintain | Buy | 2025-10-23 |
| Jefferies | maintain | Hold | 2025-10-21 |
Oracle Grades
| Grading Company | Action | New Grade | Date |
|---|---|---|---|
| Baird | maintain | Outperform | 2025-11-18 |
| RBC Capital | maintain | Sector Perform | 2025-10-17 |
| Piper Sandler | maintain | Overweight | 2025-10-17 |
| Guggenheim | maintain | Buy | 2025-10-17 |
| Scotiabank | maintain | Sector Outperform | 2025-10-17 |
| Stephens & Co. | maintain | Equal Weight | 2025-10-17 |
| Barclays | maintain | Overweight | 2025-10-17 |
| UBS | maintain | Buy | 2025-10-17 |
| Evercore ISI Group | maintain | Outperform | 2025-10-17 |
| Jefferies | maintain | Buy | 2025-10-17 |
Overall, the grades for both companies indicate a cautious but positive sentiment. IBM is facing a mixed outlook with a significant number of “Maintain” ratings, while Oracle shows a strong position with multiple “Outperform” and “Buy” recommendations. This trend suggests potential stability and growth, albeit with varying degrees of investor confidence.
Target Prices
The consensus target prices for IBM and Oracle indicate a positive outlook from analysts.
| Company | Target High | Target Low | Consensus |
|---|---|---|---|
| IBM | 305 | 210 | 277.83 |
| ORCL | 400 | 135 | 336.9 |
For IBM, the target consensus of 277.83 is slightly below its current price of 293.21, suggesting a potential for slight downside. In contrast, Oracle’s consensus of 336.9 indicates a favorable upside from its current price of 217.82, highlighting a stronger analyst sentiment.
Strengths and Weaknesses
The following table outlines the strengths and weaknesses of International Business Machines Corporation (IBM) and Oracle Corporation (ORCL) based on the latest data.
| Criterion | IBM | ORCL |
|---|---|---|
| Diversification | Moderate | High |
| Profitability | 9.60% | 21.68% |
| Innovation | Strong | Strong |
| Global presence | Extensive | Extensive |
| Market Share | 6.5% | 20% |
| Debt level | High | Very High |
Key takeaways indicate that while both companies exhibit strong innovation and global presence, Oracle stands out with significantly higher profitability and market share. However, both companies carry a substantial debt load, warranting careful consideration in investment decisions.
Risk Analysis
In the following table, I outline the key risks associated with International Business Machines Corporation (IBM) and Oracle Corporation (ORCL).
| Metric | IBM | ORCL |
|---|---|---|
| Market Risk | Moderate | High |
| Regulatory Risk | High | Moderate |
| Operational Risk | Moderate | High |
| Environmental Risk | Moderate | Low |
| Geopolitical Risk | High | High |
Both IBM and Oracle face considerable market and regulatory risks. IBM, with a significant debt-to-equity ratio of 2.14, may struggle under changing regulations. Oracle’s high leverage and market volatility can amplify risks, particularly in the current economic climate.
Which one to choose?
When comparing International Business Machines Corporation (IBM) and Oracle Corporation (ORCL), both companies exhibit strong fundamentals, yet they cater to different investor preferences. IBM shows a solid gross profit margin of 57% and a decent net profit margin of 10%, while ORCL boasts a higher gross profit margin of 70% and a net profit margin of 22%. However, IBM’s price-to-earnings (P/E) ratio stands at 34.21, indicating a higher valuation compared to ORCL’s 37.10.
Analyst ratings suggest IBM receives a “B” grade, while ORCL holds a “B-” rating. IBM’s stock trend is bullish with a 79.2% price change over the last year, whereas ORCL’s recent trend indicates a 106.27% increase but has slowed down recently.
Investors seeking growth may prefer ORCL due to its higher profit margins and growth potential, while those valuing stability might consider IBM, which has shown consistent profit performance.
Disclaimer: This article is not financial advice. Each investor is responsible for their own investment decisions.
Go further
I encourage you to read the complete analyses of International Business Machines Corporation and Oracle Corporation to enhance your investment decisions:


