In the ever-evolving semiconductor industry, two giants stand out: Broadcom Inc. (AVGO) and NXP Semiconductors N.V. (NXPI). These companies not only share market space but also a commitment to innovation and technology solutions that drive various sectors, from telecommunications to automotive. With their unique strategies and product offerings, I will analyze which of these companies presents a more compelling investment opportunity. Join me as we explore the intricacies of both firms to identify the better choice for your portfolio.

Table of contents
Company Overview
Broadcom Inc. Overview
Broadcom Inc. (AVGO) is a global technology leader specializing in semiconductor and infrastructure software solutions. Headquartered in San Jose, California, the company employs approximately 37K individuals and operates through four main segments: Wired Infrastructure, Wireless Communications, Enterprise Storage, and Industrial & Other. Broadcom’s extensive product portfolio serves a wide range of applications, including enterprise networking, telecommunications, and consumer electronics. With a market cap of $1.67T and a current share price of $356.35, Broadcom is well-positioned in the semiconductor industry, leveraging its comprehensive technology stack to meet the evolving demands of its diverse customer base.
NXP Semiconductors N.V. Overview
NXP Semiconductors N.V. (NXPI), headquartered in Eindhoven, the Netherlands, offers a diverse array of semiconductor products that cater to automotive, industrial, and Internet of Things (IoT) applications. With a workforce of around 33K and a market cap of $47.12B, NXP’s product offerings range from microcontrollers to wireless connectivity solutions, including Bluetooth, NFC, and Wi-Fi technologies. Their innovative solutions are marketed to original equipment manufacturers and distributors globally. The company’s share price stands at $187.22, reflecting its strategic positioning within the competitive semiconductor landscape.
Key Similarities and Differences
Both Broadcom and NXP Semiconductors operate within the semiconductor industry, focusing on providing essential components for technology applications. However, Broadcom leans heavily towards infrastructure and communication solutions, while NXP emphasizes automotive and IoT technologies. This distinction highlights their unique approaches to market demands, catering to different segments within the tech ecosystem.
Income Statement Comparison
The following table provides a comparative overview of the most recent income statements for Broadcom Inc. (AVGO) and NXP Semiconductors N.V. (NXPI), highlighting key financial metrics.
| Metric | Broadcom Inc. (AVGO) | NXP Semiconductors N.V. (NXPI) |
|---|---|---|
| Revenue | 51.57B | 12.61B |
| EBITDA | 23.88B | 4.42B |
| EBIT | 13.87B | 3.50B |
| Net Income | 5.90B | 2.51B |
| EPS | 1.27 | 9.84 |
Interpretation of Income Statement
In the latest fiscal year, Broadcom experienced substantial revenue growth, increasing from 35.82B to 51.57B, while NXP’s revenue decreased slightly from 13.28B to 12.61B. Broadcom’s net income dropped significantly from 14.08B to 5.90B, highlighting potential pressure on margins, evidenced by a decrease in net income margin. Conversely, NXP maintained relatively stable margins, with strong EPS performance at 9.84. The overall trends suggest that while Broadcom’s top line has improved, its profitability has faced challenges, contrasting with NXP’s stable performance amidst revenue fluctuations.
Financial Ratios Comparison
In the table below, I present a comparative analysis of the latest revenue and financial ratios for Broadcom Inc. (AVGO) and NXP Semiconductors N.V. (NXPI). This will help you assess their financial health and performance.
| Metric | Broadcom Inc. (AVGO) | NXP Semiconductors N.V. (NXPI) |
|---|---|---|
| ROE | 8.71% | 27.33% |
| ROIC | 5.57% | 12.91% |
| P/E | 133.17 | 21.13 |
| P/B | 11.60 | 5.78 |
| Current Ratio | 1.17 | 2.36 |
| Quick Ratio | 1.07 | 1.60 |
| D/E | 0.99 | 1.18 |
| Debt-to-Assets | 0.41 | 0.46 |
| Interest Coverage | 3.41 | 8.59 |
| Asset Turnover | 0.31 | 0.52 |
| Fixed Asset Turnover | 20.46 | 3.86 |
| Payout ratio | 166.48% | 41.35% |
| Dividend yield | 1.25% | 1.96% |
Interpretation of Financial Ratios
Broadcom’s ratios indicate a higher P/E and P/B, suggesting it may be overvalued compared to NXP, which has a much stronger ROE and ROIC. While Broadcom has a solid current ratio, NXP maintains better liquidity overall. However, NXP’s higher payout ratio and lower interest coverage raise concerns over its dividend sustainability. Ultimately, both companies exhibit strengths and weaknesses that warrant careful consideration based on your investment strategy.
Dividend and Shareholder Returns
Broadcom Inc. (AVGO) offers dividends with a payout ratio of approximately 166% in FY 2024, indicating potential risks of unsustainable distributions. The annual yield stands at 1.25%, complemented by ongoing share buybacks, which enhance shareholder value. In contrast, NXP Semiconductors (NXPI) maintains a dividend payout ratio of 36%, yielding around 1.96%. The company also engages in share repurchase programs, suggesting a balanced approach to returning capital to shareholders. Both strategies appear to support long-term value creation, albeit with differing risk profiles.
Strategic Positioning
Broadcom Inc. (AVGO) holds a dominant market share in the semiconductor sector, particularly in wired infrastructure and wireless communications, supported by its extensive product portfolio. In contrast, NXP Semiconductors (NXPI) focuses on automotive and IoT applications, positioning itself as a leader in microcontrollers and connectivity solutions. Both companies face competitive pressure from emerging technologies and rivals, requiring continuous innovation to mitigate risks associated with technological disruption.
Stock Comparison
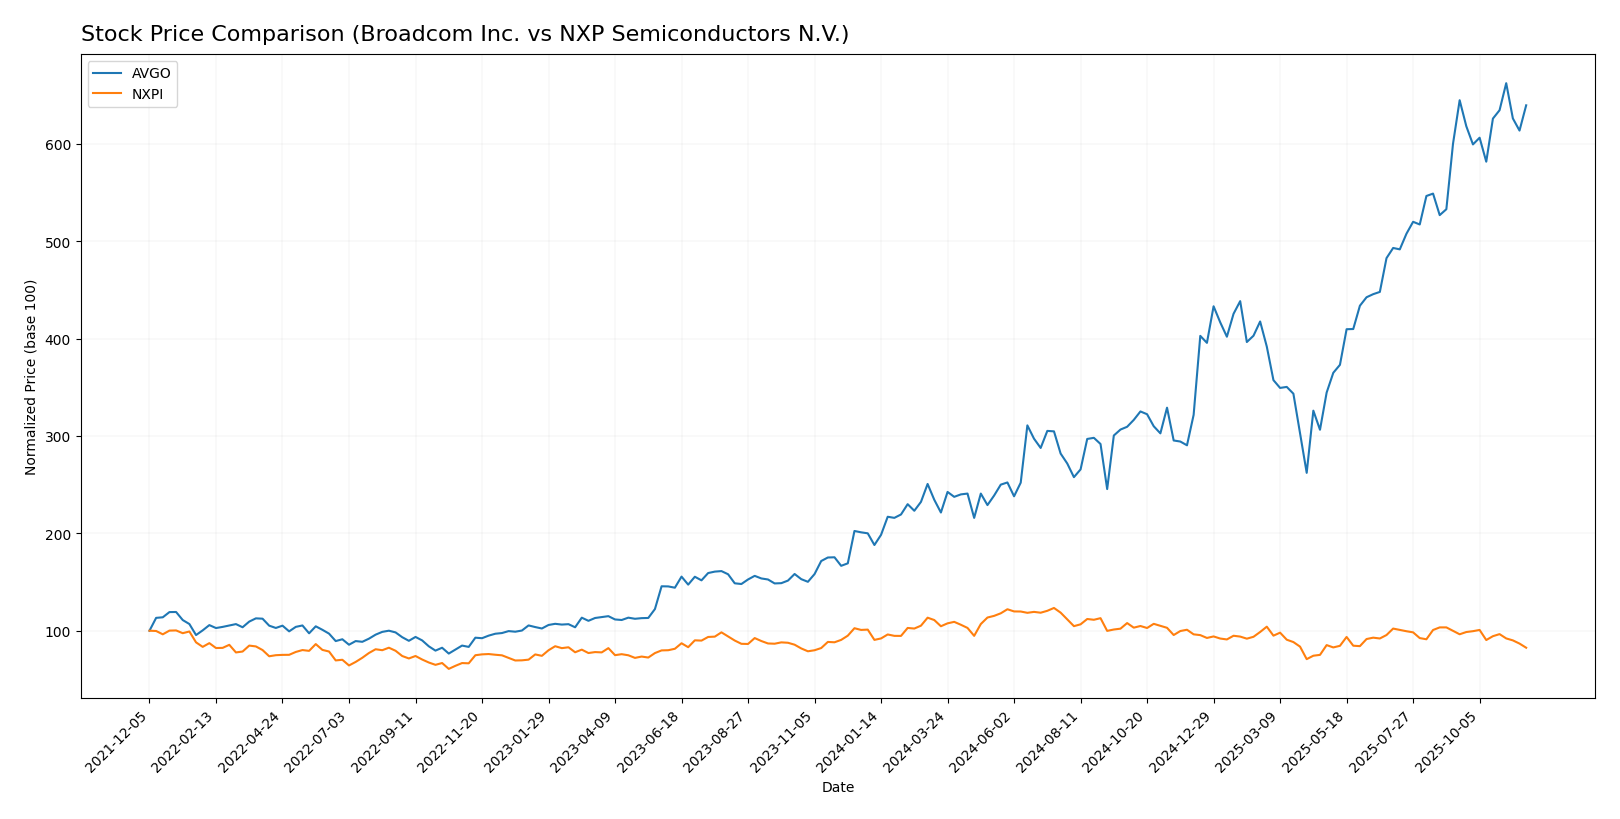
In this section, I will analyze the weekly stock price movements for Broadcom Inc. (AVGO) and NXP Semiconductors N.V. (NXPI) over the past year, highlighting key price dynamics and trends.

Trend Analysis
For Broadcom Inc. (AVGO), the stock has experienced a significant price change of +219.75% over the past year. This performance indicates a bullish trend; however, the acceleration status shows deceleration, meaning that while the stock has risen considerably, the rate of increase is slowing down. The highest price recorded was 369.63, with a notable low of 104.93. The stock’s standard deviation of 72.29 suggests considerable volatility.
In the recent analysis period from September 7, 2025, to November 23, 2025, AVGO reported a price change of +6.58%, with a standard deviation of 12.04. This indicates a stable upward trend, albeit with decreasing momentum.
Conversely, NXP Semiconductors N.V. (NXPI) has faced a price decline of -18.39% over the same time frame, categorizing the stock as bearish. The trend is also marked by deceleration, indicating that while the stock has fallen, the rate at which it is decreasing is lessening. The highest price reached was 280.19, with a lowest price of 160.81, and a standard deviation of 24.47 pointing to moderate volatility.
In the recent analysis from September 7, 2025, to November 23, 2025, NXPI experienced a price change of -17.33% with a standard deviation of 12.43, reflecting a consistent downward trend with increasing seller dominance in the market.
Analyst Opinions
Recent recommendations for Broadcom Inc. (AVGO) and NXP Semiconductors N.V. (NXPI) reflect a consensus “Buy” rating. Analysts highlight their strong return on equity and assets, with AVGO receiving a “B” rating due to solid financial health metrics. According to analysts, including those from notable firms, both companies exhibit robust growth potential in the semiconductor sector. Despite high debt-to-equity ratios, the overall outlook remains positive, making these stocks attractive for long-term investors. As I assess these insights, I remain vigilant about market conditions and individual risk tolerance.
Stock Grades
In the current market, I’ve gathered reliable stock grades for two prominent companies, Broadcom Inc. and NXP Semiconductors N.V. Let’s delve into the details of their recent ratings.
Broadcom Inc. Grades
| Grading Company | Action | New Grade | Date |
|---|---|---|---|
| Mizuho | maintain | Outperform | 2025-10-21 |
| UBS | maintain | Buy | 2025-10-14 |
| Morgan Stanley | maintain | Overweight | 2025-10-14 |
| Deutsche Bank | maintain | Buy | 2025-10-14 |
| Citigroup | maintain | Buy | 2025-10-14 |
| Barclays | maintain | Overweight | 2025-10-14 |
| Keybanc | maintain | Overweight | 2025-09-30 |
| Mizuho | maintain | Outperform | 2025-09-12 |
| Argus Research | maintain | Buy | 2025-09-08 |
| Oppenheimer | maintain | Outperform | 2025-09-05 |
NXP Semiconductors N.V. Grades
| Grading Company | Action | New Grade | Date |
|---|---|---|---|
| JP Morgan | maintain | Neutral | 2025-10-29 |
| Truist Securities | maintain | Buy | 2025-10-29 |
| JP Morgan | maintain | Neutral | 2025-07-23 |
| Wells Fargo | maintain | Overweight | 2025-07-23 |
| Truist Securities | maintain | Buy | 2025-07-23 |
| Susquehanna | maintain | Neutral | 2025-07-23 |
| Barclays | maintain | Overweight | 2025-07-22 |
| Needham | maintain | Buy | 2025-07-22 |
| Cantor Fitzgerald | maintain | Overweight | 2025-07-22 |
| Stifel | maintain | Hold | 2025-07-18 |
Overall, the trend in Broadcom’s grades reflects a consistent confidence among analysts, with multiple maintain ratings in the “Buy” and “Outperform” categories. Conversely, NXP Semiconductors shows a mix of “Buy” and “Neutral” ratings, indicating some caution among analysts despite a positive outlook from certain firms.
Target Prices
The consensus target prices for Broadcom Inc. (AVGO) and NXP Semiconductors N.V. (NXPI) indicate positive growth expectations from analysts.
| Company | Target High | Target Low | Consensus |
|---|---|---|---|
| Broadcom Inc. | 460 | 295 | 399.9 |
| NXP Semiconductors | 280 | 215 | 247.75 |
Analysts project that Broadcom’s stock could reach an average price of $399.9, compared to its current price of $356.35. Similarly, NXP’s consensus target of $247.75 suggests upward potential from its current price of $187.215.
Strengths and Weaknesses
The following table summarizes the strengths and weaknesses of Broadcom Inc. (AVGO) and NXP Semiconductors N.V. (NXPI) based on recent data.
| Criterion | Broadcom Inc. (AVGO) | NXP Semiconductors N.V. (NXPI) |
|---|---|---|
| Diversification | Strong across sectors | Focused on automotive and IoT |
| Profitability | High net margin (39%) | Moderate net margin (21%) |
| Innovation | Robust R&D | Strong in automotive tech |
| Global presence | Wide global reach | Significant in Europe and Asia |
| Market Share | Leading in semiconductors | Competitive in IoT and automotive |
| Debt level | Moderate debt (54%) | High debt (46%) |
Key takeaways indicate that Broadcom has a stronger profitability margin and broader diversification, while NXP excels in innovation within its niche markets. Both companies have substantial global presence but differ in their debt levels and market focus.
Risk Analysis
The following table outlines the key risks associated with Broadcom Inc. and NXP Semiconductors N.V., helping investors assess their potential exposure.
| Metric | Broadcom Inc. | NXP Semiconductors N.V. |
|---|---|---|
| Market Risk | High | Medium |
| Regulatory Risk | Medium | High |
| Operational Risk | Medium | Medium |
| Environmental Risk | Low | Medium |
| Geopolitical Risk | High | High |
Both companies face significant market and geopolitical risks, particularly due to their involvement in the semiconductor industry, which is heavily impacted by global supply chain dynamics and political tensions. Recent trade restrictions and regulatory changes can significantly affect their operations and profitability.
Which one to choose?
When comparing Broadcom Inc. (AVGO) and NXP Semiconductors N.V. (NXPI), both companies hold a “B” rating, indicating a solid performance, but their financials reveal distinct characteristics. Broadcom’s gross profit margin stands at 63%, outperforming NXP’s 56%. AVGO’s net profit margin of 11% also exceeds NXPI’s 20%, suggesting stronger profitability. However, AVGO’s higher price-to-earnings ratio (133) indicates a premium valuation compared to NXPI’s 21. The stock trends diverge significantly, with AVGO showing a bullish trend (+219.75%) against NXPI’s bearish trend (-18.39%).
For investors focused on growth, AVGO appears favorable due to its robust margins and bullish momentum, while those valuing stability may lean towards NXPI given its lower valuation metrics and consistent profitability.
However, both companies face risks, including market dependence and competition within the semiconductor industry.
Disclaimer: This article is not financial advice. Each investor is responsible for their own investment decisions.
Go further
I encourage you to read the complete analyses of Broadcom Inc. and NXP Semiconductors N.V. to enhance your investment decisions:


