In the dynamic world of technology, understanding the nuances between industry leaders can illuminate investment opportunities. In this article, I will compare Salesforce, Inc. (CRM) and Verint Systems Inc. (VRNT), two companies operating within the software sector but targeting different market needs. Salesforce excels in customer relationship management, while Verint focuses on customer engagement solutions. By analyzing their strategies and performance, I aim to help you determine which company might be the more compelling choice for your investment portfolio.

Table of contents
Company Overview
Salesforce, Inc. Overview
Salesforce, Inc. is a leading provider of customer relationship management (CRM) technology, dedicated to connecting companies with their customers globally. The company’s Customer 360 platform empowers businesses to deliver cohesive customer experiences through a suite of services, including sales, service, marketing, and commerce solutions. With a strong focus on analytics and integration, Salesforce enables organizations across various sectors, such as financial services and healthcare, to optimize their operations and enhance customer engagement. Founded in 1999 and headquartered in San Francisco, Salesforce continues to innovate, offering tools to build tailored business applications and facilitate learning in the Salesforce ecosystem.
Verint Systems Inc. Overview
Verint Systems Inc. specializes in customer engagement solutions, providing a comprehensive suite of applications designed to enhance customer interactions and workforce efficiency. The company’s offerings include tools for forecasting, quality compliance, interaction insights, and conversational AI, aimed at improving service delivery across various channels. Verint’s solutions are geared towards optimizing customer experiences and operational performance, making it a vital partner for organizations seeking to leverage customer data for deeper insights. Established in 1994 and based in Melville, New York, Verint serves a diverse range of industries, driving better customer engagement through innovative technology.
Key similarities and differences
Both Salesforce and Verint operate within the technology sector, focusing on enhancing customer engagement through software solutions. Salesforce primarily emphasizes CRM capabilities and a broad range of integrated services, while Verint is more concentrated on customer interaction analytics and workforce optimization. The former targets a wider audience with its diverse offerings, whereas the latter focuses on specialized solutions for improving service quality and efficiency.
Income Statement Comparison
The table below summarizes the income statements of Salesforce, Inc. (CRM) and Verint Systems Inc. (VRNT) for the fiscal year ending January 31, 2025.
| Metric | Salesforce, Inc. (CRM) | Verint Systems Inc. (VRNT) |
|---|---|---|
| Market Cap | 221B | 1.24B |
| Revenue | 38B | 909M |
| EBITDA | 11.14B | 158M |
| EBIT | 7.67B | 108M |
| Net Income | 6.20B | 82M |
| EPS | 6.44 | 1.05 |
| Fiscal Year | 2025 | 2025 |
Interpretation of Income Statement
In 2025, Salesforce (CRM) demonstrated significant growth, with revenue increasing from 35B in 2024 to 38B, reflecting a robust demand for its services. Its net income also saw a substantial rise from 4.14B to 6.20B, indicating improved operating efficiency, despite higher expenses. In contrast, Verint (VRNT) maintained stable revenue around 909M while net income showed a slight improvement to 82M. The modest growth in CRM’s performance reflects effective cost management and strong market positioning, while VRNT’s stability suggests a more cautious growth trajectory. Overall, CRM appears to be scaling effectively, while VRNT remains steady amidst competitive pressures.
Financial Ratios Comparison
Below is a comparative table showcasing the most recent financial metrics for Salesforce, Inc. (CRM) and Verint Systems Inc. (VRNT).
| Metric | [Company A: CRM] | [Company B: VRNT] |
|---|---|---|
| ROE | 10.13% | 6.22% |
| ROIC | 7.91% | 4.79% |
| P/E | 53.04 | 19.17 |
| P/B | 5.37 | 1.19 |
| Current Ratio | 1.06 | 1.12 |
| Quick Ratio | 1.06 | 1.09 |
| D/E | 0.20 | 0.34 |
| Debt-to-Assets | 11.73% | 19.58% |
| Interest Coverage | 0.00 | 10.50 |
| Asset Turnover | 0.37 | 0.40 |
| Fixed Asset Turnover | 7.03 | 11.96 |
| Payout ratio | 24.80% | 24.41% |
| Dividend yield | 0.47% | 1.27% |
Interpretation of Financial Ratios
In comparing these ratios, CRM demonstrates a higher ROE and a lower P/E ratio than VRNT, suggesting it generates more profit per equity dollar but is valued more expensively. CRM’s current and quick ratios are slightly lower, indicating less liquidity. VRNT’s higher debt ratios raise concerns about leverage, while its stronger interest coverage suggests better capability to meet interest obligations. Overall, CRM shows stronger profitability, but VRNT offers better valuation metrics and stability.
Dividend and Shareholder Returns
Salesforce, Inc. (CRM) pays dividends with a payout ratio of approximately 24.8%, reflecting a steady commitment to shareholder returns. The annual dividend yield stands at 0.47%, supported by free cash flow coverage. However, potential risks include unsustainable distributions due to market fluctuations.
Conversely, Verint Systems Inc. (VRNT) also pays dividends, with a payout ratio of about 24.4% and a yield of 1.27%. Their consistent share buyback program indicates a focus on enhancing shareholder value. Both companies’ distributions support sustainable long-term value creation, albeit with careful monitoring of their financial health.
Strategic Positioning
Salesforce (CRM) holds a dominant position in the customer relationship management (CRM) market, boasting a market cap of 221B and a significant share of the software applications sector. Its comprehensive Customer 360 platform faces competitive pressure from emerging technologies and established players. Conversely, Verint Systems (VRNT), with a market cap of 1.24B, offers niche customer engagement solutions but operates in a more fragmented market. Both companies must navigate technological disruptions to maintain their competitive edge.
Stock Comparison
Over the past year, Salesforce, Inc. (CRM) and Verint Systems Inc. (VRNT) have experienced significant price movements, characterized by notable declines and shifting trading dynamics.
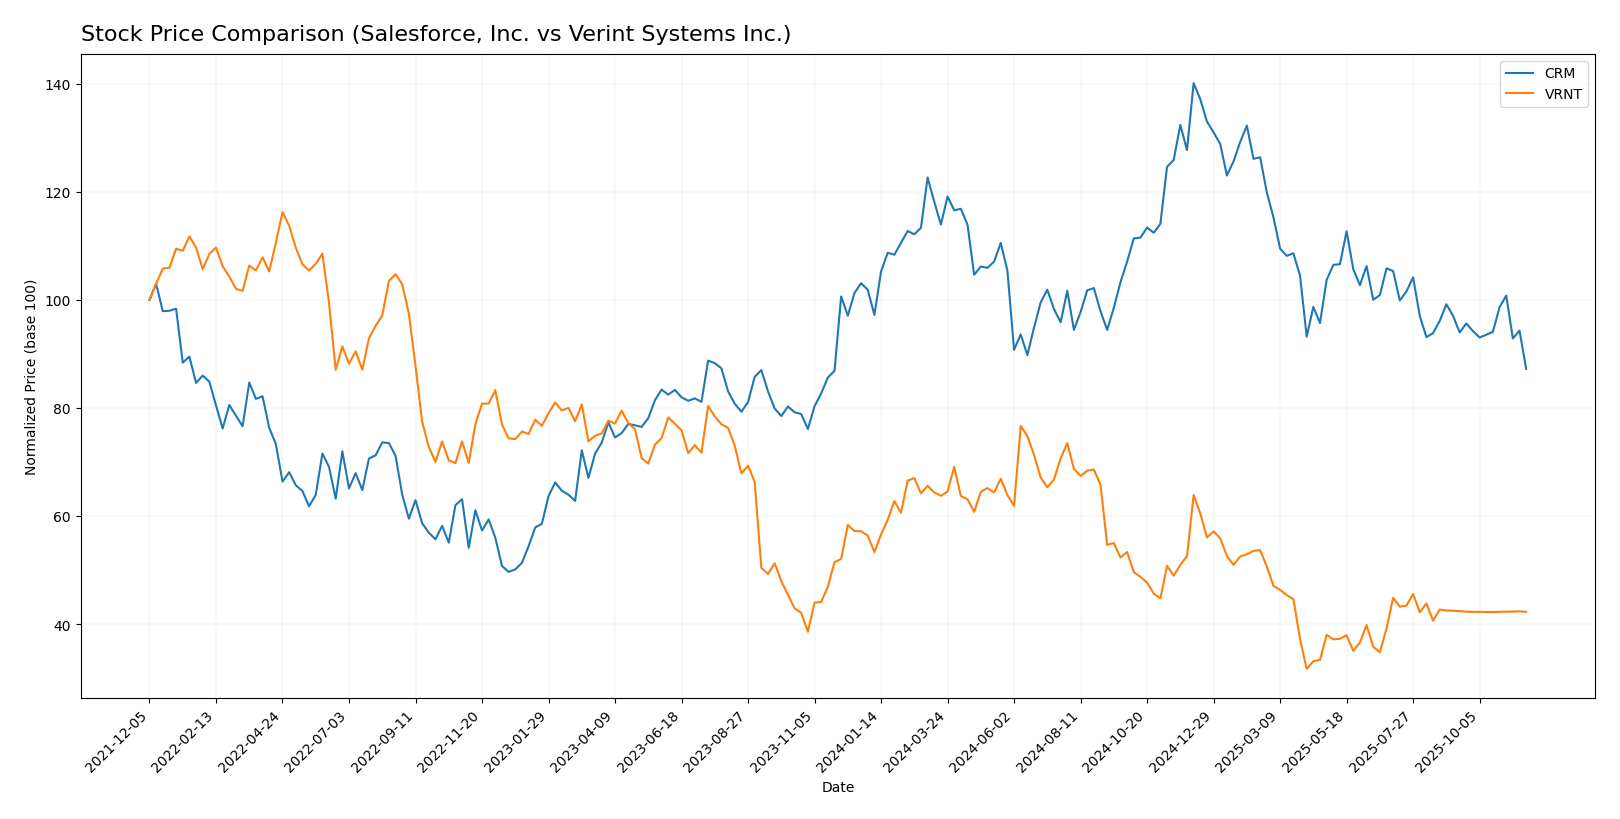
Trend Analysis
Salesforce, Inc. (CRM) The stock has seen a price change of -8.2% over the past 12 months, confirming a bearish trend. This trend is marked by a deceleration in price movements, with the highest price reaching 361.99 and the lowest at 227.11. The standard deviation of 31.38 indicates a high level of volatility in price fluctuations.
In the recent period from September 14, 2025, to November 30, 2025, the price change was -5.03%, further confirming the bearish outlook with a trend slope of -0.86. The standard deviation during this timeframe was 8.6, indicating continued volatility.
Verint Systems Inc. (VRNT) In contrast, VRNT has experienced a more pronounced decline with a price change of -19.82% over the past year, also indicating a bearish trend. The stock is characterized by accelerating downward movements, with price fluctuations between a high of 36.78 and a low of 15.2. The standard deviation of 5.53 suggests moderate volatility.
In the recent analysis period from September 14, 2025, to November 30, 2025, VRNT recorded a slight increase of 0.89%. Despite this small uptick, the overall trend remains bearish with a trend slope of 0.01, implying minimal upward momentum. The standard deviation during this recent period was just 0.07, reflecting lower volatility compared to its overall trend.
Analyst Opinions
Recent analyst recommendations for Salesforce, Inc. (CRM) indicate a consensus rating of “Buy” with a B+ rating. Analysts highlight the company’s strong discounted cash flow and return on assets scores, which stand at 4. This suggests robust growth potential. Analysts have noted concerns about its price-to-earnings and price-to-book ratios, both rated at 2, indicating some valuation risks. However, the overall sentiment remains positive for CRM, with many experts advocating for investment in the current year. As for Verint Systems Inc. (VRNT), there are currently no available analyst ratings.
Stock Grades
In today’s analysis, I will present the latest stock ratings for Salesforce, Inc. (CRM) and Verint Systems Inc. (VRNT) based on reliable grading data.
Salesforce, Inc. Grades
| Grading Company | Action | New Grade | Date |
|---|---|---|---|
| Citigroup | Maintain | Neutral | 2025-11-26 |
| Cantor Fitzgerald | Maintain | Overweight | 2025-11-25 |
| Mizuho | Maintain | Outperform | 2025-11-17 |
| B of A Securities | Maintain | Buy | 2025-11-17 |
| JMP Securities | Maintain | Market Outperform | 2025-10-17 |
| Cantor Fitzgerald | Maintain | Overweight | 2025-10-16 |
| Piper Sandler | Maintain | Overweight | 2025-10-16 |
| Wedbush | Maintain | Outperform | 2025-10-16 |
| DA Davidson | Maintain | Neutral | 2025-10-16 |
| Macquarie | Maintain | Neutral | 2025-10-16 |
Verint Systems Inc. Grades
| Grading Company | Action | New Grade | Date |
|---|---|---|---|
| RBC Capital | Downgrade | Sector Perform | 2025-08-26 |
| Needham | Downgrade | Hold | 2025-08-25 |
| Rosenblatt | Downgrade | Neutral | 2025-08-25 |
| Wedbush | Maintain | Outperform | 2025-06-05 |
| Needham | Maintain | Buy | 2025-06-05 |
| Needham | Maintain | Buy | 2025-04-25 |
| Wedbush | Maintain | Outperform | 2025-03-28 |
| RBC Capital | Maintain | Outperform | 2025-03-27 |
| Needham | Maintain | Buy | 2025-03-27 |
| Evercore ISI Group | Maintain | In Line | 2025-03-27 |
Overall, Salesforce maintains a strong position with consistent grades from multiple reputable firms, indicating stability. In contrast, Verint has faced recent downgrades, suggesting a shift in market sentiment and possibly increased caution for investors.
Target Prices
The consensus target prices from reliable analysts suggest a positive outlook for both companies.
| Company | Target High | Target Low | Consensus |
|---|---|---|---|
| Salesforce, Inc. | 404 | 395 | 399.5 |
| Verint Systems Inc. | 20.5 | 20.5 | 20.5 |
For Salesforce, the target consensus of 399.5 indicates significant upside potential compared to its current price of 230.66. Verint’s consensus target of 20.5 aligns closely with its current price of 20.51, suggesting a stable outlook.
Strengths and Weaknesses
The following table summarizes the strengths and weaknesses of Salesforce, Inc. (CRM) and Verint Systems Inc. (VRNT) based on the most recent data:
| Criterion | Salesforce, Inc. (CRM) | Verint Systems Inc. (VRNT) |
|---|---|---|
| Diversification | High | Moderate |
| Profitability | Strong (Net Margin: 16.35%) | Moderate (Net Margin: 9.05%) |
| Innovation | High | Moderate |
| Global presence | Extensive | Limited |
| Market Share | Significant | Niche |
| Debt level | Low (Debt-to-Equity: 0.20) | Moderate (Debt-to-Equity: 0.34) |
Key takeaways indicate that Salesforce boasts higher profitability, innovation, and global reach compared to Verint, which operates in a more niche market and has moderate profitability and debt levels.
Risk Analysis
In the table below, I will analyze the various risks associated with two technology companies: Salesforce, Inc. (CRM) and Verint Systems Inc. (VRNT).
| Metric | Salesforce, Inc. | Verint Systems Inc. |
|---|---|---|
| Market Risk | High | Moderate |
| Regulatory Risk | Moderate | High |
| Operational Risk | Moderate | Moderate |
| Environmental Risk | Low | Low |
| Geopolitical Risk | Moderate | High |
In summary, both companies face significant market risks, with Salesforce experiencing higher volatility due to its expansive market presence, while Verint is under regulatory scrutiny. The geopolitical landscape also poses challenges for Verint, given its global operations.
Which one to choose?
When comparing Salesforce, Inc. (CRM) and Verint Systems Inc. (VRNT), we see distinct differences in financial health and market performance. CRM boasts a market cap of 329B with a strong gross profit margin of 77.2%, while VRNT’s market cap is significantly smaller at 1.58B, with a gross profit margin of 71.3%. CRM’s P/E ratio stands at a high 53, reflecting investor optimism, but also suggests a premium valuation. Conversely, VRNT’s P/E ratio of 19 indicates a more modest valuation, potentially appealing to value investors.
Analysts rate CRM as a B+, highlighting its solid fundamentals, while VRNT lacks a rating, indicating uncertainty in investor confidence. Given the bearish trends in both stocks, CRM may be preferable for growth-oriented investors despite its high valuation, while those focused on value and lower risk may find VRNT appealing.
Risks include market competition and valuation pressures impacting both companies.
Disclaimer: This article is not financial advice. Each investor is responsible for their own investment decisions.
Go further
I encourage you to read the complete analyses of Salesforce, Inc. and Verint Systems Inc. to enhance your investment decisions: