Home > Comparison > Industrials > HON vs EMR
The strategic rivalry between Honeywell International Inc. and Emerson Electric Co. shapes the trajectory of the Industrials sector. Honeywell operates as a diversified conglomerate with advanced aerospace and building technologies, while Emerson focuses on industrial machinery and automation solutions. This analysis contrasts Honeywell’s broad innovation-driven model against Emerson’s specialized operational focus, aiming to identify which offers superior risk-adjusted returns for a diversified portfolio navigating today’s industrial landscape.
Table of contents
Companies Overview
Honeywell International Inc. and Emerson Electric Co. stand as major industrial players shaping global technology and manufacturing markets.
Honeywell International Inc.: Diversified Industrial Technology Leader
Honeywell dominates as a diversified technology and manufacturing conglomerate. It generates revenue through aerospace systems, building technologies, performance materials, and safety solutions. In 2026, it prioritizes innovation in software integration and sustainable materials to enhance its competitive advantage and global footprint.
Emerson Electric Co.: Engineering Solutions Pioneer
Emerson Electric Co. is a technology and engineering company focused on automation and commercial solutions. Its core revenue derives from automation instrumentation and heating, ventilation, and air conditioning (HVAC) products. The 2026 strategy emphasizes expanding process control software and energy-efficient residential solutions to meet diverse industrial demands.
Strategic Collision: Similarities & Divergences
Both companies leverage industrial technology but differ in scope: Honeywell pursues a broad conglomerate model, while Emerson channels efforts into specialized automation and HVAC markets. Their primary battleground lies in industrial process optimization and energy management. Investors encounter distinct profiles—Honeywell’s diversified innovation contrasts Emerson’s focused engineering expertise.
Income Statement Comparison
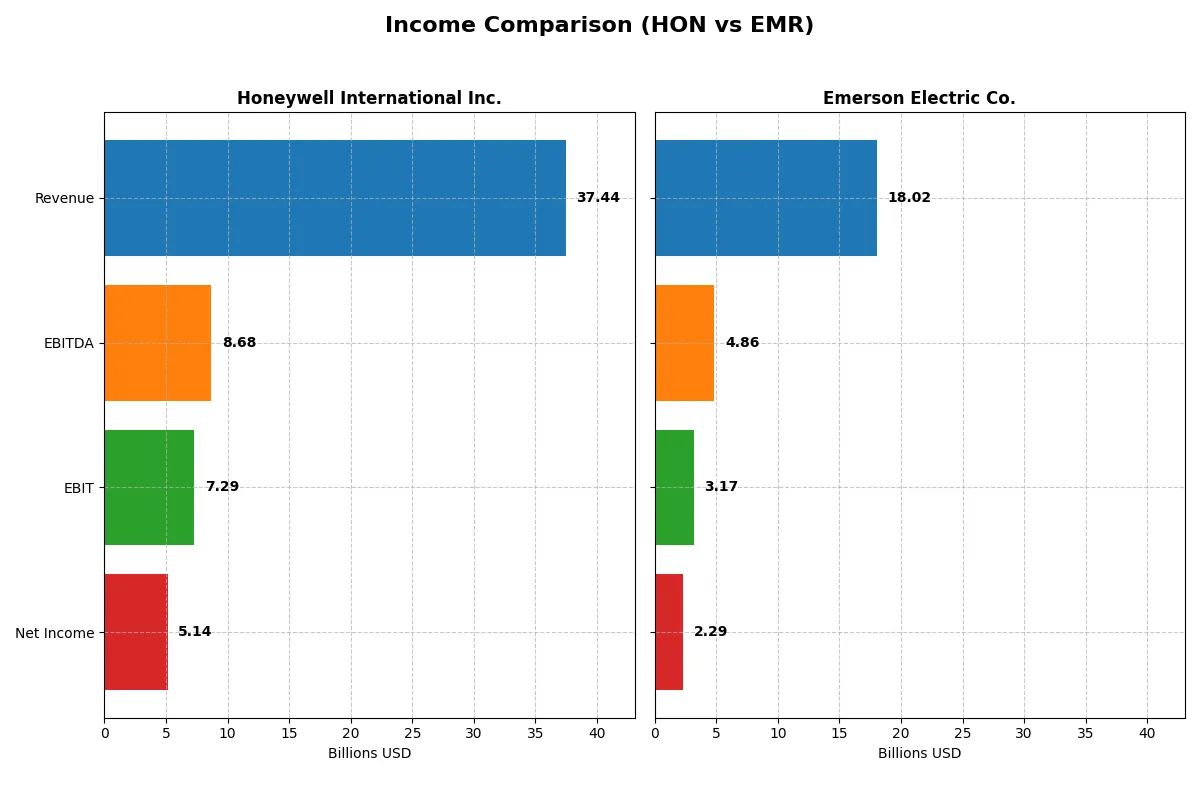
The following data dissects the core profitability and scalability of both corporate engines to reveal who dominates the bottom line:
| Metric | Honeywell International Inc. (HON) | Emerson Electric Co. (EMR) |
|---|---|---|
| Revenue | 37.4B | 18.0B |
| Cost of Revenue | 23.6B | 8.5B |
| Operating Expenses | 7.2B | 7.3B |
| Gross Profit | 13.8B | 9.5B |
| EBITDA | 8.7B | 4.9B |
| EBIT | 7.3B | 3.2B |
| Interest Expense | 1.3B | 237M |
| Net Income | 5.1B | 2.3B |
| EPS | 8.03 | 4.06 |
| Fiscal Year | 2025 | 2025 |
Income Statement Analysis: The Bottom-Line Duel
This income statement comparison reveals which company runs a more efficient and profitable corporate engine through recent financial performance.
Honeywell International Inc. Analysis
Honeywell’s revenue grew 8.9% from 2021 to 2025 but declined 2.7% in the latest year to $37.4B. Net income fell 7.3% over the period, dropping 10.0% last year to $5.14B. Its gross margin remains healthy near 37%, while net margin slipped to 13.7%. Recent declines indicate waning momentum despite favorable margin levels.
Emerson Electric Co. Analysis
Emerson’s revenue rose 39.3% from 2021 to 2025, increasing 3.0% in the last year to $18.0B. Net income barely changed over five years but jumped 16.5% last year to $2.29B. The firm boasts a superior gross margin above 52%, with net margin at 12.7%. Strong margin expansion and recent earnings growth fuel positive momentum.
Margin Strength vs. Revenue Expansion
Honeywell leads with a stronger net margin and larger revenue base, reflecting scale and operational efficiency. Emerson outpaces with faster revenue growth and sharper earnings momentum, driven by expanding margins. For investors prioritizing margin resilience, Honeywell’s profile stands out; those seeking growth acceleration may favor Emerson’s approach.
Financial Ratios Comparison
These vital ratios act as a diagnostic tool to expose the underlying fiscal health, valuation premiums, and capital efficiency of the companies compared below:
| Ratios | Honeywell International Inc. (HON) | Emerson Electric Co. (EMR) |
|---|---|---|
| ROE | 33.3% | 11.3% |
| ROIC | 9.4% | 4.6% |
| P/E | 24.1 | 32.4 |
| P/B | 8.03 | 3.67 |
| Current Ratio | 1.32 | 0.88 |
| Quick Ratio | 1.05 | 0.65 |
| D/E | 2.14 | 0.68 |
| Debt-to-Assets | 44.6% | 32.8% |
| Interest Coverage | 5.16 | 9.44 |
| Asset Turnover | 0.54 | 0.43 |
| Fixed Asset Turnover | 8.71 | 5.14 |
| Payout ratio | 58% | 52% |
| Dividend yield | 2.40% | 1.60% |
| Fiscal Year | 2025 | 2025 |
Efficiency & Valuation Duel: The Vital Signs
Financial ratios serve as a company’s DNA, revealing hidden risks and operational excellence critical for informed investment decisions.
Honeywell International Inc.
Honeywell shows strong profitability with a 33.3% ROE and a favorable 12.7% net margin, signaling operational efficiency. Its P/E of 24.1 is neutral, but a high P/B at 8.0 suggests valuation stretch. The 2.4% dividend yield rewards shareholders, complementing steady reinvestment in R&D at 4.7%, fueling growth.
Emerson Electric Co.
Emerson posts a modest 11.3% ROE and a competitive 12.7% net margin, but its 32.4 P/E ratio marks the stock as expensive. The P/B of 3.7 and unfavorable liquidity ratios hint at financial strain. Dividend yield is lower at 1.6%, reflecting less shareholder cash return amid weaker reinvestment signals.
Premium Valuation vs. Operational Safety
Honeywell balances robust profitability and shareholder returns despite a stretched book value. Emerson’s higher valuation multiples and weaker liquidity pose risks. Investors favoring operational safety and consistent dividends may lean toward Honeywell, while those chasing growth at a premium might consider Emerson’s profile.
Which one offers the Superior Shareholder Reward?
I observe that Honeywell International (HON) delivers a higher dividend yield at 2.4% versus Emerson Electric’s (EMR) 1.6% in 2025. HON sustains this with a payout ratio near 58%, backed by solid free cash flow coverage above 0.8. EMR’s payout ratio hovers around 52%, but its free cash flow per share is notably lower at 4.7B compared to HON’s 8.5B. Both deploy buybacks actively, but HON’s capital expenditure coverage and dividend-plus-capex coverage ratios exceed EMR’s, signaling more durable distributions. HON’s balanced approach of strong dividends and robust buybacks offers a superior total return profile in 2026, while EMR’s lower yield and weaker cash flow metrics raise sustainability concerns for long-term value creation. I side with HON for superior shareholder reward.
Comparative Score Analysis: The Strategic Profile
The radar chart reveals the fundamental DNA and trade-offs of Honeywell International Inc. and Emerson Electric Co., highlighting their financial strengths and vulnerabilities:
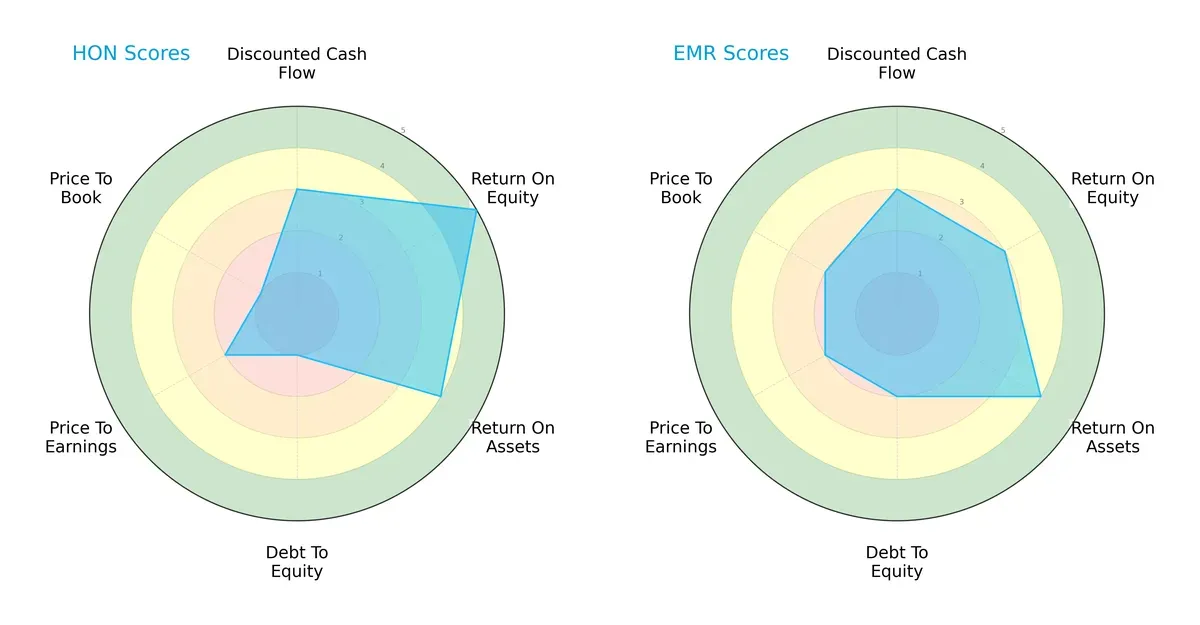
Honeywell excels in return on equity (5 vs. 3) and shows a favorable return on assets (4 vs. 4), while Emerson maintains a stronger balance sheet with better debt-to-equity (2 vs. 1) and valuation metrics (P/B 2 vs. 1). Honeywell’s profile is skewed toward operational efficiency but carries higher leverage risks. Emerson offers a more balanced risk-return trade-off, reflecting prudence in capital structure and valuation.
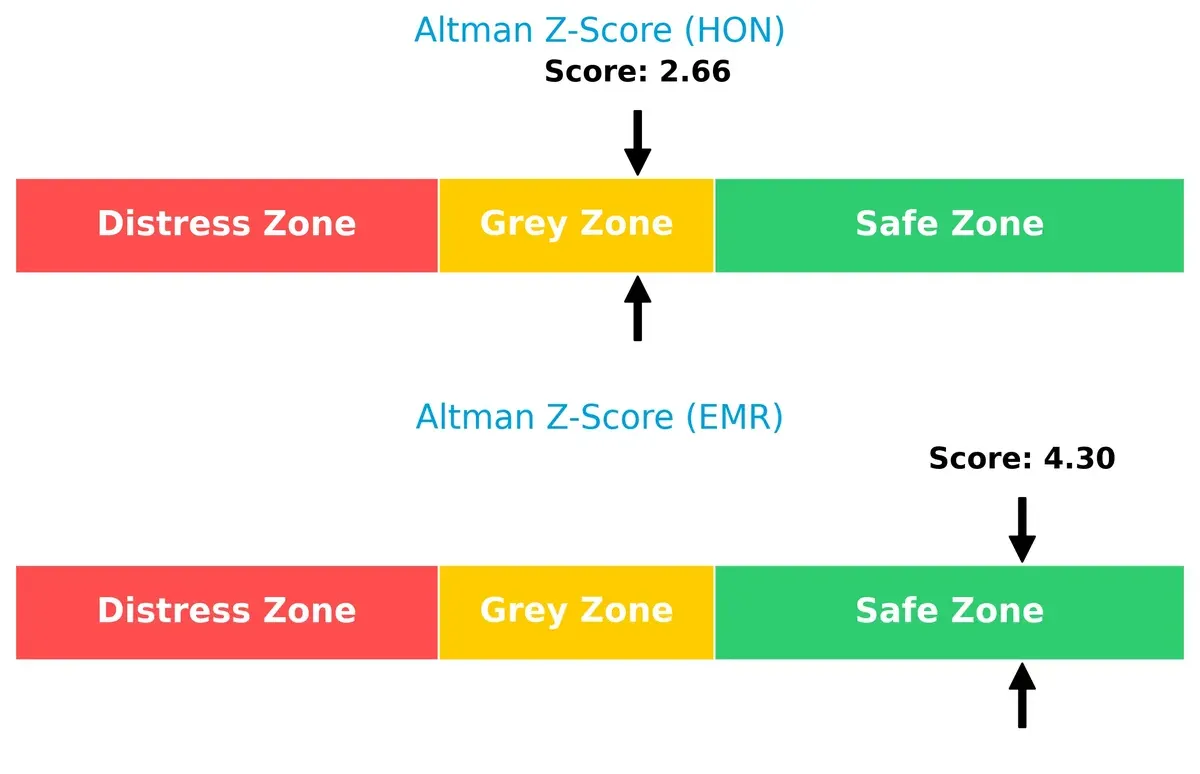
Bankruptcy Risk: Solvency Showdown
Emerson’s Altman Z-Score of 4.3 places it well within the safe zone, indicating low bankruptcy risk. Honeywell’s 2.7 in the grey zone signals moderate financial stress and higher vulnerability in the current economic cycle:
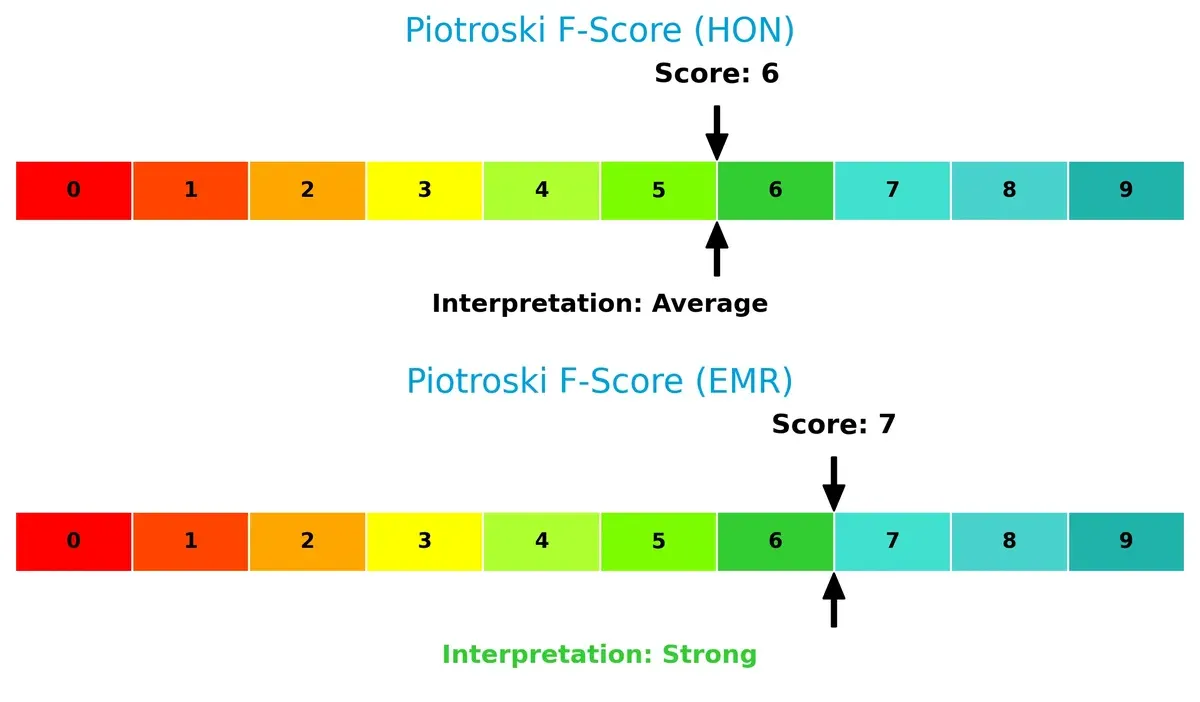
Financial Health: Quality of Operations
Emerson scores a strong 7 on the Piotroski F-Score, reflecting superior financial health and operational quality. Honeywell’s 6, while average, suggests some internal weaknesses worth monitoring:
How are the two companies positioned?
This section dissects the operational DNA of HON and EMR by comparing their revenue distribution and internal dynamics. The goal is to confront their economic moats to identify the most resilient competitive advantage today.
Revenue Segmentation: The Strategic Mix
This visual comparison dissects how Honeywell International and Emerson Electric diversify income streams and reveals their primary sector bets:
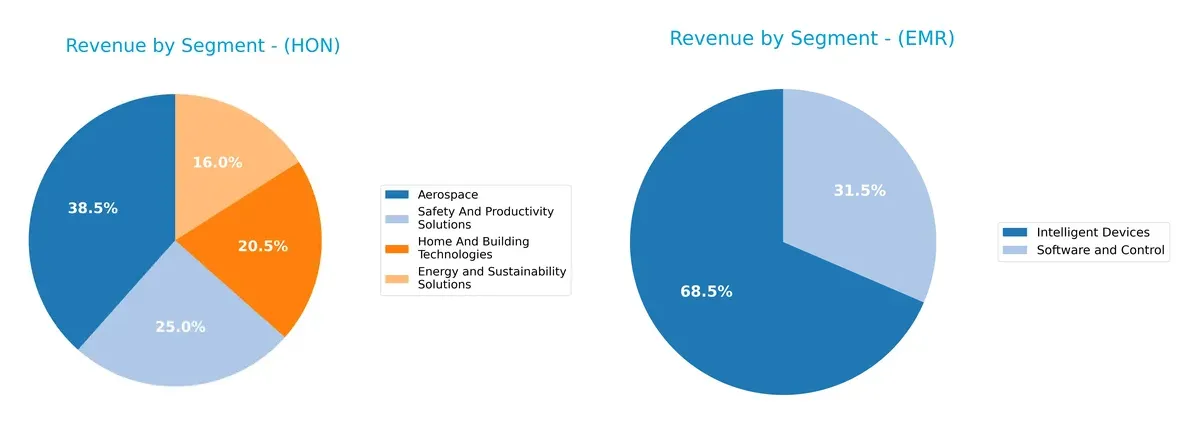
Honeywell’s revenue splits among Aerospace ($15.5B), Safety & Productivity ($10B), and Home & Building Technologies ($8.3B), showing balanced diversification. Emerson, by contrast, pivots heavily on Intelligent Devices ($12.4B) with Software and Control trailing at $5.7B, signaling reliance on core tech segments. Honeywell’s mix reduces concentration risk, while Emerson’s focus highlights infrastructure dominance but invites vulnerability to demand shifts in its flagship segment.
Strengths and Weaknesses Comparison
This table compares the Strengths and Weaknesses of Honeywell International Inc. and Emerson Electric Co.:
Honeywell International Inc. Strengths
- Diverse segments including Aerospace and Home Technologies
- Strong net margin at 12.74%
- ROE very favorable at 33.28%
- Favorable quick ratio at 1.05
- High interest coverage ratio at 5.42
- Significant US and Europe revenue presence
Emerson Electric Co. Strengths
- Favorable net margin at 12.73%
- Strong interest coverage ratio at 13.38
- Diverse product lines with Intelligent Devices and Software
- Neutral debt-to-assets ratio at 32.79%
- Favorable fixed asset turnover at 5.14
- Global presence across Americas, Asia, and Europe
Honeywell International Inc. Weaknesses
- Unfavorable high debt-to-equity ratio at 2.14
- Price-to-book ratio unfavorable at 8.03
- Neutral asset turnover at 0.54
- Moderate current ratio at 1.32
- ROIC neutral at 9.41%
- Some reliance on Aerospace segment concentration
Emerson Electric Co. Weaknesses
- Unfavorable ROIC at 4.6% below WACC
- Unfavorable current ratio at 0.88 and quick ratio at 0.65
- High P/E ratio at 32.42
- Unfavorable price-to-book at 3.67
- Lower ROE at 11.31%
- Asset turnover unfavorable at 0.43
Both companies show solid profitability with comparable net margins. Honeywell’s financial leverage and valuation metrics raise caution, while Emerson’s liquidity and capital efficiency ratios highlight operational risks. These differences underscore distinct strategic and financial positioning challenges for each firm.
The Moat Duel: Analyzing Competitive Defensibility
A structural moat is the only reliable shield protecting long-term profits from relentless competitive erosion. Let’s examine how Honeywell and Emerson stack up:
Honeywell International Inc.: Diversified Innovation and Cost Efficiency
Honeywell’s moat stems from its diversified technology portfolio and cost advantages. It sustains high ROIC above WACC, reflecting efficient capital use and margin stability. However, slipping ROIC signals rising competitive pressures in 2026.
Emerson Electric Co.: Industrial Scale with Waning Returns
Emerson relies on industrial automation scale and deep market penetration as its moat, contrasting Honeywell’s tech diversification. Yet, Emerson’s ROIC falls sharply below WACC, indicating value destruction and declining competitiveness amid industry shifts.
Verdict: Diversified Innovation vs. Industrial Scale Efficiency
Honeywell’s slightly favorable moat driven by innovation and cost leadership outpaces Emerson’s very unfavorable position marked by value erosion. Honeywell is better poised to defend and grow its market share in 2026.
Which stock offers better returns?
Over the past year, Honeywell International and Emerson Electric showed strong bullish trends with accelerating price gains and rising trading volumes. Both stocks reached notable highs and maintained positive momentum.
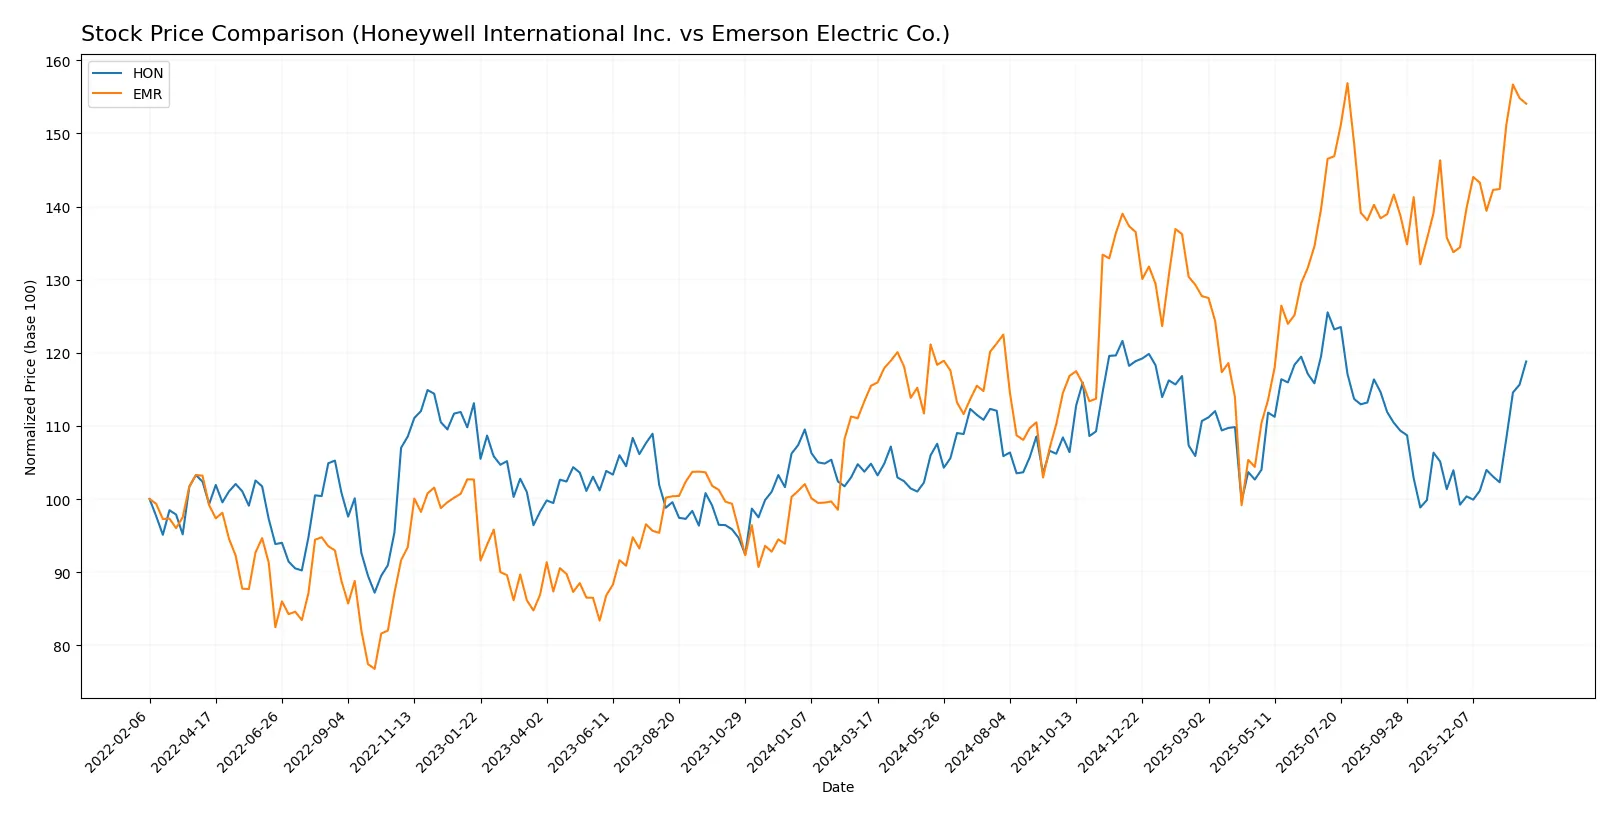
Trend Comparison
Honeywell International’s stock price increased 13.33% over the past 12 months, showing acceleration and a high near 240.4. The volume trend is increasing with strong buyer dominance recently.
Emerson Electric’s stock rose 33.42% in the same period, also accelerating. It reached a high of 149.63 with an increasing volume trend, though buyer dominance is less pronounced than Honeywell’s.
Emerson Electric outperformed Honeywell with a higher total price gain and strong acceleration, delivering superior market returns over the past year.
Target Prices
Analysts show a positive outlook with solid upside potential for both Honeywell International Inc. and Emerson Electric Co.
| Company | Target Low | Target High | Consensus |
|---|---|---|---|
| Honeywell International Inc. | 195 | 268 | 242.08 |
| Emerson Electric Co. | 125 | 170 | 149.67 |
Honeywell’s consensus target at 242.08 suggests roughly 6% upside from the current 227.52. Emerson’s 149.67 target implies modest appreciation compared to the 146.96 stock price.

Don’t Let Luck Decide Your Entry Point
Optimize your entry points with our advanced ProRealTime indicators. You’ll get efficient buy signals with precise price targets for maximum performance. Start outperforming now!
How do institutions grade them?
Here are the latest professional grades assigned by major financial institutions for both companies:
Honeywell International Inc. Grades
This table summarizes recent ratings from top-tier grading companies for Honeywell.
| Grading Company | Action | New Grade | Date |
|---|---|---|---|
| Citigroup | Maintain | Buy | 2026-01-30 |
| RBC Capital | Maintain | Outperform | 2026-01-30 |
| Barclays | Maintain | Overweight | 2026-01-30 |
| Wells Fargo | Maintain | Equal Weight | 2026-01-30 |
| JP Morgan | Maintain | Overweight | 2026-01-30 |
| JP Morgan | Upgrade | Overweight | 2026-01-16 |
| Citigroup | Maintain | Buy | 2026-01-12 |
| Wells Fargo | Maintain | Equal Weight | 2026-01-07 |
| Mizuho | Maintain | Outperform | 2026-01-05 |
| Barclays | Maintain | Overweight | 2025-12-24 |
Emerson Electric Co. Grades
The table below lists current grades from recognized institutions for Emerson Electric.
| Grading Company | Action | New Grade | Date |
|---|---|---|---|
| Oppenheimer | Downgrade | Perform | 2026-01-27 |
| JP Morgan | Maintain | Neutral | 2026-01-16 |
| Wells Fargo | Maintain | Equal Weight | 2026-01-07 |
| Barclays | Maintain | Equal Weight | 2026-01-07 |
| UBS | Upgrade | Buy | 2026-01-05 |
| Jefferies | Downgrade | Hold | 2025-12-10 |
| JP Morgan | Maintain | Neutral | 2025-11-10 |
| RBC Capital | Maintain | Outperform | 2025-11-06 |
| Barclays | Maintain | Equal Weight | 2025-11-06 |
| RBC Capital | Maintain | Outperform | 2025-10-16 |
Which company has the best grades?
Honeywell consistently receives higher-grade ratings like Buy, Outperform, and Overweight from multiple premier institutions. Emerson’s ratings are more mixed, including downgrades and several Neutral or Equal Weight grades. Investors may view Honeywell’s stronger consensus grades as a sign of greater current institutional confidence.
Risks specific to each company
The following categories identify the critical pressure points and systemic threats facing Honeywell International Inc. and Emerson Electric Co. in the 2026 market environment:
1. Market & Competition
Honeywell International Inc.
- Operates in diversified tech with strong aerospace and industrial presence; faces competition from integrated tech players.
Emerson Electric Co.
- Focuses on industrial machinery and automation; competes with specialized industrial equipment providers.
2. Capital Structure & Debt
Honeywell International Inc.
- High debt-to-equity ratio (2.14) signals elevated leverage and potential financial risk.
Emerson Electric Co.
- Moderate leverage with debt-to-equity at 0.68, indicating a more conservative capital structure.
3. Stock Volatility
Honeywell International Inc.
- Beta of 0.942 suggests stock volatility slightly below market average, offering stability.
Emerson Electric Co.
- Beta of 1.254 reflects higher volatility and sensitivity to market swings, increasing risk.
4. Regulatory & Legal
Honeywell International Inc.
- Exposure to aerospace and chemical regulations creates compliance complexity and potential fines.
Emerson Electric Co.
- Industrial and commercial product regulations pose ongoing legal and compliance challenges.
5. Supply Chain & Operations
Honeywell International Inc.
- Complex global supply chains risk disruption, especially in aerospace components and advanced materials.
Emerson Electric Co.
- Global operations face risks from supply chain bottlenecks in industrial valves and HVAC components.
6. ESG & Climate Transition
Honeywell International Inc.
- Invests in reduced global-warming-potential materials; ESG improvements critical for investor appeal.
Emerson Electric Co.
- Faces pressure to innovate environmentally friendly solutions in industrial and residential markets.
7. Geopolitical Exposure
Honeywell International Inc.
- Global footprint exposes it to trade tensions and geopolitical instability in aerospace and tech markets.
Emerson Electric Co.
- Diverse geographic presence subjects it to risks from geopolitical shocks in emerging and developed markets.
Which company shows a better risk-adjusted profile?
Honeywell’s highest risk lies in its elevated leverage, which could pressure financial stability during downturns. Emerson’s primary risk is higher stock volatility, reflecting market sensitivity. Emerson’s stronger Altman Z-Score (4.3, safe zone) and better liquidity metrics suggest a superior risk-adjusted profile. Honeywell’s leverage and high price-to-book ratio raise caution despite its operational diversity. The recent rise in Emerson’s Altman Z-Score confirms improving balance sheet strength, justifying investor confidence amidst volatility concerns.
Final Verdict: Which stock to choose?
Honeywell International Inc. (HON) stands out for its unmatched ability to generate shareholder returns, with a strong return on equity and a proven capital allocation discipline. Its point of vigilance lies in a slightly declining profitability trend and elevated debt levels. HON suits investors focused on aggressive growth with an appetite for moderate risk.
Emerson Electric Co. (EMR) boasts a strategic moat rooted in its robust income quality and safer balance sheet, reflecting lower financial leverage and a strong cash flow profile. While EMR’s growth metrics trail HON, it offers better stability and a defensive posture, fitting well into GARP (Growth at a Reasonable Price) portfolios.
If you prioritize high return on equity and are comfortable managing leverage risk, Honeywell outshines Emerson due to its superior value creation and growth potential. However, if you seek better financial stability with consistent cash flow generation, Emerson offers a safer investment scenario despite slower growth. Both present distinct profiles aligned to different investor strategies.
Disclaimer: Investment carries a risk of loss of initial capital. The past performance is not a reliable indicator of future results. Be sure to understand risks before making an investment decision.
Go Further
I encourage you to read the complete analyses of Honeywell International Inc. and Emerson Electric Co. to enhance your investment decisions: