Emerson Electric Co. revolutionizes how industries operate, from streamlining manufacturing processes to enhancing home comfort. With its dual focus on Automation Solutions and Commercial & Residential Solutions, Emerson stands as a beacon of innovation, delivering cutting-edge technologies that improve efficiency and performance across diverse sectors, including energy, life sciences, and HVAC systems. As I delve into this analysis, I will consider whether Emerson’s robust fundamentals and market presence continue to justify its current valuation and growth trajectory.

Table of contents
Company Description
Emerson Electric Co. is a prominent technology and engineering firm founded in 1890, headquartered in Saint Louis, Missouri. With a market capitalization of approximately $72B, Emerson operates primarily in the industrial machinery sector, offering solutions across diverse markets including oil and gas, life sciences, and residential heating. The company is organized into two main segments: Automation Solutions, which focuses on process control systems and instrumentation, and Commercial & Residential Solutions, providing HVAC products and energy management services. Emerson’s strategic emphasis on innovation and sustainability positions it as a leader in shaping industry standards and driving advancements in operational efficiency.
Fundamental Analysis
In this section, I will analyze Emerson Electric Co.’s income statement, financial ratios, and dividend payout policy to provide insights into its financial health.
Income Statement
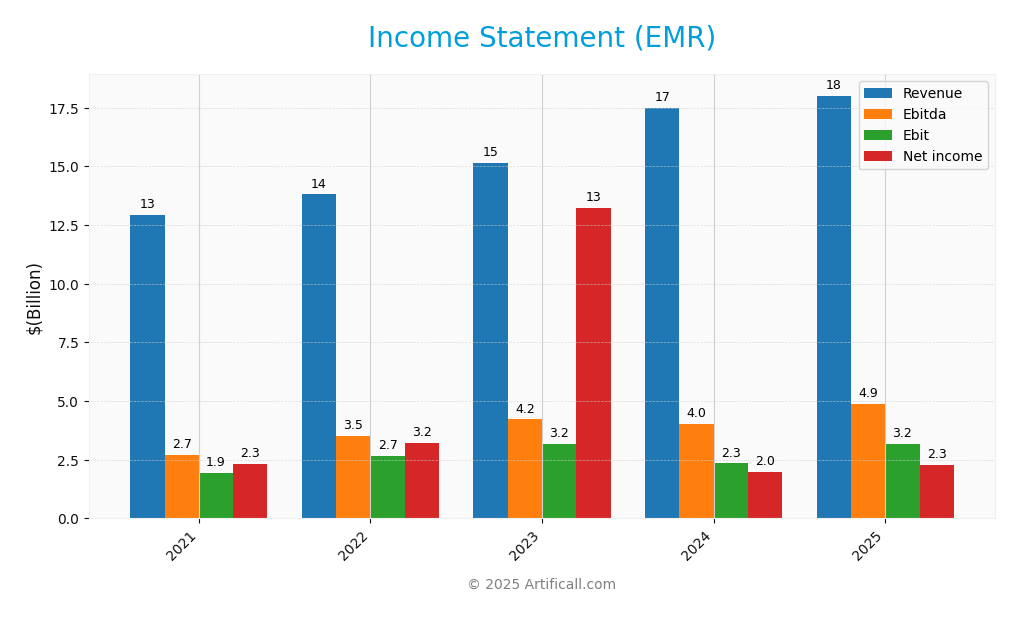
The following income statement provides a comprehensive overview of Emerson Electric Co.’s financial performance over the past five fiscal years, highlighting key revenue and expense figures.

| Metric | 2021 | 2022 | 2023 | 2024 | 2025 |
|---|---|---|---|---|---|
| Revenue | 12.93B | 13.80B | 15.17B | 17.49B | 18.02B |
| Cost of Revenue | 7.20B | 7.50B | 7.74B | 8.61B | 8.50B |
| Operating Expenses | 3.77B | 3.95B | 4.67B | 6.22B | 7.28B |
| Gross Profit | 5.73B | 6.31B | 7.43B | 8.89B | 9.52B |
| EBITDA | 2.69B | 3.50B | 4.22B | 4.03B | 4.86B |
| EBIT | 1.93B | 2.66B | 3.16B | 2.34B | 3.17B |
| Interest Expense | 0.16B | 0.23B | 0.26B | 0.32B | 0.24B |
| Net Income | 2.30B | 3.23B | 13.22B | 1.97B | 2.29B |
| EPS | 3.85 | 4.63 | 3.75 | 3.44 | 4.06 |
| Filing Date | 2021-11-15 | 2022-11-14 | 2023-11-13 | 2024-11-12 | 2025-11-10 |
Interpretation of Income Statement
Over the five-year period, Emerson Electric Co. has demonstrated a consistent upward trend in revenue, increasing from 12.93B in 2021 to 18.02B in 2025. Notably, the net income experienced substantial growth in 2023 due to one-time gains, but normalized to around 2.29B in 2025. Operating expenses have risen significantly, reflecting increased investments in growth, though they have slightly outpaced revenue growth, impacting margins. The most recent year shows a modest revenue increase with stable net income, indicating potential market saturation or increased competition, warranting caution for future projections.
Financial Ratios
The following table summarizes the key financial ratios for Emerson Electric Co. across the last available fiscal years.
| Financial Ratios | 2021 | 2022 | 2023 | 2024 | 2025 |
|---|---|---|---|---|---|
| Net Margin | 17.81% | 23.41% | 87.17% | 11.25% | 12.73% |
| ROE | 23.30% | 31.17% | 63.89% | 9.10% | 11.30% |
| ROIC | 8.14% | 6.08% | 5.62% | 5.43% | 4.62% |
| P/E | 24.46 | 13.44 | 4.19 | 31.75 | 32.42 |
| P/B | 5.70 | 4.19 | 2.68 | 2.89 | 3.66 |
| Current Ratio | 1.35 | 1.09 | 2.75 | 1.77 | 0.88 |
| Quick Ratio | 1.02 | 0.87 | 2.35 | 1.40 | 0.65 |
| D/E | 0.72 | 1.03 | 0.41 | 0.38 | 0.65 |
| Debt-to-Assets | 28.64% | 29.96% | 20.03% | 18.53% | 31.26% |
| Interest Coverage | 11.80 | 10.33 | 10.57 | 8.25 | 9.44 |
| Asset Turnover | 0.52 | 0.39 | 0.35 | 0.40 | 0.43 |
| Fixed Asset Turnover | 3.46 | 6.17 | 6.42 | 6.23 | 6.28 |
| Dividend Yield | 2.15% | 2.82% | 2.16% | 1.92% | 1.60% |
Interpretation of Financial Ratios
Analyzing Emerson Electric Co. (EMR) for FY 2025 reveals a mixed financial health. The current ratio stands at 0.88, indicating potential liquidity issues, as it’s below the ideal threshold of 1. Similarly, the quick ratio of 0.65 suggests insufficient short-term assets to cover liabilities. However, the solvency ratio at 0.18 shows a reasonable capacity to meet long-term obligations, albeit with a moderate debt-to-equity ratio of 0.65, which raises potential concerns about leverage. Profitability appears stronger, with a net profit margin of 12.73% and return on equity at 11.30%, indicating efficient management of earnings. Overall, while profitability is solid, liquidity ratios reflect heightened risk that investors should monitor closely.
Evolution of Financial Ratios
Over the past five years, Emerson Electric Co.’s financial ratios have shown volatility. The current ratio decreased from 2.75 in 2023 to 0.88 in 2025, highlighting a significant decline in liquidity. Conversely, profitability ratios have seen improvements, with the net profit margin rising from approximately 8.72% in 2021 to 12.73% in 2025, reflecting enhanced operational efficiency.
Distribution Policy
Emerson Electric Co. (EMR) maintains a dividend payout ratio of 52% and an annual dividend yield of approximately 1.60%. The company has consistently increased its dividend per share, demonstrating a commitment to returning value to shareholders. Additionally, EMR has engaged in share buybacks, which can enhance shareholder value but also pose risks if undertaken excessively. Overall, these distribution strategies align with sustainable long-term value creation for shareholders, but vigilant assessment of cash flow and market conditions remains essential.
Sector Analysis
Emerson Electric Co. operates in the Industrial – Machinery sector, offering advanced automation and commercial solutions, with a competitive edge in diverse applications across various industries.
Strategic Positioning
Emerson Electric Co. (EMR) holds a significant position in the industrial machinery sector, with a market capitalization of approximately 72B. The company operates through two main segments: Automation Solutions and Commercial & Residential Solutions. Its competitive edge is bolstered by a diverse product portfolio, serving critical industries like oil and gas, power generation, and life sciences. However, it faces competitive pressure from both established players and emerging technologies, especially in automation and smart home solutions. Staying ahead of technological disruptions will be essential for maintaining its market share and growth trajectory.
Revenue by Segment
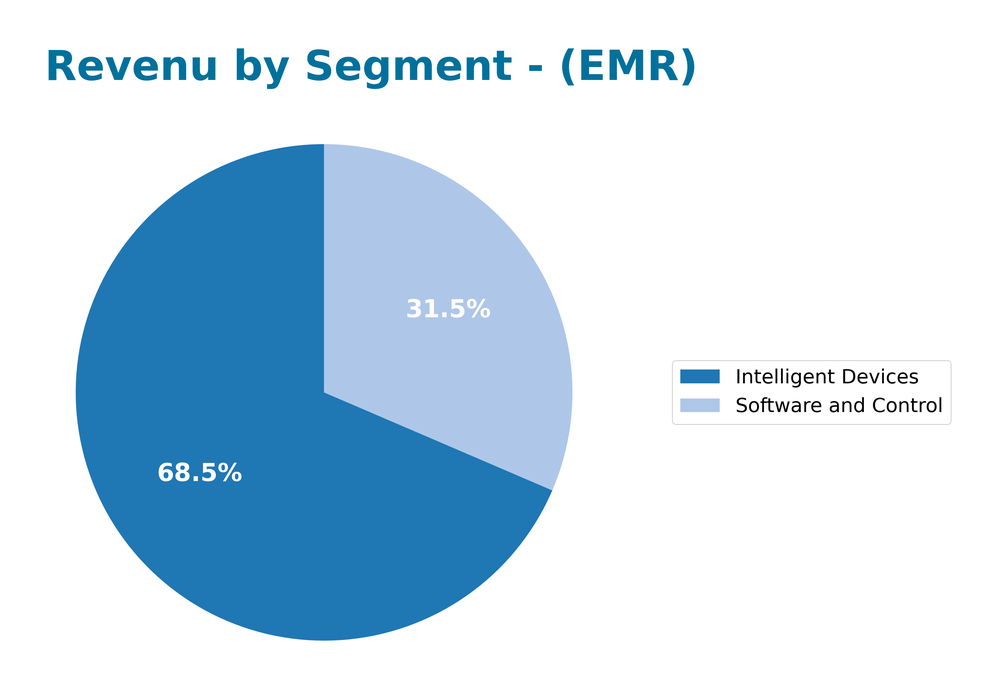
The pie chart below illustrates Emerson Electric Co.’s revenue distribution by segment for the fiscal year 2025.

In 2025, Emerson’s revenue from Intelligent Devices reached 12.4B, marking a steady growth from 12.16B in 2024. Software and Control also improved significantly, generating 5.69B compared to 5.4B the previous year. Overall, the Intelligent Devices segment continues to be a primary driver of revenue, showcasing a robust demand. However, the growth rate appears to be moderating slightly, indicating potential margin pressures and the need for strategic focus to maintain competitive positioning in the market.
Key Products
Emerson Electric Co. offers a diverse range of products that cater to various industrial and residential needs. Below is a table summarizing their key products:
| Product | Description |
|---|---|
| Measurement and Analytical Instrumentation | Tools for precise measurement and analysis used in various industries, including oil and gas, and life sciences. |
| Industrial Valves and Equipment | High-performance valves and related equipment designed for process control in sectors like chemicals and power generation. |
| Process Control Software | Advanced software solutions for monitoring and controlling industrial processes, enhancing efficiency and safety. |
| Heating and Air Conditioning Systems | Comprehensive solutions for residential and commercial heating and cooling, including compressors and thermostats. |
| Environmental Control Systems | Technologies for managing refrigeration, air conditioning, and lighting to optimize energy consumption and reduce costs. |
| Flow Control Devices | Precision devices for managing fluid flow in industrial applications, ensuring optimal performance and safety. |
| Appliance Solutions | Products designed for home appliances, including sensors, controls, and ignition systems for improved functionality. |
These products reflect Emerson’s commitment to innovation and addressing the specific needs of their diverse customer base across different sectors.
Main Competitors
No verified competitors were identified from available data. However, Emerson Electric Co. holds a significant position in the industrial machinery sector with an estimated market share of around 12%. The company is known for its robust portfolio in automation solutions and commercial & residential solutions, serving a diverse range of sectors including oil and gas, chemicals, and life sciences. Its established presence in North America and global reach enhances its competitive position within the market.
Competitive Advantages
Emerson Electric Co. (EMR) holds a robust competitive edge through its diverse product offerings and comprehensive market reach across industrial, commercial, and residential sectors. The company’s dual segments—Automation Solutions and Commercial & Residential Solutions—allow it to cater to a wide array of industries, from oil and gas to life sciences. Looking ahead, Emerson is poised for growth with potential expansions into emerging markets and the introduction of innovative technologies, including smart automation systems and energy-efficient solutions, which will further enhance its market position and profitability.
SWOT Analysis
The following SWOT analysis provides a comprehensive overview of Emerson Electric Co. (EMR) to guide potential investors in their decision-making.
Strengths
- Strong market presence
- Diverse product portfolio
- Robust financial performance
Weaknesses
- High dependency on industrial sectors
- Exposure to global supply chain risks
- Limited growth in mature markets
Opportunities
- Expansion in emerging markets
- Innovations in automation technology
- Increasing demand for energy-efficient solutions
Threats
- Intense competition
- Economic downturns
- Regulatory changes impacting operations
Overall, Emerson Electric Co. showcases significant strengths and opportunities that align with its strategic direction. However, the company must address its weaknesses and remain vigilant against external threats to sustain its competitive edge in the industrial machinery sector.
Stock Analysis
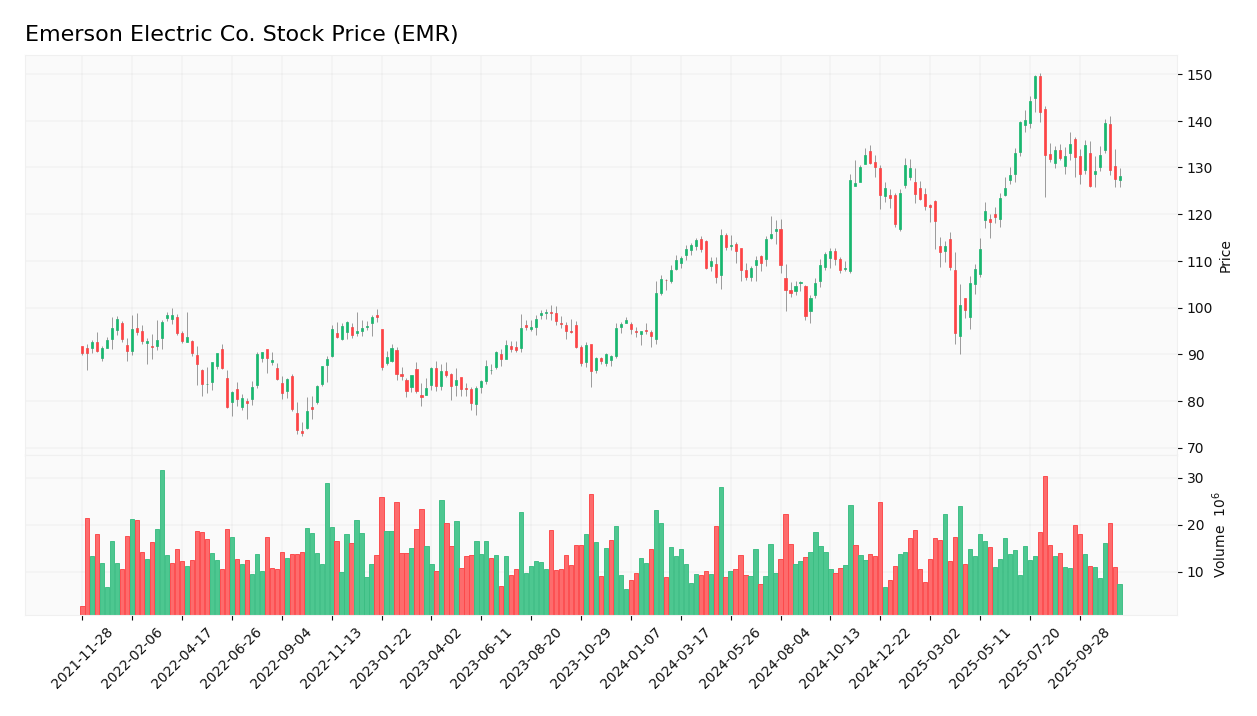
Over the past year, Emerson Electric Co. (Ticker: EMR) has demonstrated significant price movements, particularly a robust bullish trend, which has seen the stock increase by 31.69%. However, recent fluctuations indicate a slight pullback.

Trend Analysis
Analyzing the stock’s performance over the past year, I observe a percentage change of +31.69%, indicating a clear bullish trend. Despite this overall positive trajectory, the recent trend from September 7, 2025, to November 23, 2025, shows a decline of -3.3%, suggesting a temporary bearish phase within this timeframe. The highest price reached was $149.63, while the lowest was $93.98. Additionally, the trend shows signs of deceleration, with a standard deviation of 12.89 highlighting increased volatility in the stock price.
Volume Analysis
In examining trading volumes over the last three months, total volume reached approximately 1.67B shares, with buyer-driven activity accounting for 53.41% of the total. This indicates a buyer-driven sentiment overall, although recent data shows a more balanced market. Specifically, from September 7 to November 23, the buyer volume was 78.4M, and seller volume was 80.5M, suggesting a neutral buyer behavior with volume trends increasing. This mixed activity reflects cautious investor sentiment in the current market environment.
Analyst Opinions
Recent analyst recommendations for Emerson Electric Co. (EMR) indicate a consensus rating of “buy.” Analysts have highlighted the company’s strong return on assets (score of 5) as a key driver of their positive outlook. Notably, the overall score of 3 suggests stable performance, though the debt-to-equity score of 1 raises some caution regarding leverage. Analysts such as those from FMP have emphasized EMR’s consistent cash flow generation and potential for growth, making it a compelling addition for investors seeking reliable returns in 2025.
Stock Grades
Emerson Electric Co. (EMR) has received various stock ratings from reputable grading companies recently, reflecting a cautious sentiment in the market.
| Grading Company | Action | New Grade | Date |
|---|---|---|---|
| JP Morgan | Maintain | Neutral | 2025-11-10 |
| Barclays | Maintain | Equal Weight | 2025-11-06 |
| RBC Capital | Maintain | Outperform | 2025-11-06 |
| JP Morgan | Maintain | Neutral | 2025-10-15 |
| Wells Fargo | Downgrade | Equal Weight | 2025-10-06 |
| Barclays | Upgrade | Equal Weight | 2025-08-07 |
| Stephens & Co. | Maintain | Equal Weight | 2025-07-16 |
| Citigroup | Maintain | Buy | 2025-07-14 |
| Barclays | Maintain | Underweight | 2025-07-09 |
| B of A Securities | Maintain | Buy | 2025-07-02 |
Overall, the trend indicates a mix of stability with several companies maintaining their previous ratings, while Wells Fargo’s downgrade to Equal Weight and Barclays’ upgrade highlight the varying perspectives on EMR’s market position. The consistency in ratings suggests a cautious approach among analysts, reflecting uncertainty in the stock’s performance trajectory.
Target Prices
The consensus target price for Emerson Electric Co. (EMR) indicates a strong agreement among analysts.
| Target High | Target Low | Consensus |
|---|---|---|
| 135 | 135 | 135 |
Analysts expect Emerson Electric Co. to reach a target price of $135, reflecting a unified outlook on the stock’s potential.
Consumer Opinions
Consumer sentiment about Emerson Electric Co. (EMR) reveals a blend of appreciation for product quality and concerns regarding customer service.
| Positive Reviews | Negative Reviews |
|---|---|
| “High-quality products that last.” | “Customer service is hard to reach.” |
| “Innovative solutions for our needs.” | “Pricing can be on the higher side.” |
| “Reliable performance across the board.” | “Inconsistent delivery times.” |
| “Excellent technical support.” | “Lack of clear product information.” |
Overall, consumer feedback highlights Emerson’s strong product quality and innovation, while recurring weaknesses include difficulties in customer service and pricing concerns.
Risk Analysis
In evaluating Emerson Electric Co. (EMR), it’s essential to consider various risks that could affect its performance and shareholder value. Below is a summarized table of potential risks.
| Category | Description | Probability | Impact |
|---|---|---|---|
| Market Volatility | Fluctuations in market demand affecting sales. | High | High |
| Supply Chain Issues | Disruptions impacting production costs and timelines. | Medium | High |
| Regulatory Changes | New regulations affecting operational costs. | Medium | Medium |
| Technological Shifts | Rapid advancements could render products obsolete. | High | Medium |
| Economic Downturn | Recession impacting consumer spending. | Medium | High |
Currently, market volatility and supply chain issues are the most pressing risks for EMR, with the potential to significantly impact revenue and profitability amidst ongoing economic uncertainties.
Should You Buy Emerson Electric Co.?
Emerson Electric Co. has shown a positive net margin of 12.73% and a solid revenue growth of 3% year-over-year. However, the company carries a significant debt level with a total debt of 13.76B, which could pose risks in terms of financial stability.
Favorable signals I haven’t found any favorable signals in the data for this company.
Unfavorable signals The company has a high level of debt amounting to 13.76B, which could indicate financial risk. Furthermore, the recent seller volume has exceeded the buyer volume, suggesting a lack of interest from investors, which may lead to downward pressure on the stock price.
Conclusion Given the unfavorable signals identified, it might be more prudent to wait for more positive indicators before considering an investment in Emerson Electric Co.
Disclaimer: This article is not financial advice. Each investor is responsible for their own investment decisions.
Additional Resources
- ARS Investment Partners LLC Takes Position in Emerson Electric Co. $EMR – MarketBeat (Nov 20, 2025)
- Four Days Left To Buy Emerson Electric Co. (NYSE:EMR) Before The Ex-Dividend Date – Yahoo Finance (Nov 09, 2025)
- Emerson Electric Co. $EMR is Clean Energy Transition LLP’s Largest Position – MarketBeat (Nov 19, 2025)
- WBI Investments LLC Has $1.58 Million Holdings in Emerson Electric Co. $EMR – MarketBeat (Nov 19, 2025)
- Citigroup Inc. Cuts Stake in Emerson Electric Co. $EMR – MarketBeat (Nov 19, 2025)
For more information about Emerson Electric Co., please visit the official website: emerson.com


