Rockwell Automation, Inc. is redefining the landscape of industrial technology, transforming how industries operate and innovate. With a robust portfolio in industrial automation and digital transformation solutions, Rockwell is pivotal in sectors ranging from automotive to renewable energy. Their commitment to quality and cutting-edge innovation has solidified their reputation as a market leader. As we delve into this analysis, we must consider whether Rockwell’s current fundamentals align with its impressive market valuation and growth prospects.

Table of contents
Company Description
Rockwell Automation, Inc. is a prominent player in the industrial automation and digital transformation sector, headquartered in Milwaukee, Wisconsin. Founded in 1903, the company operates across three primary segments: Intelligent Devices, Software & Control, and Lifecycle Services. With a diverse portfolio that includes hardware like drives and sensors, along with software for control and visualization, Rockwell serves a broad array of industries, from automotive to renewable energy. The company predominantly sells through independent distributors and a dedicated direct sales force, ensuring a robust market presence. As a leader in innovation, Rockwell Automation is pivotal in shaping the future of industrial processes and digital ecosystems.
Fundamental Analysis
In this section, I will analyze Rockwell Automation, Inc.’s income statement, financial ratios, and dividend payout policy to evaluate its financial health and performance.
Income Statement
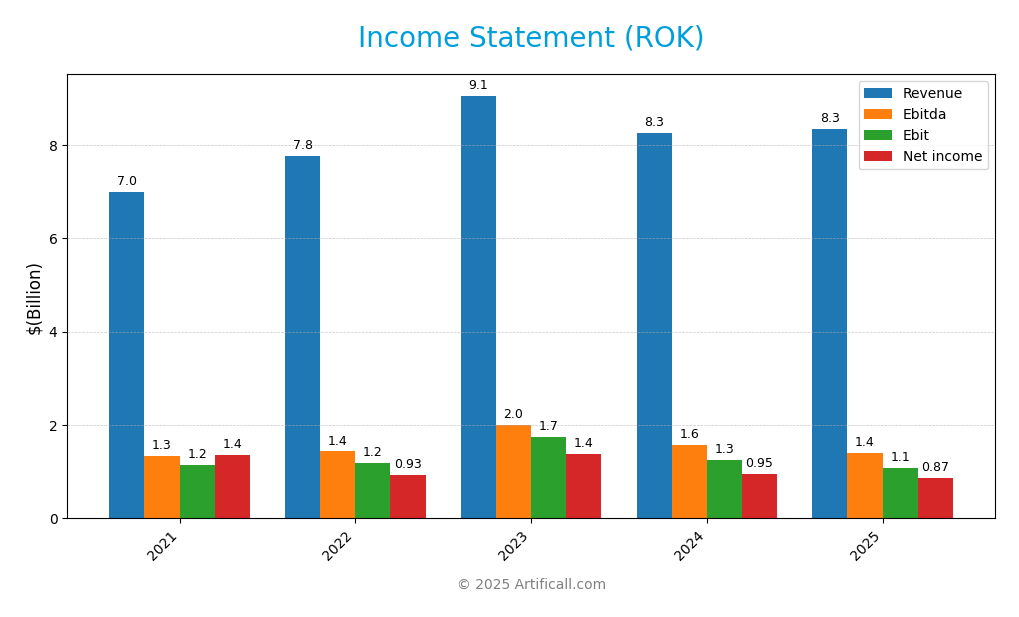
The following table outlines the income statement for Rockwell Automation, Inc. (ticker: ROK) over the last five fiscal years, showcasing trends in revenue, expenses, and net income.

| Item | 2021 | 2022 | 2023 | 2024 | 2025 |
|---|---|---|---|---|---|
| Revenue | 6.997B | 7.760B | 9.058B | 8.262B | 8.342B |
| Cost of Revenue | 4.100B | 4.658B | 5.341B | 4.583B | 4.326B |
| Operating Expenses | 2.168B | 1.767B | 2.024B | 2.414B | 2.594B |
| Gross Profit | 2.897B | 3.102B | 3.717B | 3.679B | 4.016B |
| EBITDA | 1.330B | 1.436B | 1.994B | 1.568B | 1.398B |
| EBIT | 1.152B | 1.198B | 1.744B | 1.250B | 1.073B |
| Interest Expense | 0.093B | 0.120B | 0.132B | 0.151B | 0.156B |
| Net Income | 1.358B | 0.932B | 1.387B | 0.953B | 0.869B |
| EPS | 11.69 | 8.02 | 12.03 | 8.32 | 7.69 |
| Filing Date | Nov 2021 | Nov 2022 | Nov 2023 | Nov 2024 | Nov 2025 |
Interpretation of Income Statement
Over the past five years, Rockwell Automation has experienced a general upward trend in revenue, reaching 8.342B in 2025, a slight increase from 8.262B in 2024. However, net income has shown a decline from its peak of 1.387B in 2023 to 869M in 2025, indicating pressure on profitability. Margins have fluctuated, with gross profit margin improving in 2025 despite a rise in operating expenses. The recent year’s performance highlights a potential slowdown in growth; continued vigilance in managing costs will be crucial for maintaining profitability moving forward.
Financial Ratios
The following table summarizes the key financial ratios for Rockwell Automation, Inc. (ROK) over the most recent years.
| Ratios | 2021 | 2022 | 2023 | 2024 | 2025 |
|---|---|---|---|---|---|
| Net Margin | 19.22% | 11.84% | 15.26% | 11.53% | 0% |
| ROE | 56.26% | 33.72% | 38.79% | 27.23% | 0% |
| ROIC | 16.08% | 13.65% | 16.16% | 12.39% | 0% |
| P/E | 25.37 | 27.13 | 23.76 | 32.13 | 0 |
| P/B | 14.27 | 9.15 | 9.21 | 8.75 | 0 |
| Current Ratio | 1.02 | 1.01 | 1.46 | 1.08 | 2.37 |
| Quick Ratio | 0.76 | 0.72 | 1.04 | 0.72 | 1.56 |
| D/E | 1.83 | 1.53 | 0.94 | 1.17 | 0.97 |
| Debt-to-Assets | 40.97% | 38.88% | 29.50% | 36.37% | 31.67% |
| Interest Coverage | 13.43 | 10.98 | 12.54 | 8.37 | 0 |
| Asset Turnover | 0.65 | 0.72 | 0.80 | 0.74 | – |
| Fixed Asset Turnover | 7.29 | 8.55 | 8.76 | 6.89 | – |
| Dividend Yield | 1.46% | 2.08% | 1.65% | 1.87% | 0% |
Interpretation of Financial Ratios
Analyzing the financial ratios of Rockwell Automation, Inc. (ROK) for the fiscal year ending September 30, 2025, reveals some concerning aspects of its financial health. The current ratio stands strong at 2.37, indicating good liquidity, while the quick ratio of 1.56 also supports this. However, the solvency ratio is at 0, which raises significant red flags about long-term sustainability. Profitability ratios are notably absent, indicating either no profits or reporting issues. The debt ratios, such as the debt-to-equity ratio of 0.97 and debt-to-assets ratio of 0.32, suggest moderate leverage but must be interpreted cautiously given the lack of profitability metrics. Overall, the absence of profit margins and solvency concerns could pose risks for investors.
Evolution of Financial Ratios
Over the past five years, Rockwell Automation’s financial ratios exhibited significant volatility. While liquidity ratios improved markedly from 1.01 in 2022 to 2.37 in 2025, profitability ratios have deteriorated, showing a concerning trend of declining margins and potential operational challenges.
Distribution Policy
Rockwell Automation, Inc. (ROK) does not currently pay dividends, reflecting a strategic focus on reinvestment and growth. This approach supports ongoing innovation and potential acquisitions, aligning with long-term shareholder value creation. Additionally, the company engages in share buybacks, which can enhance shareholder returns. However, the absence of dividends may also indicate risks, particularly if growth opportunities diminish. Overall, this distribution strategy appears to support sustainable long-term value for shareholders.
Sector Analysis
Rockwell Automation, Inc. operates in the industrial machinery sector, providing automation and digital transformation solutions. Key products include intelligent devices and software, with competitors like Siemens and Honeywell.
Strategic Positioning
Rockwell Automation, Inc. (ROK) holds a significant position in the industrial automation market, boasting a market capitalization of approximately $41.8B. The company focuses on three primary segments: Intelligent Devices, Software & Control, and Lifecycle Services, which collectively enhance its competitive edge. With a beta of 1.507, ROK faces competitive pressure from emerging technologies and market players, necessitating continuous innovation. The company’s solutions cater to diverse industries, from automotive to renewable energy, positioning it well to adapt to technological disruptions while maintaining a robust market share.
Revenue by Segment
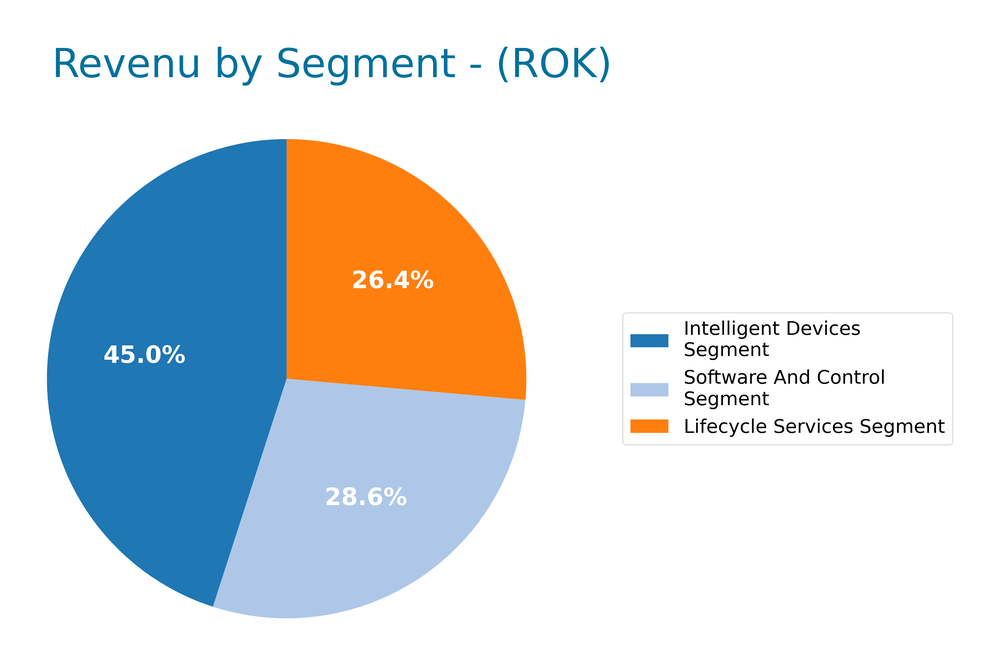
The pie chart below illustrates Rockwell Automation’s revenue distribution by segment for the fiscal year 2025.

In FY 2025, Rockwell Automation’s revenue shows a diverse segment performance. The Intelligent Devices Segment leads with $3.76B, followed by Lifecycle Services at $2.20B, and Software and Control at $2.38B. Despite a slight decline in the Intelligent Devices Segment from $3.80B in FY 2024, both Lifecycle Services and Software and Control witnessed growth, indicating a shift towards more service-oriented solutions. The overall performance suggests a cautious approach to growth, with a potential risk in reliance on the Intelligent Devices Segment, which may face margin pressures in a competitive market.
Key Products
Rockwell Automation, Inc. offers a diverse range of products that cater to various industries and applications. Below is a summary of some of their key products:
| Product | Description |
|---|---|
| Drives | Electrical devices that control the speed and torque of electric motors, optimizing performance and efficiency. |
| Industrial Components | A range of hardware solutions including sensors, safety devices, and motion control systems for various applications. |
| Control Software | Advanced software solutions for process control, automation, and data visualization to enhance operational efficiency. |
| Digital Twin Software | Tools that create virtual representations of physical assets to simulate and analyze performance in real-time. |
| Consulting Services | Expert advisory services aimed at optimizing manufacturing processes and implementing digital transformation strategies. |
| Lifecycle Services | Comprehensive support including maintenance, upgrades, and training to ensure long-term operational effectiveness. |
This table provides a snapshot of Rockwell Automation’s offerings, which are vital for industries looking to enhance automation and digital transformation efforts.
Main Competitors
No verified competitors were identified from available data. However, Rockwell Automation, Inc. holds a significant position in the industrial automation and machinery sector, with an estimated market share suggesting strong competitive dynamics in its market. The company focuses on various end markets, including automotive, life sciences, and renewable energy, underscoring its diverse customer base and sector dominance.
Competitive Advantages
Rockwell Automation, Inc. (ROK) boasts significant competitive advantages, including a strong market position in industrial automation and digital transformation solutions. With a focus on three key segments—Intelligent Devices, Software & Control, and Lifecycle Services—ROK is well-equipped to meet diverse customer needs across various industries. Looking ahead, the company is poised to capitalize on emerging opportunities in renewable energy and smart manufacturing, positioning itself for growth through innovative product development and expansion into new markets. This strategic direction enhances its resilience and ability to adapt to evolving industry demands.
SWOT Analysis
This SWOT analysis provides a strategic overview of Rockwell Automation, Inc. (ROK), highlighting its strengths, weaknesses, opportunities, and threats.
Strengths
- Strong market position
- Diverse product portfolio
- Experienced management team
Weaknesses
- High reliance on distributors
- Vulnerability to economic cycles
- Limited brand recognition in some markets
Opportunities
- Growth in industrial automation
- Expansion in emerging markets
- Increasing demand for digital transformation
Threats
- Intense competition
- Supply chain disruptions
- Economic downturns
The overall SWOT assessment indicates that Rockwell Automation has a solid foundation with strong market positioning and opportunities for growth. However, it must address its weaknesses and remain vigilant against competitive threats to sustain its success and strategic direction.
Stock Analysis
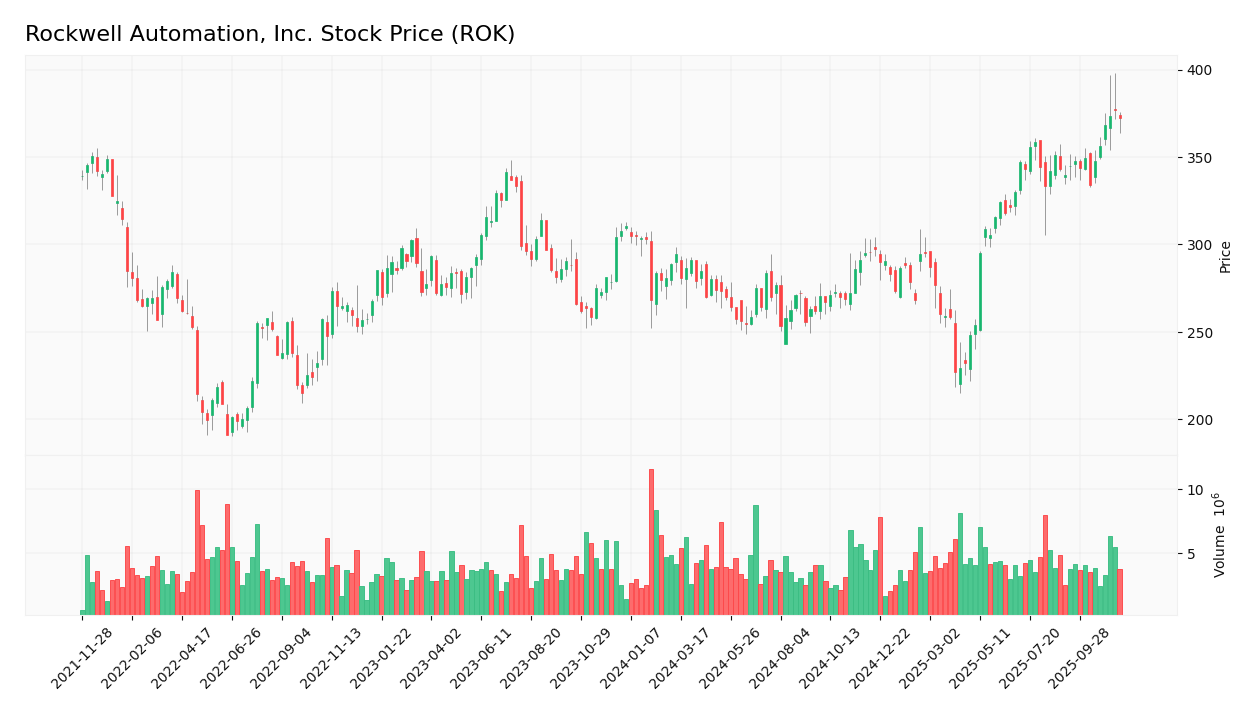
Over the past year, Rockwell Automation, Inc. (ROK) has experienced significant price movements, showcasing a bullish trend with notable price fluctuations that reflect dynamic trading activity.

Trend Analysis
Analyzing the stock’s performance over the past two years, ROK has demonstrated a percentage change of +19.97%. This indicates a bullish trend, supported by an acceleration in price movement. The highest price recorded was 377.13, while the lowest was 227.11. The standard deviation of 35.15 suggests a relatively high level of volatility in the stock’s price movements.
Volume Analysis
Examining trading volumes over the last three months, the total volume reached 512.48M, with buyer-driven activity being prominent at 54.39%. The volume trend is currently increasing, which indicates strong investor sentiment and robust market participation, particularly with a recent buyer dominance of 71.11% during the latest period analyzed. This suggests that investors are favoring buying positions in ROK, reinforcing the overall bullish sentiment surrounding the stock.
Analyst Opinions
Recent analyst recommendations for Rockwell Automation, Inc. (ROK) indicate a cautious stance. The overall rating stands at C-, with analysts highlighting concerns regarding return on equity and high debt-to-equity ratios. Notably, the discounted cash flow score remains relatively better, suggesting some potential for future growth. Analysts recommend a “hold” position, citing the need for improved financial metrics before considering a buy. The consensus for the current year leans towards a cautious hold rather than a strong buy or sell.
Stock Grades
Rockwell Automation, Inc. (ROK) has received regular assessments from reputable grading companies, reflecting a cautious outlook among analysts.
| Grading Company | Action | New Grade | Date |
|---|---|---|---|
| JP Morgan | maintain | Neutral | 2025-11-11 |
| Morgan Stanley | maintain | Overweight | 2025-11-10 |
| Barclays | maintain | Overweight | 2025-11-07 |
| Wells Fargo | maintain | Equal Weight | 2025-11-07 |
| JP Morgan | maintain | Neutral | 2025-10-15 |
| Oppenheimer | maintain | Outperform | 2025-10-14 |
| Wells Fargo | maintain | Equal Weight | 2025-10-06 |
| Barclays | maintain | Overweight | 2025-08-14 |
| Wells Fargo | downgrade | Equal Weight | 2025-08-08 |
| Oppenheimer | maintain | Outperform | 2025-08-07 |
Overall, the trend shows that while several analysts maintain their positive outlooks (e.g., Overweight and Outperform), there is a notable downgrade from Wells Fargo, indicating a more cautious sentiment. The consistent grading from multiple firms suggests a stable, yet watchful perspective on Rockwell’s performance.
Target Prices
The consensus target prices for Rockwell Automation, Inc. (ROK) indicate a positive outlook among analysts.
| Target High | Target Low | Consensus |
|---|---|---|
| 391 | 345 | 371.5 |
Overall, analysts expect ROK to reach a target price around 371.5, reflecting a balanced view between the high and low estimates.
Consumer Opinions
Consumer sentiment toward Rockwell Automation, Inc. (ROK) reveals a mix of satisfaction and areas for improvement, showcasing the complexities of their market presence.
| Positive Reviews | Negative Reviews |
|---|---|
| “Exceptional customer support and service.” | “High prices limit accessibility for small firms.” |
| “Innovative solutions that drive efficiency.” | “Software updates can be buggy and slow.” |
| “Reliable products that boost productivity.” | “Long lead times on product delivery.” |
Overall, consumer feedback indicates strong appreciation for Rockwell’s innovative products and customer support, while concerns about pricing and software issues persist.
Risk Analysis
In evaluating Rockwell Automation, Inc. (ROK), it’s crucial to understand the potential risks that could impact its performance. Below is a summary of the key risks.
| Category | Description | Probability | Impact |
|---|---|---|---|
| Market Volatility | Fluctuations in the economy affecting demand for automation solutions. | High | High |
| Supply Chain Disruptions | Dependence on global suppliers may lead to delays and increased costs. | Medium | High |
| Technological Changes | Rapid advancements in technology could render current solutions obsolete. | High | Medium |
| Regulatory Risks | Changes in regulations impacting manufacturing and automation standards. | Medium | Medium |
| Competition | Increasing competition in the automation sector may pressure margins. | High | Medium |
Synthesizing these risks, I find that market volatility and supply chain disruptions are the most likely and impactful risks for ROK, particularly in a fluctuating economic environment.
Should You Buy Rockwell Automation, Inc.?
Rockwell Automation, Inc. (ROK) has demonstrated a positive trend in profitability with a net income of 869M, although it currently has a negative net margin of 0. It is carrying a total debt of 3.65B, posing potential risks for investors. The fundamentals have shown fluctuations, with a recent rating of C-, indicating average performance.
Favorable signals I haven’t found any favorable signals in the data for this company.
Unfavorable signals The company has a negative net margin, which indicates a lack of profitability. Additionally, the total debt of 3.65B could be concerning, especially in relation to its equity. The current rating of C- also suggests that the company is not performing at an optimal level compared to its peers.
Conclusion Given the negative net margin and unfavorable signals, it might be prudent to wait before considering any investment in Rockwell Automation, Inc.
Additional Resources
- Rockwell Automation to Build New Greenfield Manufacturing Site in Southeastern Wisconsin – Business Wire (Nov 18, 2025)
- Rockefeller Capital Management L.P. Raises Stock Holdings in Rockwell Automation, Inc. $ROK – MarketBeat (Nov 19, 2025)
- International Markets and Rockwell Automation (ROK): A Deep Dive for Investors – Yahoo Finance (Nov 17, 2025)
- Is Wall Street Bullish or Bearish on Rockwell Automation Stock? – Barchart.com (Nov 18, 2025)
- Rockwell Returns to Growth in Fourth Quarter on Strong Automation Orders – Morningstar (Nov 18, 2025)
For more information about Rockwell Automation, Inc., please visit the official website: rockwellautomation.com


