Home > Analyses > Basic Materials > Anfield Energy Inc. Common Shares
Anfield Energy Inc. transforms the landscape of mineral exploration by tapping into critical resources like vanadium, uranium, and gold within the United States. As a nimble player in the industrial materials sector, Anfield stands out for its focused approach to developing mineral properties with significant potential. Known for its strategic exploration and resource development, the company’s ability to navigate market cycles and commodity demands is key. The question now is whether Anfield’s fundamentals support its current valuation and promise sustainable growth for investors.
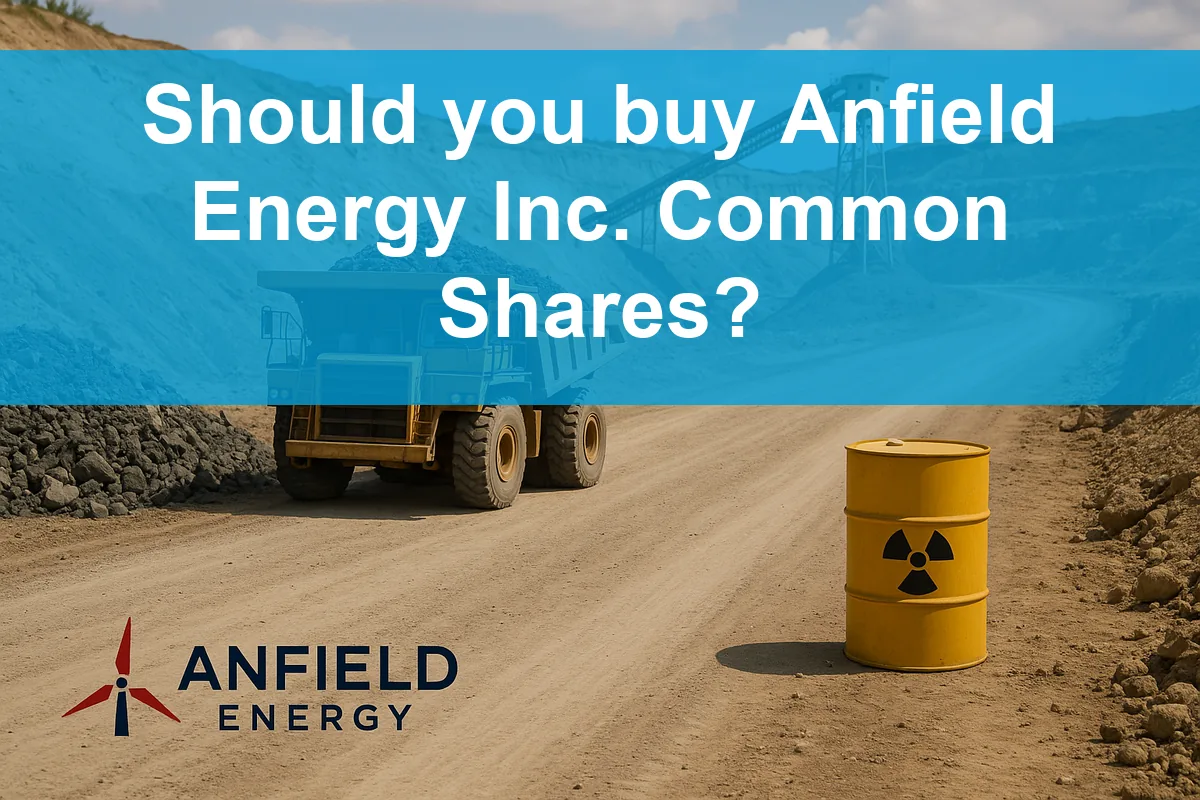
Table of contents
Business Model & Company Overview
Anfield Energy Inc. Common Shares, trading under ticker AEC, was incorporated in 1989 and is headquartered in Burnaby, Canada. The company operates within the Industrial Materials sector, focusing on the exploration, evaluation, development, and production of mineral properties. Its core mission revolves around discovering and extracting vanadium, uranium, and gold deposits, creating an integrated ecosystem aimed at supporting sustainable resource development in the United States.
The company’s revenue engine is driven by its mineral exploration and production activities, balancing its asset portfolio across critical metals with strategic importance. Despite a compact team of five full-time employees, Anfield Energy maintains a presence on the NASDAQ Global Select exchange, reflecting investor confidence and its aspirations in global commodity markets across the Americas. Its economic moat lies in its specialized focus on scarce minerals crucial to future energy and industrial applications.
Financial Performance & Fundamental Metrics
In this section, I analyze Anfield Energy Inc. Common Shares’ income statement, key financial ratios, and dividend payout policy to assess its overall financial health.
Income Statement
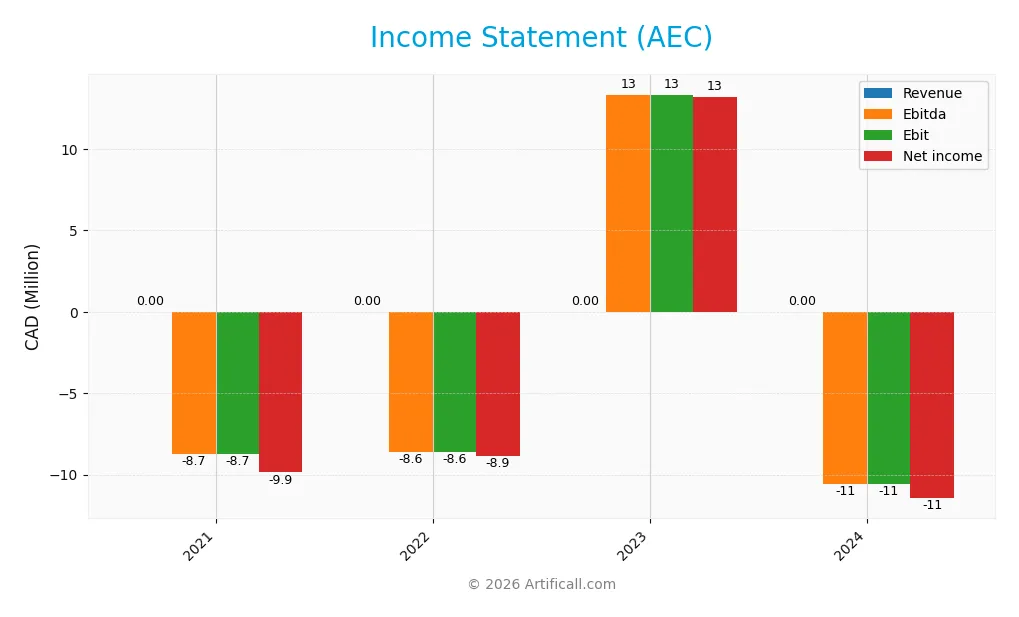
The table below presents Anfield Energy Inc.’s key income statement figures for the fiscal years 2021 through 2024, expressed in CAD.
| 2021 | 2022 | 2023 | 2024 | |
|---|---|---|---|---|
| Revenue | 0 | 0 | 0 | 0 |
| Cost of Revenue | 0 | 0 | 3.8K | 3.9K |
| Operating Expenses | 6.96M | 9.11M | 11.22M | 11.35M |
| Gross Profit | 0 | 0 | -3.8K | -3.9K |
| EBITDA | -8.73M | -8.58M | 13.32M | -10.58M |
| EBIT | -8.73M | -8.58M | 13.32M | -10.58M |
| Interest Expense | 1.14M | 277K | 141K | 861K |
| Net Income | -9.86M | -8.86M | 13.18M | -11.45M |
| EPS | -3.00 | -1.50 | 1.50 | -0.75 |
| Filing Date | 2021-12-31 | 2022-12-31 | 2023-12-31 | 2024-12-31 |
Income Statement Evolution
From 2021 to 2024, Anfield Energy Inc. reported zero revenue consistently, with gross profits remaining negative due to ongoing costs. Net income fluctuated significantly, peaking positively in 2023 at CAD 13.2M before dropping to a loss of CAD 11.4M in 2024. Margins stayed unfavorable throughout, with no improvements in gross or net margin over the period.
Is the Income Statement Favorable?
The 2024 income statement shows a net loss of CAD 11.4M and negative EBITDA of CAD 10.6M, reflecting persistent operating expenses exceeding any income. Interest expense is relatively favorable, but overall fundamentals are unfavorable due to zero revenue, negative margins, and declining net income growth. The company’s financials indicate ongoing challenges in generating profit.
Financial Ratios
The table below presents key financial ratios for Anfield Energy Inc. Common Shares (AEC) over the fiscal years 2021 to 2024, providing a snapshot of the company’s profitability, liquidity, leverage, and valuation metrics:
| Ratios | 2021 | 2022 | 2023 | 2024 |
|---|---|---|---|---|
| Net Margin | 0 | 0 | 0 | 0 |
| ROE | 0.7001 | -0.6028 | 0.2657 | -0.2551 |
| ROIC | 0 | 0 | -0.1505 | -0.1453 |
| P/E | -2.1417 | -5.2804 | 5.3807 | -8.5736 |
| P/B | -1.4993 | 3.1830 | 1.4294 | 2.1868 |
| Current Ratio | 0.222 | 19.996 | 6.509 | 0.318 |
| Quick Ratio | 0.222 | 19.996 | 6.509 | 0.318 |
| D/E | 0 | 0 | 0.0545 | 0.2069 |
| Debt-to-Assets | 0 | 0 | 0.0359 | 0.1160 |
| Interest Coverage | 0 | 0 | -79.6897 | -13.1847 |
| Asset Turnover | 0 | 0 | 0 | 0 |
| Fixed Asset Turnover | 0 | 0 | 0 | 0 |
| Dividend Yield | 0 | 0 | 0 | 0 |
Evolution of Financial Ratios
From 2021 to 2024, Anfield Energy Inc.’s Return on Equity (ROE) shifted markedly, reaching -25.51% in 2024, indicating declining profitability. The Current Ratio plummeted from a high of nearly 20 in 2022 to 0.32 in 2024, signifying reduced liquidity. Meanwhile, the Debt-to-Equity Ratio increased moderately to 0.21 in 2024, suggesting a cautious rise in leverage. Profitability remained weak and unstable throughout this period.
Are the Financial Ratios Favorable?
In 2024, Anfield Energy’s financial ratios predominantly signal challenges. Profitability metrics, including net margin and ROE, are unfavorable, reflecting losses. Liquidity ratios such as the current and quick ratios are low, highlighting short-term financial stress. However, debt-related ratios like debt-to-equity and debt-to-assets are favorable, indicating manageable leverage. Market valuation ratios provide a mixed view, with a negative PE ratio but a neutral price-to-book ratio. Overall, the ratios are generally unfavorable.
Shareholder Return Policy
Anfield Energy Inc. does not pay dividends, reflecting its negative net income and consistent free cash flow deficits. The company’s strategy appears focused on reinvestment and managing operational challenges, with no share buyback programs reported.
This absence of distributions aligns with a growth or restructuring phase, potentially prioritizing long-term value creation over immediate returns. However, the lack of shareholder returns underscores the importance of monitoring operational improvements for sustainable value generation.
Score analysis
The following radar chart illustrates the company’s performance across key financial metrics:
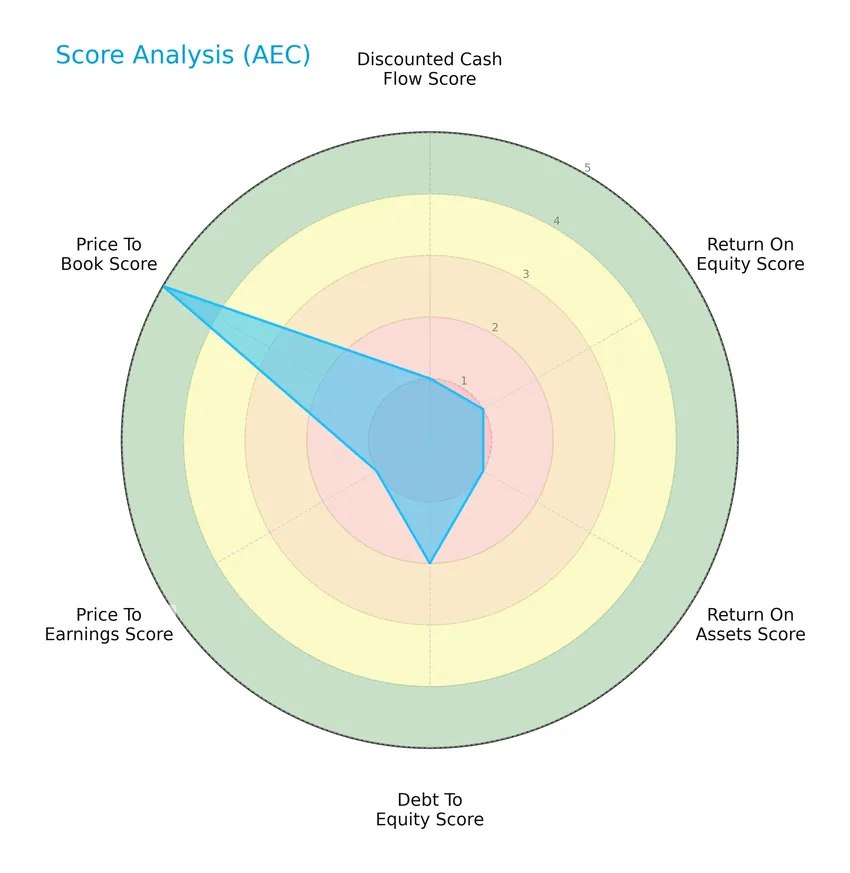
Anfield Energy Inc. displays very unfavorable scores in discounted cash flow, return on equity, return on assets, and price-to-earnings ratios. The debt-to-equity score is moderate, while the price-to-book score is very favorable, indicating mixed financial indicators.
Analysis of the company’s bankruptcy risk
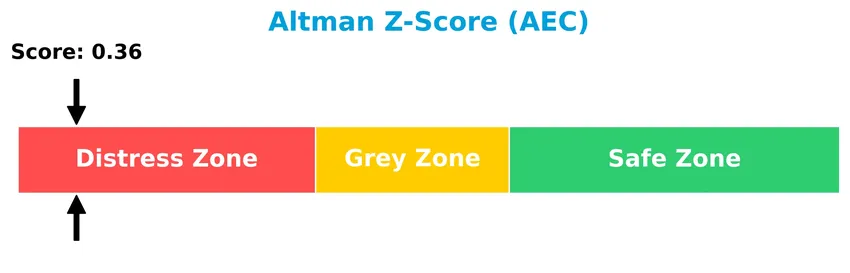
The Altman Z-Score places the company firmly in the distress zone, signaling a high risk of financial distress and potential bankruptcy:
Is the company in good financial health?
The Piotroski Score diagram provides insight into the company’s financial strength based on nine key criteria:

With a very weak Piotroski Score of 2, the company demonstrates poor financial health, suggesting significant challenges in profitability, leverage, liquidity, and operational efficiency.
Competitive Landscape & Sector Positioning
This sector analysis will cover Anfield Energy Inc.’s strategic positioning, revenue by segment, key products, main competitors, competitive advantages, and SWOT analysis. I will assess whether Anfield Energy holds a competitive advantage relative to its industry peers.
Strategic Positioning
Anfield Energy Inc. concentrates its operations on the exploration and production of mineral properties within the United States, focusing on vanadium, uranium, and gold deposits. The company maintains a specialized product portfolio and geographic exposure centered on industrial materials in North America.
Key Products & Brands
The following table outlines the key products and brands offered by Anfield Energy Inc.:
| Product | Description |
|---|---|
| Vanadium Deposits | Exploration, evaluation, development, and production of vanadium mineral properties in the US. |
| Uranium Deposits | Exploration and development activities focused on uranium mineral resources in the US. |
| Gold Deposits | Exploration and production of gold mineral properties within the United States. |
Anfield Energy Inc. specializes in the exploration and production of vanadium, uranium, and gold mineral properties primarily within the United States. The company operates with a focused portfolio in the basic materials sector.
Main Competitors
There are 21 competitors in total, with the table below listing the top 10 leaders by market capitalization:
| Competitor | Market Cap. |
|---|---|
| Linde plc | 200.4B |
| Newmont Corporation | 110.5B |
| CRH plc | 84.8B |
| The Sherwin-Williams Company | 81.5B |
| Freeport-McMoRan Inc. | 74.6B |
| Ecolab Inc. | 74.4B |
| Air Products and Chemicals, Inc. | 55.8B |
| Corteva, Inc. | 45.8B |
| Nucor Corporation | 38.8B |
| Vulcan Materials Company | 38.7B |
Anfield Energy Inc. Common Shares ranks 21st among 21 competitors, with a market capitalization just 0.07% of the top leader, Linde plc. The company’s market cap is well below both the average market cap of the top 10 competitors (80.5B) and the sector median (38.3B). Its market cap is significantly distant from the next closest competitor above, showing a substantial gap in scale.
Does AEC have a competitive advantage?
Anfield Energy Inc. does not present a competitive advantage as its return on invested capital (ROIC) is significantly below its weighted average cost of capital (WACC), indicating value destruction. The company’s financial performance from 2021 to 2024 shows unfavorable margins and declining net income, reflecting challenges in profitability and operational efficiency.
Looking forward, Anfield Energy focuses on exploration and development of vanadium, uranium, and gold deposits within the United States, which could offer new opportunities. However, current financial indicators and value creation metrics suggest limited competitive strength in the near term.
Comparisons with competitors
Check out how we compare the company to its competitors:
Aucun article trouvé pour ces critères.
SWOT Analysis
This SWOT analysis highlights the key internal and external factors influencing Anfield Energy Inc.’s current strategic position and investment outlook.
Strengths
- Focus on vanadium, uranium, and gold exploration
- Low debt-to-equity ratio of 0.21
- Listing on NASDAQ Global Select for liquidity
Weaknesses
- Negative profitability metrics and margins
- Very weak financial health scores (Altman Z-score in distress zone, Piotroski score 2)
- Low liquidity ratios (current and quick ratio 0.32)
Opportunities
- Growing demand for critical minerals in clean energy transition
- Potential exploration success in US mineral properties
- Market interest in industrial materials sector
Threats
- High beta (2.1) indicating stock volatility
- Unfavorable income and ratio trends
- Competitive pressures and regulatory risks in mining sector
Anfield Energy faces significant financial and operational challenges, reflected in weak profitability and liquidity metrics, which constrain its risk profile. However, its focus on strategic minerals positions it to capitalize on emerging market demand. Investors should weigh these risks carefully and monitor exploration outcomes and financial improvements before increasing exposure.
Stock Price Action Analysis
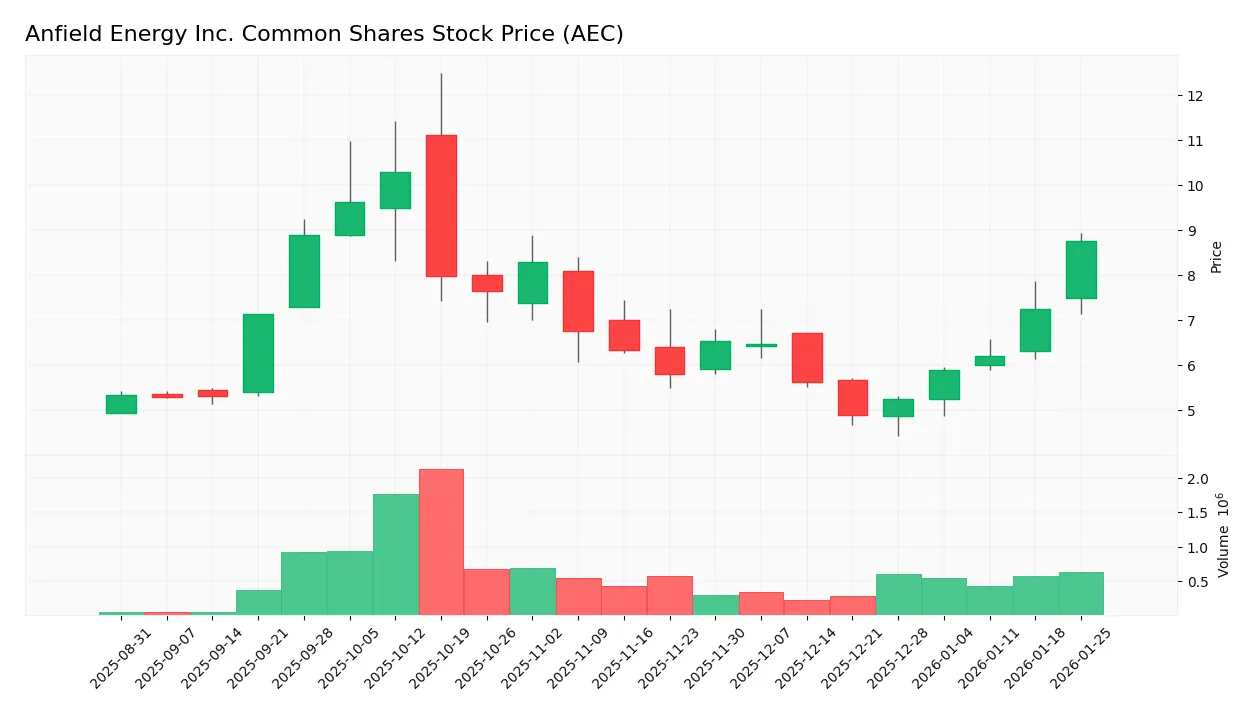
The following weekly chart displays Anfield Energy Inc. Common Shares (AEC) price movements over the past 12 months, highlighting key highs and lows:
Trend Analysis
Over the past 12 months, AEC’s stock price increased by 63.55%, indicating a bullish trend with acceleration. The price ranged between 4.9 and a high of 10.29, supported by a moderate volatility level (standard deviation 1.49). Recent weeks show a 29.44% gain with stable upward momentum (slope 0.09).
Volume Analysis
In the last three months, trading volume shows a decreasing trend with a total of 5.5M shares traded. Buyer activity remains dominant at 55.96%, though only slightly, compared to sellers. This suggests cautious investor participation with a mild preference toward accumulating shares rather than selling.
Target Prices
No verified target price data is available from recognized analysts for Anfield Energy Inc. Common Shares (AEC). Investors should rely on fundamental analysis and market conditions when considering this stock.
Analyst & Consumer Opinions
This section presents a detailed review of analyst ratings and consumer feedback regarding Anfield Energy Inc. Common Shares (AEC).

Don’t Let Luck Decide Your Entry Point
Optimize your entry points with our advanced ProRealTime indicators. You’ll get efficient buy signals with precise price targets for maximum performance. Start outperforming now!
Stock Grades
No verified stock grades were available from recognized analysts for Anfield Energy Inc. Common Shares. Investors must therefore rely on other sources of information to assess this stock’s potential.
Consumer Opinions
Anfield Energy Inc. has sparked diverse reactions among consumers, reflecting a blend of enthusiasm and areas for improvement.
| Positive Reviews | Negative Reviews |
|---|---|
| “Strong commitment to sustainable energy solutions.” | “Customer support response times can be slow.” |
| “Innovative technology with promising growth potential.” | “Stock volatility makes it a risky investment.” |
| “Transparent communication from management.” | “Limited product range compared to competitors.” |
Overall, consumers appreciate Anfield Energy’s innovation and transparency but express concerns about customer service and stock stability, indicating room for operational enhancements.
Risk Analysis
Below is an overview of key risks facing Anfield Energy Inc., highlighting their likelihood and potential impact on investors:
| Category | Description | Probability | Impact |
|---|---|---|---|
| Financial Stability | Company is in financial distress with a low Altman Z-Score (0.36), indicating high bankruptcy risk. | High | High |
| Profitability | Negative ROE (-25.51%) and net margin at 0% signal ongoing unprofitability. | High | High |
| Liquidity | Very low current and quick ratios (0.32) show weak liquidity and potential cash flow problems. | High | Medium |
| Market Volatility | High beta (2.10) suggests significant stock price fluctuations relative to the market. | Medium | Medium |
| Operational Risk | Minimal asset turnover and fixed asset turnover (both 0) reflect inefficiencies in asset use. | Medium | Medium |
| Dividend Policy | No dividend yield, implying no income return to shareholders currently. | Medium | Low |
The most pressing risks for Anfield Energy stem from its precarious financial health and persistent unprofitability. Its Altman Z-Score places it firmly in the distress zone, signaling a high likelihood of bankruptcy if conditions do not improve. Coupled with weak liquidity and operational inefficiencies, cautious risk management is essential when considering investment in this company.
Should You Buy Anfield Energy Inc. Common Shares?
Anfield Energy Inc. appears to be experiencing weak profitability with a deteriorating value creation profile and an unfavorable competitive moat, while maintaining a moderate leverage profile. Despite a very weak financial strength score, its overall rating could be seen as cautious with significant risks.
Strength & Efficiency Pillars
Anfield Energy Inc. Common Shares displays limited financial strength, with a return on equity of -25.51% and a return on invested capital (ROIC) of -14.53%, both unfavorable and indicating operational inefficiencies. The weighted average cost of capital (WACC) stands at 13.53%, exceeding ROIC, confirming that the company is currently destroying value rather than creating it. Financial health metrics further reinforce concerns, as the Altman Z-Score is deeply in the distress zone at 0.36, and the Piotroski Score is very weak at 2, signaling elevated bankruptcy risk and fragile fundamentals.
Weaknesses and Drawbacks
The valuation and liquidity profile of Anfield Energy raises caution. Despite a negative price-to-earnings ratio of -8.57 (favorable due to negative earnings), the price-to-book ratio of 2.19 is neutral but suggests the stock may not be undervalued. The company’s current ratio and quick ratio both sit at a precarious 0.32, signaling limited short-term liquidity and potential difficulties covering immediate obligations. Interest coverage is negative at -12.29, exposing vulnerability to financial distress. Although debt-to-equity is low at 0.21, these liquidity weaknesses and poor earnings performance represent significant short-term risks.
Our Verdict about Anfield Energy Inc. Common Shares
The company’s long-term fundamental profile appears unfavorable given its operational losses, weak profitability, and financial distress indicators. However, the stock exhibits a bullish overall trend with recent price appreciation of 29.44% and a slightly buyer-dominant recent period, suggesting positive market sentiment. Despite this, the fundamental weaknesses and financial fragility imply that Anfield Energy might appear attractive only for investors with high risk tolerance and a speculative outlook, while others may prefer a wait-and-see approach.
Disclaimer: This content is for informational purposes only and does not constitute financial, investment, or other professional advice. Investing in financial markets involves a significant risk of loss, and past performance is not indicative of future results.
Additional Resources
- Anfield Energy (NASDAQ: AEC) closes US$10M share and receipt financing – Stock Titan (Jan 13, 2026)
- Anfield Energy Sets February 27, 2026 Special Meeting for Security Holders – TipRanks (Jan 15, 2026)
- Anfield Receives Approval to List on NASDAQ – Investing News Network (Sep 17, 2025)
- Uranium Energy Corp Increases Holdings in Anfield Energy – The Globe and Mail (Jun 20, 2025)
- Anfield Energy Announces Appointment of Lubica Niemann as Chief Financial Officer – The Manila Times (Dec 29, 2025)
For more information about Anfield Energy Inc. Common Shares, please visit the official website: anfieldenergy.com