Home > Analyses > Technology > Uber Technologies, Inc.
Uber Technologies, Inc. revolutionizes urban mobility and delivery, reshaping how millions move and access goods daily. Its platform seamlessly connects riders, diners, and shippers with service providers across multiple continents. Renowned for innovation, Uber leads the software application space by expanding beyond ridesharing into delivery and freight logistics. As competition intensifies and market dynamics shift, I examine whether Uber’s core fundamentals still support its sizeable market valuation and future growth prospects.

Table of contents
Business Model & Company Overview
Uber Technologies, Inc., founded in 2009 and headquartered in San Francisco, commands a dominant position in the application software industry. Its ecosystem seamlessly connects consumers with independent providers across mobility, delivery, and freight services. This integrated platform spans diverse transport modes and delivery options, creating a comprehensive network that reshapes urban mobility and logistics.
Uber’s revenue engine balances Mobility rides, Delivery meal and grocery services, and Freight logistics solutions. It leverages proprietary technology to offer transparent pricing and streamlined booking, fueling growth across the Americas, Europe, and Asia Pacific. This competitive advantage secures Uber’s role as a transformative force, building a resilient economic moat in the evolving digital transportation landscape.
Financial Performance & Fundamental Metrics
I analyze Uber Technologies, Inc.’s income statement, key financial ratios, and dividend payout policy to assess its profitability, efficiency, and shareholder returns.
Income Statement
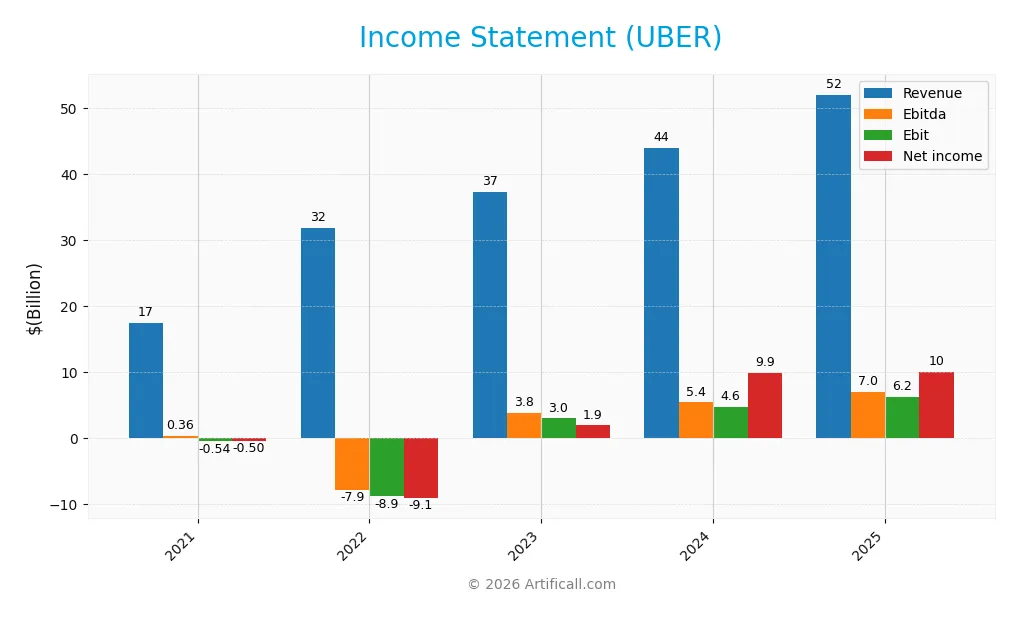
The following table summarizes Uber Technologies, Inc.’s key income statement figures for fiscal years 2021 through 2025, reported in USD.
| 2021 | 2022 | 2023 | 2024 | 2025 | |
|---|---|---|---|---|---|
| Revenue | 17.5B | 31.9B | 37.3B | 43.9B | 52.0B |
| Cost of Revenue | 9.4B | 19.7B | 22.5B | 26.7B | 31.3B |
| Operating Expenses | 11.9B | 14.1B | 13.7B | 14.5B | 15.1B |
| Gross Profit | 8.1B | 12.2B | 14.8B | 17.3B | 20.7B |
| EBITDA | 360M | -7.9B | 3.8B | 5.4B | 7.0B |
| EBIT | -542M | -8.9B | 3.0B | 4.6B | 6.2B |
| Interest Expense | 483M | 565M | 633M | 523M | 440M |
| Net Income | -496M | -9.1B | 1.9B | 9.9B | 10.1B |
| EPS | -0.26 | -4.64 | 0.90 | 4.71 | 4.82 |
| Filing Date | 2022-02-24 | 2023-02-21 | 2024-02-15 | 2025-02-14 | 2026-02-13 |
Income Statement Evolution
Uber’s revenue surged from $17.5B in 2021 to $52B in 2025, reflecting strong demand growth. Net income turned sharply positive, rising from a loss of $496M in 2021 to a $10B profit in 2025. Gross margin improved to nearly 40%, while EBIT margin expanded to 12%, signaling better cost control and operational leverage.
Is the Income Statement Favorable?
In 2025, Uber posted a $10B net income on $52B revenue, with a 19.3% net margin, outperforming many peers. EBITDA and EBIT margins showed healthy gains, and interest expenses remained low at 0.85% of revenue. Despite a slight dip in net margin year-over-year, overall fundamentals are strong, supported by consistent revenue and earnings growth.
Financial Ratios
The table below presents key financial ratios for Uber Technologies, Inc. over the last five fiscal years, illustrating profitability, liquidity, leverage, efficiency, and shareholder returns:
| Ratios | 2021 | 2022 | 2023 | 2024 | 2025 |
|---|---|---|---|---|---|
| Net Margin | -2.8% | -28.7% | 5.1% | 22.4% | 19.3% |
| ROE | -3.4% | -124.5% | 16.8% | 45.7% | 37.2% |
| ROIC | -6.8% | -7.6% | 3.4% | 6.8% | 11.2% |
| P/E | -160x | -5.3x | 66.4x | 12.8x | 16.9x |
| P/B | 5.5x | 6.6x | 11.1x | 5.9x | 6.3x |
| Current Ratio | 0.98 | 1.04 | 1.19 | 1.07 | 1.14 |
| Quick Ratio | 0.98 | 1.04 | 1.19 | 1.07 | 1.14 |
| D/E | 0.80 | 1.60 | 1.05 | 0.53 | 0.50 |
| Debt-to-Assets | 30.0% | 36.5% | 30.6% | 22.3% | 21.8% |
| Interest Coverage | -7.9x | -3.2x | 1.8x | 5.4x | 12.6x |
| Asset Turnover | 0.45 | 0.99 | 0.96 | 0.86 | 0.84 |
| Fixed Asset Turnover | 5.4x | 9.0x | 11.2x | 14.1x | 17.3x |
| Dividend Yield | 0% | 0% | 0% | 0% | 0% |
Evolution of Financial Ratios
Uber’s Return on Equity (ROE) has significantly improved from negative in 2022 to a strong 37.18% in 2025, reflecting enhanced profitability. The Current Ratio showed modest growth, moving from 1.04 in 2022 to 1.14 in 2025, indicating stable liquidity. Meanwhile, the Debt-to-Equity Ratio steadily declined from 1.60 in 2022 to 0.50 in 2025, signaling improved financial leverage and risk management.
Are the Financial Ratios Favorable?
In 2025, Uber’s profitability ratios, including a net margin of 19.33% and ROE of 37.18%, are favorable, demonstrating efficient capital use and earnings strength. Liquidity ratios are generally stable; quick ratio is favorable at 1.14, while the current ratio is neutral. Leverage metrics, such as debt-to-equity at 0.50 and debt-to-assets at 21.8%, are favorable, supporting financial safety. However, valuation ratios like price-to-book at 6.27 and dividend yield at 0% remain unfavorable. Overall, 57% of key ratios are positive, endorsing a generally favorable financial profile.
Shareholder Return Policy
Uber Technologies, Inc. does not pay dividends, reflecting a strategic focus on reinvestment and growth rather than immediate shareholder payouts. The absence of dividends aligns with its high free cash flow coverage and ongoing capital expenditures, supporting operational expansion and innovation.
The company engages in share buybacks, balancing shareholder returns while preserving capital for growth initiatives. This approach appears consistent with sustainable long-term value creation, as Uber prioritizes reinvestment over distributions amid positive profitability and cash flow trends.
Score analysis
The following radar chart illustrates Uber Technologies, Inc.’s key financial metric scores:
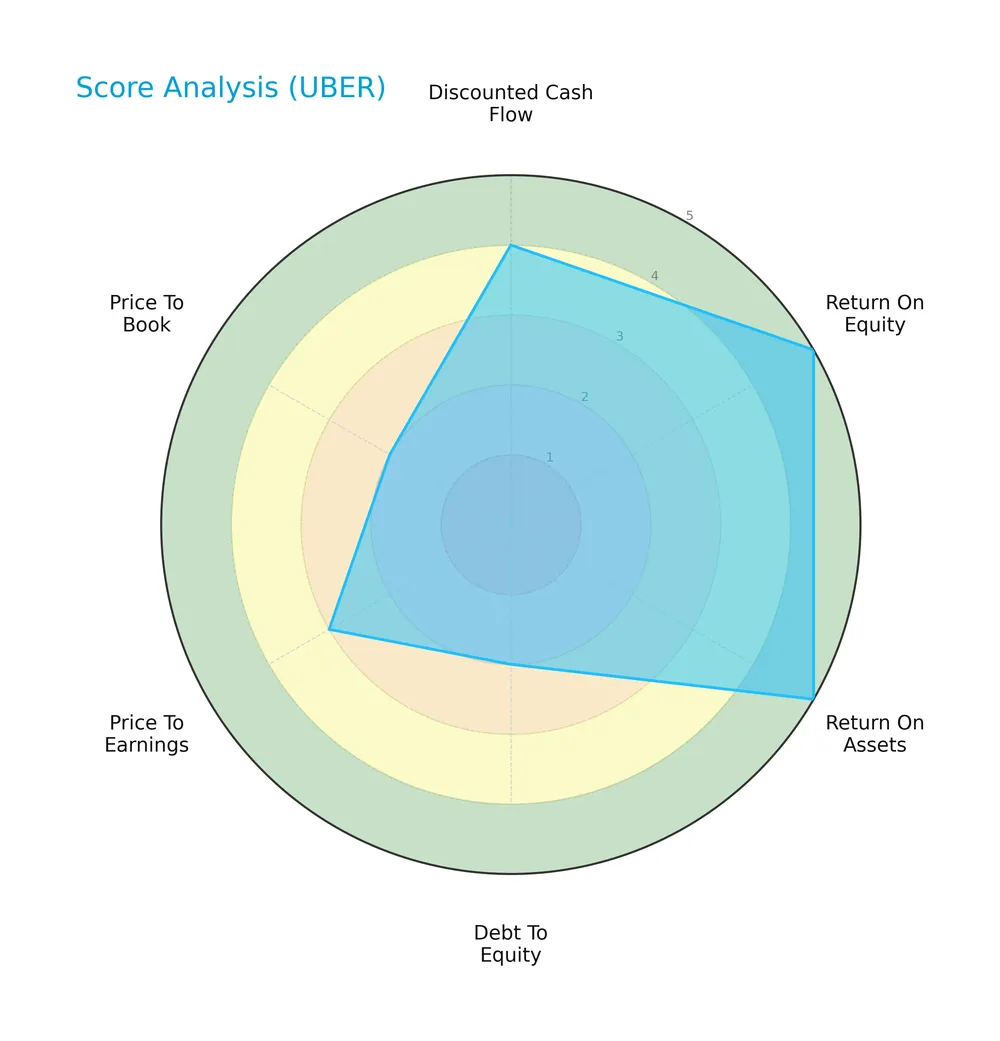
Uber shows very favorable returns on equity and assets, scoring 5 in both categories. Its discounted cash flow score is favorable at 4. However, debt-to-equity and price-to-book ratios are unfavorable with scores of 2, and price-to-earnings is moderate at 3.
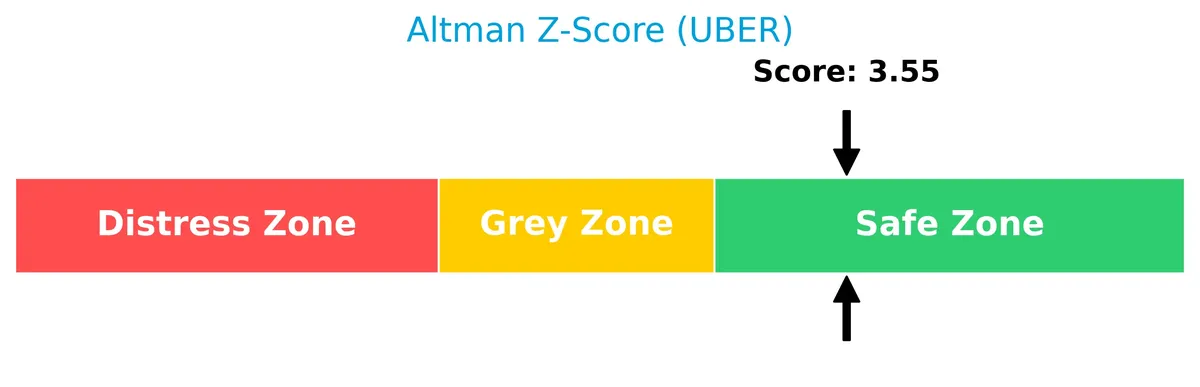
Analysis of the company’s bankruptcy risk
Uber’s Altman Z-Score places it firmly in the safe zone, indicating low bankruptcy risk and solid financial stability:
Is the company in good financial health?
This diagram presents Uber’s Piotroski Score, a measure of financial strength and value potential:

With a strong Piotroski Score of 7, Uber demonstrates solid financial health, reflecting good profitability, leverage, liquidity, and operational efficiency.
Competitive Landscape & Sector Positioning
This sector analysis examines Uber Technologies, Inc.’s strategic positioning, revenue segments, key products, and main competitors. I will assess whether Uber holds a competitive advantage over its peers in the technology-driven mobility and delivery space.
Strategic Positioning
Uber Technologies, Inc. has diversified its revenue streams across three segments: Mobility (30B), Delivery (17B), and Freight (5B) in 2025. Geographically, it spans major regions, with the US and Canada leading at 50B, followed by EMEA at 27B, Asia Pacific at 6B, and Latin America at 3B.
Revenue by Segment
This pie chart illustrates Uber Technologies’ revenue distribution across Delivery, Freight, and Mobility segments for the full year 2025.
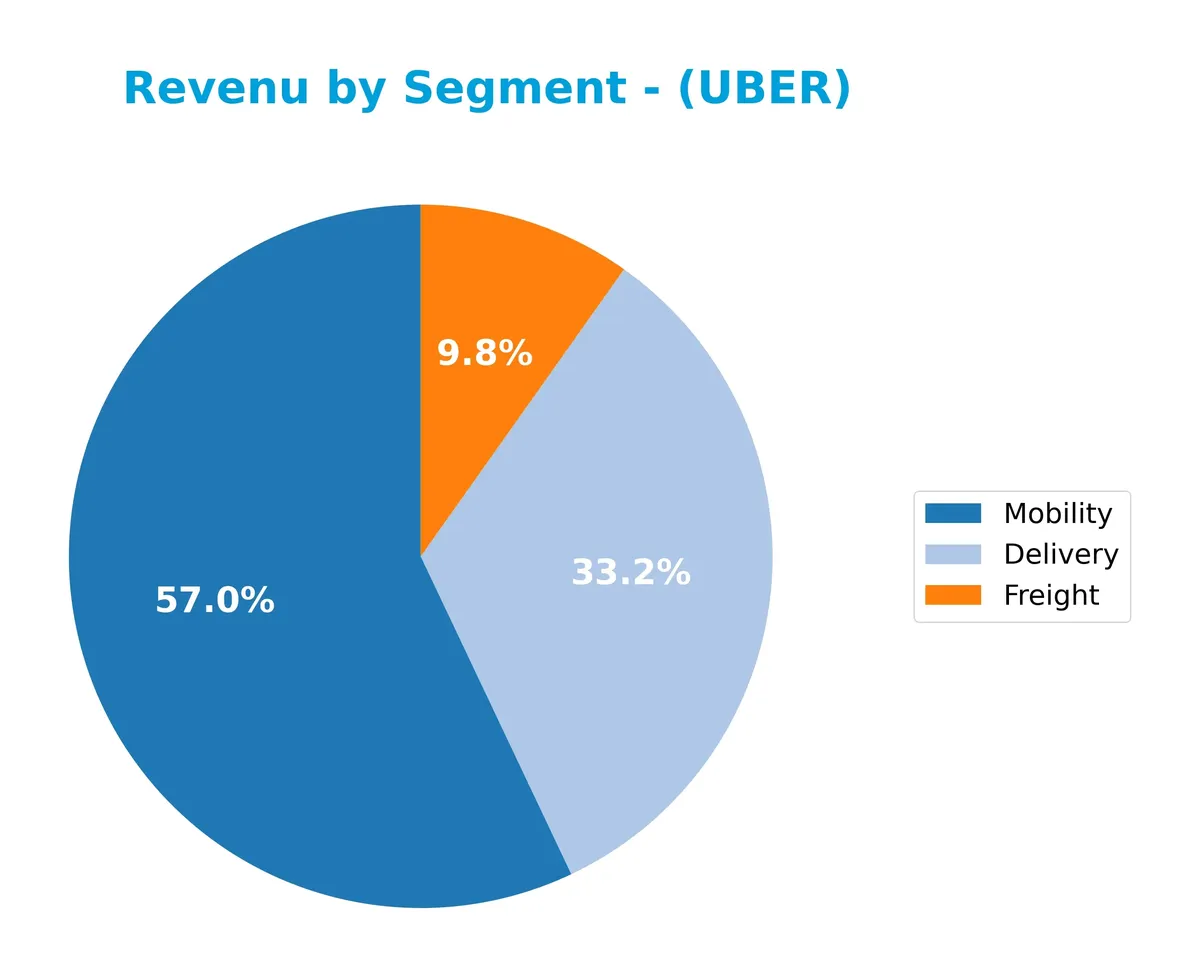
Uber’s Mobility segment leads with $29.7B, reflecting strong demand for ride-sharing services. Delivery follows at $17.2B, showing robust growth from $13.8B in 2024, signaling accelerated expansion in food and goods delivery. Freight, at $5.1B, remains stable but contributes less to overall revenue. The 2025 figures highlight increasing concentration in Mobility, while Delivery gains momentum, balancing Uber’s business mix effectively.
Key Products & Brands
Uber Technologies’ main products and brands span mobility, delivery, and freight services:
| Product | Description |
|---|---|
| Mobility | Connects consumers with drivers offering rides in cars, rickshaws, motorbikes, minibuses, or taxis worldwide. |
| Delivery | Enables ordering and delivery of meals, groceries, alcohol, and convenience store items from local merchants. |
| Freight | Connects carriers with shippers, providing transparent pricing, shipment booking, and logistics management services. |
Uber’s core segments reflect its broad platform strategy, addressing urban mobility, on-demand delivery, and freight logistics. Mobility leads revenue, underscoring Uber’s foundational ride service dominance. Delivery and Freight complement growth with expanding e-commerce and logistics trends.
Main Competitors
There are 33 competitors in total, with the table below showing the top 10 leaders by market capitalization:
| Competitor | Market Cap. |
|---|---|
| Salesforce, Inc. | 242B |
| Shopify Inc. | 210B |
| AppLovin Corporation | 209B |
| Intuit Inc. | 175B |
| Uber Technologies, Inc. | 172B |
| ServiceNow, Inc. | 153B |
| Cadence Design Systems, Inc. | 84.5B |
| Snowflake Inc. | 73.4B |
| Autodesk, Inc. | 61.2B |
| Workday, Inc. | 54.9B |
Uber Technologies, Inc. ranks 5th among 33 competitors. Its market cap is roughly 60% of the leader, Salesforce. Uber stands above both the average market cap of the top 10 (143.6B) and the sector median (18.8B). It holds a clear 20.5% market cap lead over its nearest competitor above, Intuit, signaling a strong position in the Technology sector.
Comparisons with competitors
Check out how we compare the company to its competitors:
Does Uber have a competitive advantage?
Uber demonstrates a clear competitive advantage, evidenced by a ROIC exceeding its WACC by 2.4%, signaling efficient capital use and consistent value creation. Its rapidly growing ROIC over 2021-2025 confirms a sustainable economic moat and rising profitability.
Looking ahead, Uber’s expansion across diverse markets including Asia Pacific and EMEA offers significant growth opportunities. Continued innovation in Mobility, Delivery, and Freight segments positions the company to capitalize on evolving consumer demands and global logistics trends.
SWOT Analysis
This SWOT analysis distills Uber Technologies, Inc.’s key strategic factors to guide investment decisions.
Strengths
- strong global market presence
- diversified revenue streams across Mobility, Delivery, Freight
- very favorable ROIC vs. WACC indicating sustainable competitive advantage
Weaknesses
- high price-to-book ratio signals potential overvaluation
- moderate current ratio suggests liquidity caution
- no dividend yield could deter income investors
Opportunities
- expanding international footprints, especially in EMEA and Asia Pacific
- growth in delivery and freight logistics markets
- potential for technological innovation and partnerships
Threats
- intense competition from rivals and new entrants
- regulatory risks in multiple jurisdictions
- economic downturns impacting consumer spending
Uber’s strengths in scale and profitability position it well to seize growth opportunities globally. However, valuation concerns and regulatory threats require vigilant risk management in its strategic execution.
Stock Price Action Analysis
The weekly stock chart for Uber Technologies, Inc. reveals price movements and volatility over the past 12 months:
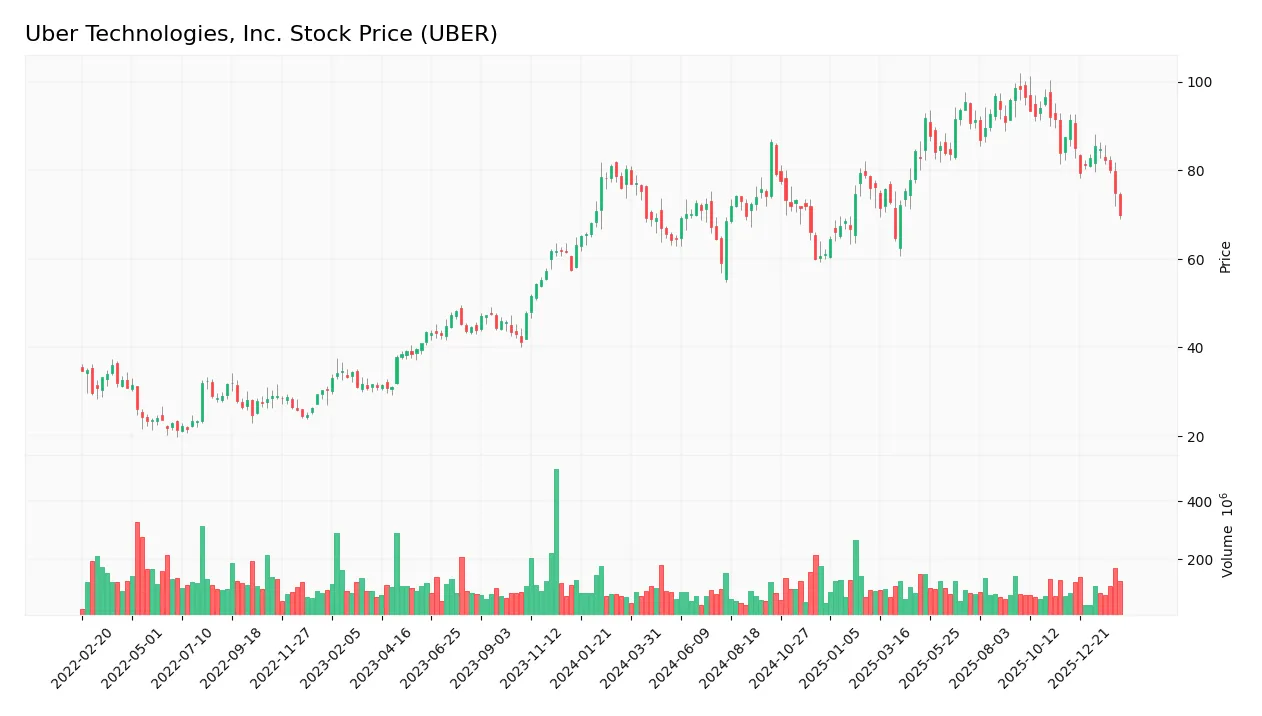
Trend Analysis
Over the past 12 months, Uber’s stock price declined by 12.76%, indicating a bearish trend. The price fell from a high of 98.51 to a low of 58.99 with decelerating downward momentum. Volatility remains elevated, with a standard deviation of 10.33, reflecting persistent price swings.
Volume Analysis
Over the last three months, trading volume shows a decreasing trend. Seller volume dominates at 70%, suggesting selling pressure outweighs buying interest. This seller-driven activity reflects cautious or negative investor sentiment amid the downtrend.
Target Prices
Analysts project a target price consensus reflecting both optimism and caution.
| Target Low | Target High | Consensus |
|---|---|---|
| 72 | 140 | 105.76 |
This range highlights a broad spectrum of expectations, with the consensus suggesting moderate upside potential for Uber Technologies, Inc.

Don’t Let Luck Decide Your Entry Point
Optimize your entry points with our advanced ProRealTime indicators. You’ll get efficient buy signals with precise price targets for maximum performance. Start outperforming now!
Analyst & Consumer Opinions
This section reviews Uber Technologies, Inc.’s recent analyst ratings and summarizes consumer feedback trends for 2026.
Stock Grades
The latest evaluations from leading analysts show a consistent outlook on Uber Technologies, Inc., summarized below:
| Grading Company | Action | New Grade | Date |
|---|---|---|---|
| Citigroup | Maintain | Buy | 2026-02-06 |
| Morgan Stanley | Maintain | Overweight | 2026-02-05 |
| Wedbush | Maintain | Neutral | 2026-02-05 |
| Benchmark | Maintain | Hold | 2026-02-05 |
| JP Morgan | Maintain | Overweight | 2026-02-05 |
| Citizens | Upgrade | Market Outperform | 2026-02-05 |
| RBC Capital | Maintain | Outperform | 2026-02-05 |
| Wells Fargo | Maintain | Overweight | 2026-02-05 |
| Mizuho | Maintain | Outperform | 2026-02-05 |
| Needham | Maintain | Buy | 2026-02-05 |
Most analysts maintain positive ratings, with a clear bias towards Buy and Overweight grades. Citizens stands out by upgrading Uber to Market Outperform, indicating growing confidence in the stock’s prospects.
Consumer Opinions
Consumers express mixed sentiments about Uber Technologies, Inc., reflecting its broad reach and operational challenges.
| Positive Reviews | Negative Reviews |
|---|---|
| Reliable ride availability in urban areas. | Surge pricing frustrates many users. |
| User-friendly app with quick booking features. | Occasional driver cancellations disrupt plans. |
| Frequent promotions and discounts attract users. | Customer service response times can lag. |
Overall, users praise Uber’s convenience and app design but consistently criticize pricing volatility and service reliability. These patterns suggest room for operational improvements.
Risk Analysis
Below is a summary of Uber Technologies, Inc.’s key risks, categorized by likelihood and potential impact:
| Category | Description | Probability | Impact |
|---|---|---|---|
| Market Volatility | Uber’s beta of 1.21 signals higher sensitivity to market swings | Medium | Medium |
| Regulatory Risk | Ride-sharing and delivery services face evolving global laws | High | High |
| Competitive Risk | Intense competition in mobility and delivery sectors | High | High |
| Leverage Risk | Debt-to-equity ratio at 0.5 is moderate but requires monitoring | Medium | Medium |
| Liquidity Risk | Current ratio of 1.14 is barely above neutral threshold | Medium | Medium |
| Valuation Risk | Price-to-book at 6.27 is unfavorable, suggesting overvaluation | Medium | Medium |
| Dividend Risk | No dividend yield may deter income-focused investors | Low | Low |
Regulatory and competitive risks dominate Uber’s risk profile. I note that Uber’s large footprint across multiple regions exposes it to complex regulations. Also, competitive pressure limits pricing power despite favorable profitability metrics. The firm’s current liquidity and leverage are manageable but warrant attention given sector cyclicality.
Should You Buy Uber Technologies, Inc.?
Uber appears to be improving profitability with strong value creation and a very favorable moat supported by a growing ROIC well above WACC. Despite a manageable but somewhat elevated leverage profile, the overall rating suggests a solid financial health profile.
Strength & Efficiency Pillars
Uber Technologies, Inc. delivers robust profitability with a net margin of 19.33% and a return on equity (ROE) of 37.18%. The return on invested capital (ROIC) stands at 11.21%, notably exceeding the weighted average cost of capital (WACC) at 8.78%, marking Uber as a clear value creator. This efficiency is supported by a strong interest coverage ratio of 14.18, reflecting prudent capital allocation and operational leverage. Historically in tech-driven platforms, such margins and returns indicate sustainable competitive advantages.
Weaknesses and Drawbacks
Uber’s valuation metrics raise caution: a price-to-book ratio of 6.27 signals an expensive equity relative to its book value, potentially limiting upside. While the debt-to-equity ratio of 0.5 is favorable, the current ratio at 1.14 is only neutral, hinting at modest short-term liquidity. Market pressure intensifies as recent trading shows seller dominance at 70.08%, causing a 20.05% price decline over a short span. This seller bias could reflect investors’ wariness amid broader tech sector volatility.
Our Final Verdict about Uber Technologies, Inc.
The company’s long-term fundamentals appear solid, supported by value creation and strong profitability. However, the bearish technical trend and recent seller dominance suggest caution. Despite Uber’s competitive moat and efficient capital use, current market dynamics might warrant a wait-and-see approach for more favorable entry points. This profile suggests potential but carries near-term risks that investors should weigh carefully.
Disclaimer: This content is for informational purposes only and does not constitute financial, investment, or other professional advice. Investing in financial markets involves a significant risk of loss, and past performance is not indicative of future results.
Additional Resources
- Uber Technologies (NYSE:UBER) Stock Price Down 2% – Time to Sell? – MarketBeat (Feb 13, 2026)
- Uber Technologies, Inc SEC 10-K Report – TradingView (Feb 13, 2026)
- Bill allowing Uber Technologies, Inc. (UBER) and Lyft in Israel Receives Committee Approval – Yahoo Finance (Feb 11, 2026)
- Uber (UBER) Files for Mixed Securities Shelf Offering – GuruFocus (Feb 13, 2026)
- Ariz. Uber Verdict Has Implications Beyond Ride-Hailing Cos. – Law360 (Feb 13, 2026)
For more information about Uber Technologies, Inc., please visit the official website: uber.com