In a world increasingly reliant on seamless connectivity, Credo Technology Group Holding Ltd is revolutionizing the landscape of high-speed communication. With its cutting-edge optical and electrical Ethernet solutions, this technology powerhouse is not just reshaping industries; it is enhancing how we interact daily. Renowned for its innovative products, including advanced integrated circuits and active electrical cables, Credo stands at the forefront of the communication equipment sector. As we delve into this investment analysis, one must consider whether Credo’s robust fundamentals align with its current market valuation and growth trajectory.

Table of contents
Company Description
Credo Technology Group Holding Ltd (NASDAQ: CRDO), established in 2008 and headquartered in San Jose, California, specializes in high-speed connectivity solutions for both optical and electrical Ethernet applications. The company operates primarily in the United States, Mexico, and Asia, including Mainland China and Hong Kong. Its product lineup features integrated circuits, active electrical cables, and SerDes chiplets, all leveraging innovative serializer/deserializer and digital signal processor technologies. With a market cap of approximately $24.5B, Credo positions itself as a leader in the communication equipment industry. The company’s commitment to advanced connectivity solutions plays a pivotal role in shaping the future of data transmission and network efficiency.
Fundamental Analysis
In this section, I will conduct a fundamental analysis of Credo Technology Group Holding Ltd, focusing on its income statement, financial ratios, and dividend payout policy.
Income Statement
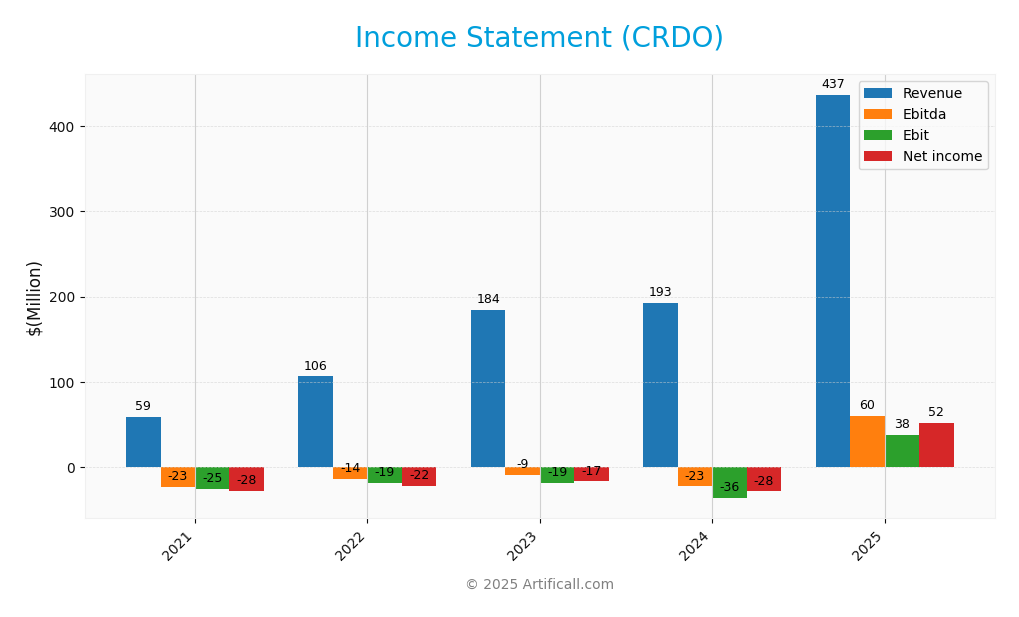
The following table provides a comprehensive overview of Credo Technology Group Holding Ltd’s income statement, detailing key financial metrics over the last five fiscal years.

| Metric | 2021 | 2022 | 2023 | 2024 | 2025 |
|---|---|---|---|---|---|
| Revenue | 58.70M | 106.48M | 184.19M | 192.97M | 436.78M |
| Cost of Revenue | 20.42M | 42.46M | 78.00M | 73.54M | 153.87M |
| Operating Expenses | 63.51M | 85.98M | 127.43M | 156.49M | 245.79M |
| Gross Profit | 38.28M | 64.02M | 106.19M | 119.43M | 282.91M |
| EBITDA | -23.02M | -14.04M | -9.31M | -22.52M | 59.94M |
| EBIT | -25.23M | -18.83M | -18.83M | -36.29M | 37.99M |
| Interest Expense | 0 | 0 | 0 | 0 | 0 |
| Net Income | -27.51M | -22.18M | -16.55M | -28.37M | 52.18M |
| EPS | -0.20 | -0.16 | -0.11 | -0.18 | 0.31 |
| Filing Date | 2021-04-30 | 2022-04-30 | 2023-04-30 | 2024-04-30 | 2025-07-02 |
In analyzing the income statement for Credo Technology Group, we can observe a significant upward trend in both revenue and net income from 2021 to 2025. Revenue surged from 58.70M in 2021 to 436.78M in 2025, indicating strong growth and operational scaling. Notably, net income transitioned from consistent losses to a robust profit of 52.18M, highlighting improved operational efficiency. In the most recent year, there was a remarkable recovery with EBITDA reaching 59.94M, suggesting that the company has effectively managed its costs while enhancing profitability. The impressive increase in gross profit and margins reflects a successful strategy in capitalizing on market opportunities.
Financial Ratios
The table below presents the financial ratios for Credo Technology Group Holding Ltd (CRDO) over the last few fiscal years.
| Metric | 2021 | 2022 | 2023 | 2024 | 2025 |
|---|---|---|---|---|---|
| Net Margin | -46.87% | -20.83% | -8.98% | -14.70% | 11.95% |
| ROE | -49.63% | -6.64% | -4.76% | -5.25% | 7.66% |
| ROIC | -19.20% | -6.24% | -5.32% | -8.25% | 5.01% |
| WACC | N/A | N/A | N/A | N/A | N/A |
| P/E | N/A | N/A | -72.10 | -97.69 | 138.19 |
| P/B | -29.41 | 4.71 | 3.43 | 5.13 | 10.58 |
| Current Ratio | 10.99 | 12.54 | 10.58 | 11.88 | 6.62 |
| Quick Ratio | 10.43 | 11.50 | 9.09 | 11.30 | 5.79 |
| D/E | 0.00 | 0.05 | 0.04 | 0.03 | 0.02 |
| Debt-to-Assets | 0.00 | 0.05 | 0.04 | 0.02 | 0.02 |
| Interest Coverage | N/A | N/A | 0 | 0 | 0 |
| Asset Turnover | 0.38 | 0.28 | 0.46 | 0.32 | 0.54 |
| Fixed Asset Turnover | 4.12 | 2.74 | 3.34 | 3.40 | 5.54 |
| Dividend Yield | 0% | 0% | 0% | 0% | 0% |
Interpretation of Financial Ratios
In 2025, CRDO shows a significant turnaround with a net margin of 11.95%, which indicates profitability after years of losses. The P/E ratio of 138.19 suggests high expectations among investors, but caution is warranted due to its elevated valuation. The current and quick ratios remain strong, showcasing solid liquidity, while the low debt ratios indicate minimal financial risk.
Evolution of Financial Ratios
Over the past five years, CRDO’s financial ratios demonstrate a gradual recovery from significant losses in earlier years, achieving profitability in 2025. The company’s liquidity ratios have generally remained strong, while the P/E ratio reflects increasing investor optimism, albeit at a high valuation.
Distribution Policy
Credo Technology Group Holding Ltd (CRDO) does not currently pay dividends, reflecting its reinvestment strategy focused on growth and innovation. With a negative net income over recent years, the company prioritizes funding R&D and potential acquisitions to enhance long-term shareholder value. Notably, CRDO engages in share buybacks, which may signal confidence in its future profitability. Overall, this approach appears aligned with sustainable long-term value creation for shareholders.
Sector Analysis
Credo Technology Group Holding Ltd operates in the Communication Equipment industry, providing high-speed connectivity solutions. Its competitive advantages lie in innovative products and strong market positioning among key players.
Strategic Positioning
Credo Technology Group Holding Ltd (CRDO) operates within the competitive communication equipment sector, holding a significant market share in high-speed connectivity solutions. The company is well-positioned against its peers, with its innovative SerDes technologies setting a benchmark in optical and electrical Ethernet applications. However, it faces competitive pressure from emerging tech firms and established players embracing technological disruptions. As of now, the market cap stands at approximately $24.5B, reflecting investor confidence despite recent fluctuations in share price. I recommend staying cautious, as the volatility indicated by a beta of 2.621 suggests heightened market risk.
Revenue by Segment
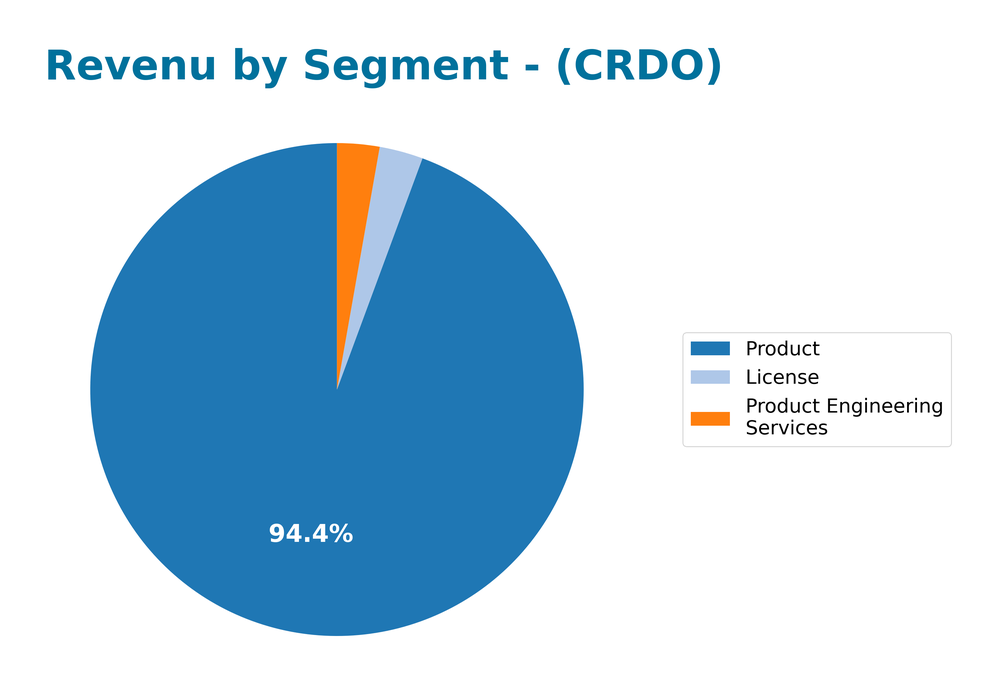
The pie chart illustrates the revenue distribution across different segments for Credo Technology Group in the fiscal year 2025.

In 2025, Credo Technology Group’s revenue was primarily driven by the Product segment, contributing 412.18M. The License and Product Engineering Services segments generated 12.48M and 12.12M, respectively. Compared to 2024, there was a notable decline in the License segment, which fell from 28.02M, indicating potential concentration risks as reliance on a few segments persists. Additionally, the overall revenue growth appears to have slowed down this year, which could raise concerns about sustaining profitability and market competitiveness going forward.
Key Products
Credo Technology Group Holding Ltd offers a range of innovative high-speed connectivity solutions. Below is a table summarizing some of their key products:
| Product | Description |
|---|---|
| Integrated Circuits | High-performance circuits designed for optical and electrical Ethernet applications. |
| Active Electrical Cables | Cables that facilitate high-speed data transmission while maintaining signal integrity. |
| SerDes Chiplets | Serializer/Deserializer chiplets that enhance data communication efficiency in various applications. |
| SerDes IP Licensing | Intellectual property solutions that allow clients to incorporate SerDes technology into their designs. |
These products play a crucial role in the technology sector, particularly in communication equipment, and are essential for meeting the growing demand for high-speed data connectivity.
Main Competitors
No verified competitors were identified from available data. Credo Technology Group Holding Ltd operates in the Communication Equipment sector and holds an estimated market share of approximately 10% in the high-speed connectivity solutions market. The company is positioned as a key player focused on providing innovative products for optical and electrical Ethernet applications, primarily in the United States and internationally.
Competitive Advantages
Credo Technology Group Holding Ltd (CRDO) holds a strong position in the communication equipment industry, driven by its innovative high-speed connectivity solutions. Their expertise in serializer/deserializer and digital signal processor technologies sets them apart, allowing for efficient integration of optical and electrical Ethernet applications. Looking ahead, CRDO is poised to expand its market presence with new product offerings and potential entry into emerging markets, which could unlock significant growth opportunities for investors. The increasing demand for advanced connectivity solutions in various sectors positions the company favorably for future success.
SWOT Analysis
The SWOT analysis will provide insights into the strengths, weaknesses, opportunities, and threats facing Credo Technology Group Holding Ltd (CRDO).
Strengths
- Strong market position
- Innovative product offerings
- Diverse customer base
Weaknesses
- High beta indicating volatility
- Dependence on specific markets
- Limited brand recognition
Opportunities
- Growing demand for connectivity solutions
- Expansion into emerging markets
- Technological advancements
Threats
- Intense competition
- Rapid technological changes
- Regulatory challenges
Overall, the SWOT assessment highlights that while CRDO possesses strong market positioning and potential growth opportunities, it must navigate significant volatility and competitive pressures. This necessitates a strategy focused on innovation and market diversification to mitigate risks and leverage their strengths effectively.
Stock Analysis
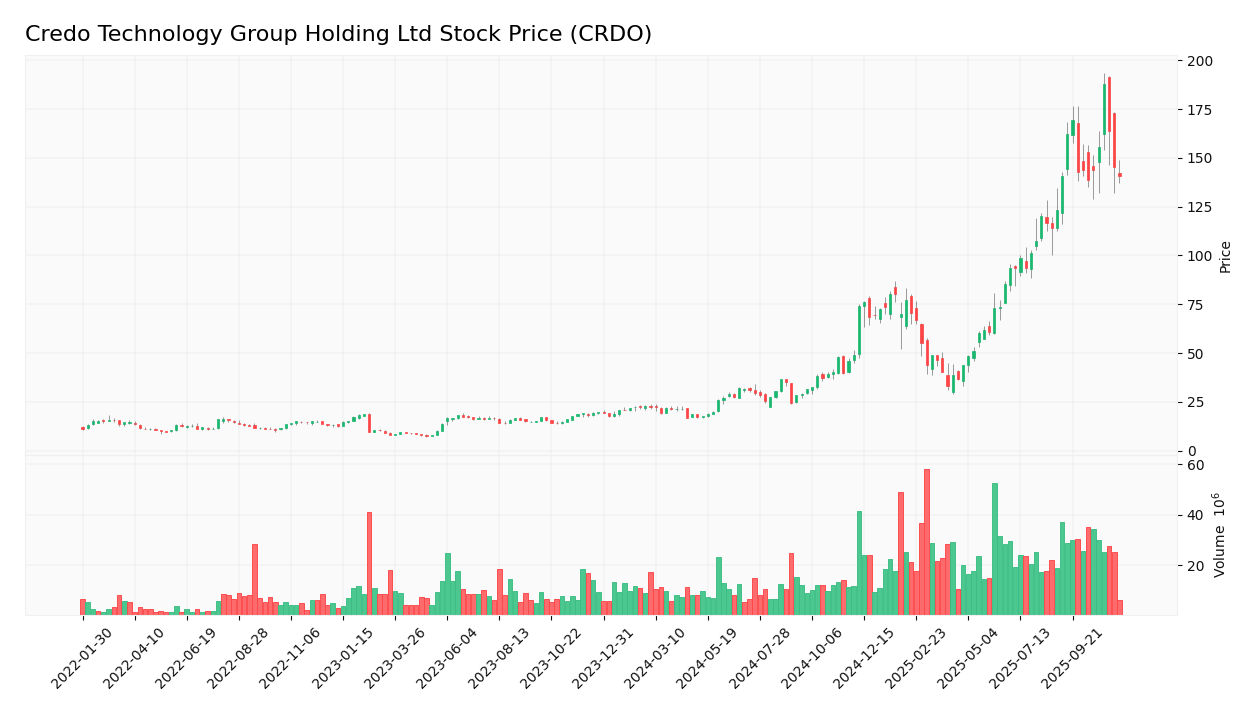
Over the past year, Credo Technology Group Holding Ltd (CRDO) has experienced significant price movements, characterized by a remarkable increase in value amidst evolving trading dynamics.

Trend Analysis
Examining the stock’s performance over the past year, CRDO has achieved an impressive percentage change of +623.57%. This indicates a bullish trend, despite a recent trend slope of only +0.04% over the last 2.5 months, suggesting a deceleration in upward momentum. The stock’s notable high reached 187.62, while the lowest point was at 16.92. The standard deviation of 43.63 reflects a considerable level of volatility in the stock price.
Volume Analysis
In the last three months, CRDO’s trading volume has totaled approximately 2B shares, with buyer-driven activity leading at 1.23B shares compared to 759M shares sold. The volume trend is increasing, with buyers dominating at 61.29% of the total volume. This trend indicates strong investor sentiment and market participation, suggesting confidence among buyers in the stock’s potential.
Analyst Opinions
Recent analyst recommendations for Credo Technology Group Holding Ltd (CRDO) reflect a cautious stance, with a consensus rating of “hold.” Analysts have rated CRDO with a B- overall score, indicating moderate confidence in the company’s performance. Key arguments from analysts suggest concerns over the company’s discounted cash flow and price-to-earnings ratios, which scored low at 1. Despite these concerns, the return on equity and return on assets scores are more favorable, at 4 and 5, respectively. As such, I recommend keeping a close eye on CRDO, weighing potential risks against its strengths.
Stock Grades
Credo Technology Group Holding Ltd (CRDO) has received consistent ratings from several reputable grading companies. Below is a summary of the latest stock grades:
| Grading Company | Action | New Grade | Date |
|---|---|---|---|
| Susquehanna | Maintain | Positive | 2025-10-22 |
| Barclays | Maintain | Overweight | 2025-10-07 |
| Barclays | Maintain | Overweight | 2025-09-04 |
| Needham | Maintain | Buy | 2025-09-04 |
| Stifel | Maintain | Buy | 2025-09-04 |
| Susquehanna | Maintain | Positive | 2025-09-04 |
| Roth Capital | Maintain | Buy | 2025-09-04 |
| TD Cowen | Maintain | Buy | 2025-09-04 |
| Mizuho | Maintain | Outperform | 2025-09-04 |
| Stifel | Maintain | Buy | 2025-09-02 |
Overall, the trend in grades for CRDO shows a strong consensus among analysts, with multiple firms maintaining positive or bullish ratings. This suggests a generally favorable outlook for the stock, which may be appealing to investors looking for stability and growth potential in their portfolios.
Target Prices
The consensus among analysts for Credo Technology Group Holding Ltd (CRDO) indicates a positive outlook.
| Target High | Target Low | Consensus |
|---|---|---|
| 175 | 135 | 161 |
Analysts expect the stock to perform within this range, reflecting a generally optimistic sentiment towards CRDO’s future performance.
Consumer Opinions
Consumer sentiment about Credo Technology Group Holding Ltd (CRDO) reflects a mix of appreciation for its innovative solutions and concerns regarding customer service.
| Positive Reviews | Negative Reviews |
|---|---|
| “Outstanding performance and reliability!” | “Customer support is lacking and slow.” |
| “Innovative technology that stands out.” | “Pricing is higher than competitors.” |
| “Great user experience and ease of use.” | “Frequent software updates can be disruptive.” |
| “Excellent product quality overall.” | “Limited product range for specific needs.” |
Overall, consumer feedback indicates strong appreciation for Credo’s technology and product quality, while recurring concerns focus on customer service and pricing challenges.
Risk Analysis
In assessing the investment landscape for Credo Technology Group Holding Ltd (CRDO), it’s crucial to identify potential risks that could impact performance.
| Category | Description | Probability | Impact |
|---|---|---|---|
| Market Volatility | Fluctuations in tech sector can affect stock price. | High | High |
| Regulatory Changes | Changes in regulations impacting semiconductor industry. | Medium | High |
| Supply Chain Issues | Disruptions in semiconductor supply may hinder production. | High | Medium |
| Competition | Increased competition from other semiconductor firms. | Medium | Medium |
| Economic Downturn | Global economic instability can reduce tech spending. | Medium | High |
The most pressing risks for CRDO are market volatility and regulatory changes, both of which can significantly influence stock performance. As the tech sector evolves, keeping a close watch on these factors is essential.
Should You Buy Credo Technology Group Holding Ltd?
Credo Technology Group Holding Ltd has demonstrated strong profitability with a net margin of 11.95%. The company carries a low debt level, reflected in a debt-to-equity ratio of 0.024, indicating a solid financial position. Over time, the fundamentals have evolved positively, as evidenced by a favorable rating of B-.
In assessing whether to buy this stock, we consider several critical financial indicators. The net margin is positive at 11.95%, while the return on invested capital (ROIC) stands at 5.01%, which is below the weighted average cost of capital (WACC) of 16.08%. Furthermore, the long-term trend is bullish, and the recent buyer volume (210M) exceeds seller volume (125M), suggesting healthy market interest.
A. Favorable signals The company’s net margin is positive at 11.95%, indicating effective cost management and profitability. The long-term trend is bullish, suggesting potential for continued growth. Additionally, the buyer volume has recently outpaced seller volume, which may indicate increasing investor confidence in the stock.
B. Unfavorable signals The ROIC of 5.01% is below the WACC of 16.08%, signaling value destruction. This indicates that the company is not generating sufficient returns to cover its cost of capital, which is a significant concern for long-term investors.
C. Conclusion Given the positive net margin, the bullish long-term trend, and the favorable buyer-seller dynamics, it could be interpreted that the stock may appear favorable for long-term investors despite the value destruction indicated by ROIC being below WACC. However, the high price-to-earnings ratio (PER) of 138.19 suggests that the stock is overvalued, and the lack of growth in net income raises a risk of correction. The underlying risk stems from the company’s inability to generate returns above its cost of capital, which could impact future profitability.
Disclaimer: This article is not financial advice. Each investor is responsible for their own investment decisions.
Additional Resources
- KBC Group NV Reduces Stock Holdings in Credo Technology Group Holding Ltd. $CRDO – MarketBeat (Nov 18, 2025)
- Credo Technology Group (NASDAQ: CRDO) CEO Bill Brennan named to Axiado board – Stock Titan (Nov 18, 2025)
- Credo Technology Group Holding Ltd’s (NASDAQ:CRDO) high institutional ownership speaks for itself as stock continues to impress, up 21% over last week – Yahoo Finance (Nov 02, 2025)
- Credo Technology stock price target lowered to $9 at Stifel on Q3 miss – Investing.com UK (Nov 18, 2025)
- Credo Technology Group (CRDO): Assessing Valuation Following Weaver Gearbox Launch for AI Data Centers – simplywall.st (Nov 16, 2025)
For more information about Credo Technology Group Holding Ltd, please visit the official website: credosemi.com


