CEVA, Inc. is redefining the semiconductor landscape, powering the devices that connect us and enhance our daily experiences. As a leading licensor of wireless connectivity and smart sensing technologies, CEVA’s innovative solutions cater to a wide range of markets, including mobile, IoT, and automotive. With a reputation for quality and cutting-edge design, the company plays a crucial role in the advancement of artificial intelligence and sensor integration. As I dive into the investment analysis, I will explore whether CEVA’s fundamentals continue to support its current market valuation and growth trajectory.

Table of contents
Company Description
CEVA, Inc. is a leading licensor of wireless connectivity and smart sensing technologies, serving semiconductor and original equipment manufacturer (OEM) companies globally. Founded in 1999 and headquartered in Rockville, Maryland, CEVA specializes in designing and licensing digital signal processors, AI processors, and wireless platforms that enable applications in mobile, IoT, and automotive sectors. With a market cap of approximately $495M, its products cater to various industries including consumer electronics, robotics, and aerospace. As a key player within the semiconductor industry, CEVA’s innovative solutions significantly contribute to the advancement of connectivity and intelligent sensing, shaping the future of smart devices and IoT ecosystems.
Fundamental Analysis
In this section, I will analyze CEVA, Inc.’s income statement, financial ratios, and dividend payout policy to evaluate its investment potential.
Income Statement
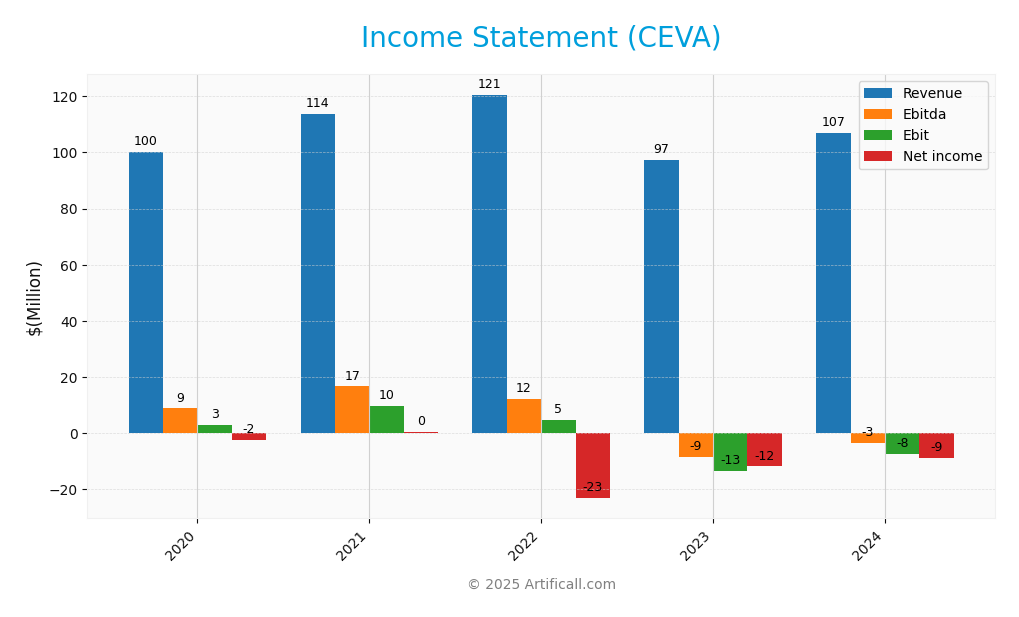
Below is the income statement for CEVA, Inc., highlighting key financial metrics over the past five fiscal years.

| Metric | 2020 | 2021 | 2022 | 2023 | 2024 |
|---|---|---|---|---|---|
| Revenue | 100.3M | 113.8M | 120.6M | 97.4M | 106.9M |
| Cost of Revenue | 10.7M | 10.4M | 15.1M | 11.6M | 12.8M |
| Operating Expenses | 90.3M | 96.4M | 101.6M | 99.2M | 101.7M |
| Gross Profit | 89.6M | 103.5M | 105.5M | 85.8M | 94.2M |
| EBITDA | 8.8M | 16.6M | 12.2M | -8.6M | -3.4M |
| EBIT | 2.97M | 9.64M | 4.59M | -13.5M | -7.5M |
| Interest Expense | 0.44M | 0.42M | 0.4M | 0M | 0M |
| Net Income | -2.38M | 0.40M | -23.2M | -11.9M | -8.8M |
| EPS | -0.11 | 0.017 | -1.00 | -0.51 | -0.37 |
| Filing Date | 2021-03-01 | 2022-03-01 | 2023-03-01 | 2024-03-07 | 2025-02-27 |
Over the period from 2020 to 2024, CEVA, Inc. experienced fluctuations in revenue, peaking at 120.6M in 2022 before dropping to 97.4M in 2023, followed by a modest recovery to 106.9M in 2024. Notably, while gross profit margins showed resilience, net income remained negative, reflecting ongoing challenges. In 2024, the company’s EBITDA improved slightly compared to the prior year, though it remained negative, indicating persistent operational challenges. This trend highlights the importance of monitoring CEVA’s strategic initiatives as it seeks to turn around its profitability.
Financial Ratios
Here are the financial ratios for CEVA, Inc. over the last available years:
| Ratio | 2020 | 2021 | 2022 | 2023 | 2024 |
|---|---|---|---|---|---|
| Net Margin | -2.37% | 0.32% | -17.22% | -12.19% | -8.22% |
| ROE | -0.91% | 0.14% | -8.96% | -4.49% | -3.30% |
| ROIC | 0.25% | 0.04% | 6.88% | -10.82% | -8.56% |
| WACC | 10.00% | 10.00% | 10.00% | 10.00% | 10.00% |
| P/E | -422.81 | 2491.65 | -25.57 | -44.90 | -84.79 |
| P/B | 3.86 | 3.57 | 2.29 | 2.02 | 2.79 |
| Current Ratio | 5.95 | 5.33 | 5.34 | 7.79 | 7.09 |
| Quick Ratio | 5.95 | 5.33 | 5.34 | 7.79 | 7.09 |
| D/E | 0.03 | 0.03 | 0.03 | 0.02 | 0.02 |
| Debt-to-Assets | 2.85% | 3.36% | 3.14% | 2.12% | 1.79% |
| Interest Coverage | -1.72 | 3.63 | -1.11 | 0 | 0 |
| Asset Turnover | 0.33 | 0.37 | 0.44 | 0.32 | 0.34 |
| Fixed Asset Turnover | 6.03 | 7.87 | 7.75 | 7.10 | 8.43 |
| Dividend Yield | 0% | 0% | 0% | 0% | 0% |
Interpretation of Financial Ratios
In 2024, CEVA’s financial ratios reveal significant concerns. The negative net margin (-8.22%) and ROE (-3.30%) indicate ongoing profitability challenges. The high P/E ratio of -84.79 reflects investor skepticism about future earnings. Although liquidity ratios (current and quick ratios) appear strong, the lack of profitability and negative returns on equity suggest a cautious approach for potential investors.
Evolution of Financial Ratios
Over the past five years, CEVA’s financial ratios have shown a deteriorating trend, particularly in profitability metrics like net margin and ROE. The company has struggled to return to profitability, highlighting ongoing operational challenges despite maintaining reasonable liquidity ratios.
Distribution Policy
CEVA, Inc. does not pay dividends, which is consistent with its negative net income and focus on reinvestment strategies. The company is likely prioritizing research and development alongside potential acquisitions to drive growth. Additionally, CEVA engages in share buybacks, indicating a commitment to returning value to shareholders. This lack of dividends, combined with its investment in growth, may support sustainable long-term value creation if managed effectively. However, investors should remain cautious given the current financial challenges.
Sector Analysis
CEVA, Inc. operates in the semiconductor industry, specializing in wireless connectivity and smart sensing technologies. Its competitive advantages include a robust IP portfolio and strategic partnerships with key OEMs.
Strategic Positioning
CEVA, Inc. operates in the highly competitive semiconductor industry, focusing on wireless connectivity and smart sensing technologies. With a market cap of approximately $495M, CEVA holds a significant position but faces competitive pressure from established players in the AI and IoT sectors. The company’s key products are essential for 5G and IoT applications, positioning it well amidst rapid technological disruptions. However, its current market share is challenged by the ongoing advancements and innovations from competitors, necessitating continuous adaptation and strategic licensing efforts to maintain relevance.
Revenue by Segment
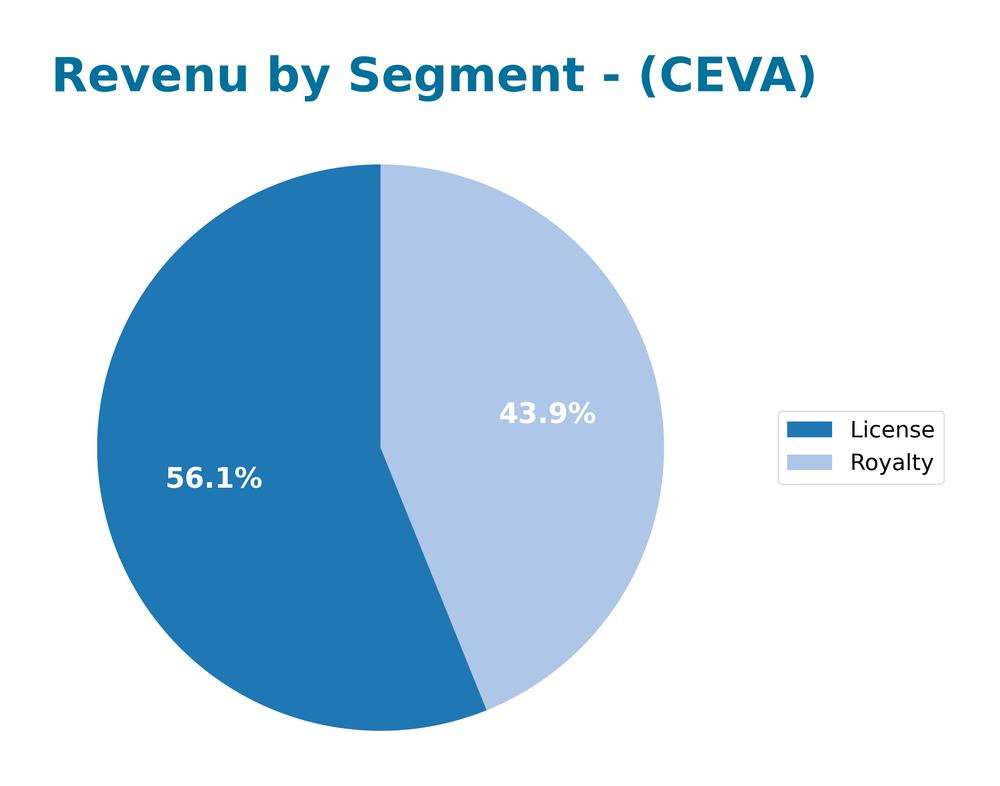
The chart below illustrates CEVA, Inc.’s revenue segmentation for fiscal years 2023 and 2024, showcasing the performance of various product categories.

In FY 2024, CEVA’s revenue from the License segment reached 60M, while the Royalty segment contributed 47M, indicating a robust growth trajectory compared to FY 2023, where License revenue was 58M and Royalty revenue was 40M. The trends show a notable shift towards licensing as the company continues to expand its market reach. However, the current year’s growth has displayed signs of slowing, suggesting potential margin risks as the company navigates competitive pressures in the technology landscape.
Key Products
Below is a table highlighting some of the key products offered by CEVA, Inc., showcasing their innovative technologies in the semiconductor industry.
| Product | Description |
|---|---|
| CEVA-BX DSP Family | A family of digital signal processors designed for advanced audio, voice, and speech applications. |
| CEVA-TeakLite DSP | A highly efficient DSP core optimized for low-power applications in IoT devices and wearables. |
| CEVA-XM4 | An AI processor specifically designed for computer vision applications, ideal for camera-enabled devices. |
| CEVA-Sensory Fusion Software | Software enabling advanced sensor fusion for wearables, AR/VR, and robotics, enhancing user experience. |
| CEVA-Wi-Fi Solutions | Integrated platforms supporting Wi-Fi 4/5/6/6E technologies for high-speed wireless connectivity. |
| CEVA-Bluetooth Solutions | Comprehensive solutions for Bluetooth connectivity, catering to various consumer and industrial applications. |
| CEVA-UWB Technology | Ultra-wideband technology that provides precise location tracking and high-speed data transfer capabilities. |
I believe understanding these products can help investors gauge CEVA’s position in the semiconductor market and its potential for growth.
Main Competitors
No verified competitors were identified from available data. CEVA, Inc. operates within the semiconductor industry, primarily focusing on wireless connectivity and smart sensing technologies. The company holds a competitive position as a licensor to major semiconductor and original equipment manufacturer (OEM) companies globally, but specific market share figures and competitor comparisons are not available.
Competitive Advantages
CEVA, Inc. has established a strong position in the semiconductor industry by licensing innovative wireless connectivity and smart sensing technologies. Their diverse product offerings, including DSP cores and AI processors, cater to a wide range of markets, from mobile to automotive and IoT. Looking ahead, CEVA is well-positioned to capitalize on the growing demand for 5G technology and advanced AI applications. New product developments and expansion into emerging markets present significant opportunities for growth, enhancing their competitive edge in a rapidly evolving landscape. With a solid foundation and a focus on innovation, CEVA is poised for continued success.
SWOT Analysis
This SWOT analysis provides a comprehensive overview of CEVA, Inc.’s strategic position, identifying strengths, weaknesses, opportunities, and threats.
Strengths
- Strong portfolio of wireless connectivity technologies
- Established relationships with OEMs
- Expertise in AI and smart sensing solutions
Weaknesses
- High dependency on semiconductor industry
- Limited brand recognition compared to larger competitors
- No dividend payouts
Opportunities
- Growth in IoT and AI markets
- Expansion into emerging markets
- Increasing demand for 5G technologies
Threats
- Intense competition in the semiconductor space
- Rapid technological changes
- Economic downturns affecting customer budgets
Overall, CEVA, Inc. possesses a robust set of strengths and opportunities that can drive future growth, but it must navigate notable weaknesses and threats. A strategic focus on innovation and market expansion will be crucial for sustaining its competitive edge.
Stock Analysis
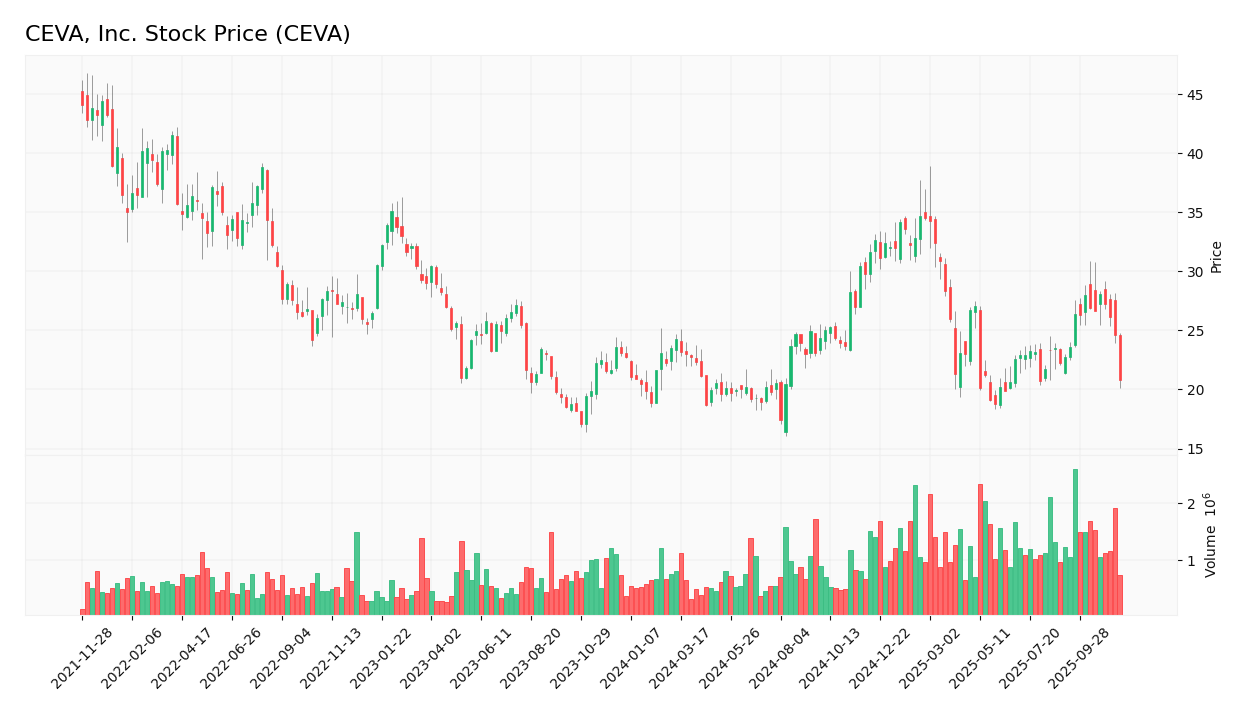
In analyzing CEVA, Inc.’s stock price movements over the past year, we observe significant fluctuations that highlight the trading dynamics within this period.

Trend Analysis
Over the past two years, CEVA’s stock has experienced a percentage change of -8.4%, indicating a bearish trend. The trend shows signs of deceleration, with notable price highs at 34.67 and lows at 17.39. The standard deviation of 4.44 suggests a moderate level of volatility in the stock’s performance.
Volume Analysis
In the last three months, the total trading volume for CEVA reached approximately 121.3M shares, with seller-driven activity slightly dominating at 62.5M shares, compared to 57.9M shares bought. Despite this, the overall volume trend is increasing, which may indicate a growing interest among investors, albeit with a slightly seller-dominant sentiment as reflected in the recent period where buyer dominance was at 43.47%.
Analyst Opinions
Recent analyst recommendations for CEVA, Inc. indicate a cautious stance, with a consensus rating of “hold.” Analysts have highlighted the company’s solid discounted cash flow score of 3, suggesting potential future growth, yet concerns remain about its low return on equity and return on assets, both scoring 1. Notably, the overall rating stands at C+, reflecting mixed sentiments. Analysts advise monitoring CEVA’s performance closely, given its debt-to-equity score of 3, which indicates a manageable leverage position, yet the low price-to-earnings and price-to-book scores warrant caution.
Stock Grades
CEVA, Inc. has received consistent ratings from reputable grading companies, indicating a stable outlook for the stock. Below is a summary of the most recent grades:
| Grading Company | Action | New Grade | Date |
|---|---|---|---|
| Barclays | Maintain | Overweight | 2025-11-12 |
| Rosenblatt | Maintain | Buy | 2025-11-11 |
| Rosenblatt | Maintain | Buy | 2025-08-14 |
| Oppenheimer | Maintain | Outperform | 2025-05-09 |
| Barclays | Maintain | Overweight | 2025-05-08 |
| Rosenblatt | Maintain | Buy | 2025-05-08 |
| Rosenblatt | Maintain | Buy | 2025-04-23 |
| Barclays | Maintain | Overweight | 2025-02-14 |
| Rosenblatt | Maintain | Buy | 2025-02-14 |
| Rosenblatt | Maintain | Buy | 2025-02-11 |
Overall, the trend shows a strong commitment from analysts, with most grades maintaining a positive stance such as “Buy” or “Overweight.” This consistency reflects confidence in CEVA’s performance and its position in the market.
Target Prices
No verified target price data is available from recognized analysts for CEVA, Inc. The current market sentiment appears mixed, reflecting uncertainty among investors.
Consumer Opinions
Consumer sentiment towards CEVA, Inc. is a mix of appreciation for their innovative technologies and concerns about customer service.
| Positive Reviews | Negative Reviews |
|---|---|
| “CEVA’s technology is cutting-edge and reliable.” | “Customer support is slow and unresponsive.” |
| “I love the user-friendly interface of their products.” | “Updates often introduce new bugs.” |
| “Great value for the performance offered.” | “Pricing can be higher than competitors.” |
Overall, consumer feedback highlights CEVA’s advanced technology and performance as key strengths, while customer service and pricing concerns are notable weaknesses.
Risk Analysis
In evaluating the potential risks associated with investing in CEVA, Inc. (ticker: CEVA), I’ve compiled a table outlining the key risks that investors should consider.
| Category | Description | Probability | Impact |
|---|---|---|---|
| Market Risk | Fluctuations in demand for semiconductor products. | High | High |
| Competitive Risk | Increasing competition in the semiconductor space. | Medium | High |
| Regulatory Risk | Changes in trade policies affecting supply chains. | Medium | Medium |
| Operational Risk | Potential disruptions in manufacturing processes. | Low | High |
| Technological Risk | Rapid technological advancements rendering products obsolete. | Medium | High |
In summary, the most significant risks for CEVA revolve around market demand and competition, particularly in a rapidly evolving sector. Investors should remain vigilant of these factors as they can heavily influence the company’s performance.
Should You Buy CEVA, Inc.?
CEVA, Inc. is currently experiencing a negative net margin of -0.0822, indicating unprofitability. The company has a low debt-to-equity ratio of 0.0209, which suggests a manageable level of debt. Over the past fiscal years, CEVA’s fundamentals have shown a declining trend in profitability, and it has received a rating of C+.
A. Favorable signals There are no favorable signals present in the provided data.
B. Unfavorable signals CEVA has a negative net margin of -0.0822, indicating unprofitability. The return on invested capital (ROIC) is -0.0856, which is below the weighted average cost of capital (WACC) of 10.45, leading to value destruction. Additionally, the long-term trend is negative, as indicated by a price change percentage of -8.4%. Furthermore, recent seller volume exceeds recent buyer volume, with sellers at 9.67M compared to buyers at 7.43M, suggesting a lack of buying interest.
C. Given the negative net margin, the unfavorable signals present, and the overall bearish trend, it may be prudent to wait for a potential shift in buyer interest and a reversal in the company’s performance before considering any investment.
The significant risks include the negative profitability, the high WACC compared to ROIC, and the current bearish market sentiment.
Disclaimer: This article is not financial advice. Each investor is responsible for their own investment decisions.
Additional Resources
- Will CEVA Inc. (PVJA) stock gain from lower interest rates – July 2025 Sentiment & Verified Momentum Watchlists – newser.com (Nov 18, 2025)
- CEVA, Inc. (NASDAQ:CEVA) Analysts Are Pretty Bullish On The Stock After Recent Results – Yahoo Finance (Nov 13, 2025)
- Ceva Receives 2025 IoT Edge Computing Excellence Award from IoT Evolution World – PR Newswire (Nov 17, 2025)
- Ceva (NASDAQ: CEVA) to sell 3M shares to add capital and increase public float – Stock Titan (Nov 17, 2025)
- Ceva, Inc. $CEVA Shares Sold by Connor Clark & Lunn Investment Management Ltd. – MarketBeat (Nov 16, 2025)
For more information about CEVA, Inc., please visit the official website: ceva-dsp.com


