Home > Comparison > Technology > NVDA vs INTC
The strategic rivalry between NVIDIA Corporation and Intel Corporation defines the current trajectory of the semiconductor industry. NVIDIA operates as a high-margin innovator focused on graphics, AI, and data center acceleration. Intel represents a capital-intensive giant with broad compute and platform solutions. This analysis will clarify which corporate path offers superior risk-adjusted returns amid evolving technology and competitive pressures for diversified portfolios.
Table of contents
Companies Overview
NVIDIA and Intel shape the semiconductor industry’s future with distinct scale and innovation strategies.
NVIDIA Corporation: Leader in Accelerated Computing
NVIDIA is a semiconductor powerhouse specializing in graphics and AI computing solutions. Its revenue stems primarily from GPUs used in gaming, professional visualization, data centers, and automotive AI. In 2026, NVIDIA sharpens its focus on expanding AI-driven data center platforms and cloud computing software, fueling its competitive edge.
Intel Corporation: Veteran Chip Manufacturer
Intel stands as a legacy semiconductor giant focused on CPUs, chipsets, and system-on-chip technologies. It generates revenue from platform products and adjacent markets like autonomous driving and high-performance compute solutions. Intel’s 2026 strategy targets growth in AI workloads, embedded systems, and cloud service platforms, aiming to regain market momentum.
Strategic Collision: Similarities & Divergences
NVIDIA pursues an open innovation ecosystem leveraging AI and visualization software, while Intel emphasizes integrated platform solutions. Their primary battleground lies in data center and AI chip markets, each vying for dominance. Investors see NVIDIA as a high-growth play in emerging AI, contrasted with Intel’s value-driven approach anchored in diversified semiconductor products.
Income Statement Comparison
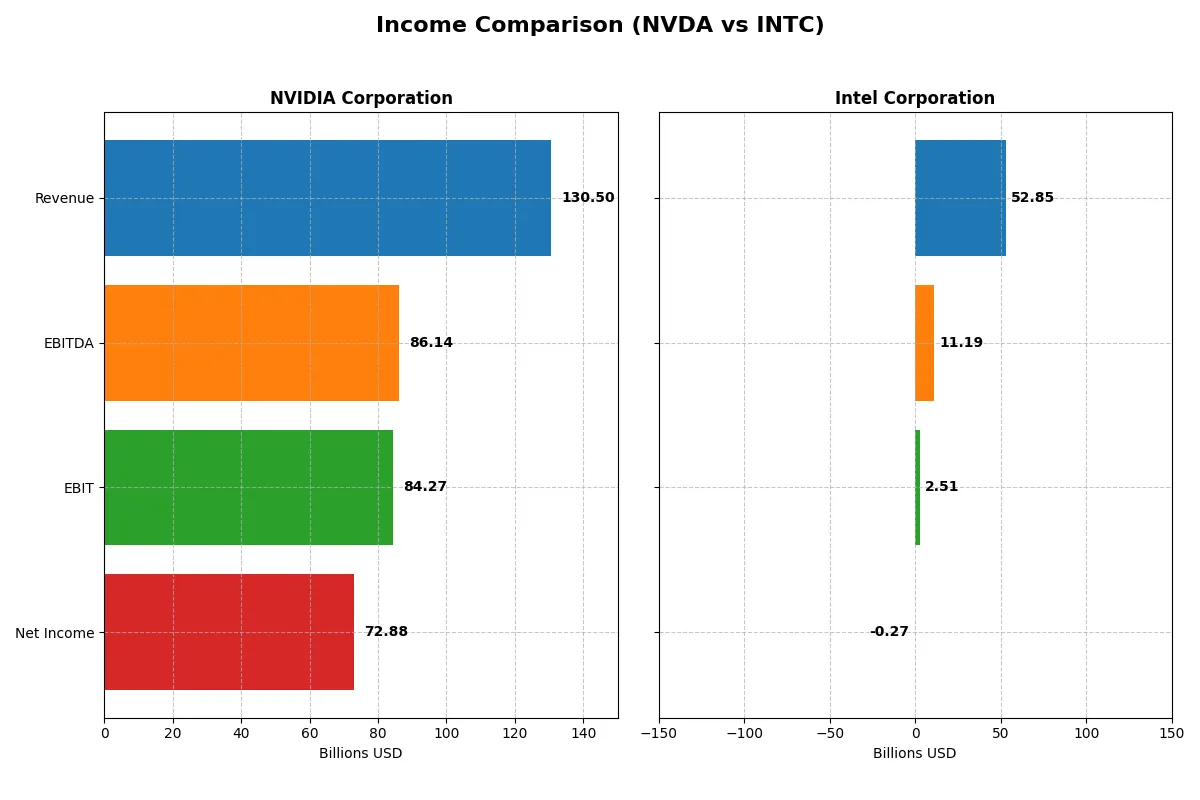
This data dissects the core profitability and scalability of both corporate engines to reveal who dominates the bottom line:
| Metric | NVIDIA Corporation (NVDA) | Intel Corporation (INTC) |
|---|---|---|
| Revenue | 130.5B | 52.9B |
| Cost of Revenue | 32.6B | 34.4B |
| Operating Expenses | 16.4B | 20.6B |
| Gross Profit | 97.9B | 18.5B |
| EBITDA | 86.1B | 11.2B |
| EBIT | 84.3B | 2.5B |
| Interest Expense | 247M | 953M |
| Net Income | 72.9B | -267M |
| EPS | 2.97 | -0.08 |
| Fiscal Year | 2025 | 2025 |
Income Statement Analysis: The Bottom-Line Duel
This income statement comparison reveals which company converts revenue into profits with superior efficiency and growth momentum.
NVIDIA Corporation Analysis
NVIDIA’s revenue soared from $16.7B in 2021 to $130.5B in 2025, with net income surging from $4.3B to $72.9B. Its gross margin remains robust near 75%, while net margin expanded to 55.9%. The latest fiscal year highlights extraordinary scale and margin expansion, reflecting stellar operational efficiency and aggressive growth in high-value segments.
Intel Corporation Analysis
Intel’s revenue declined from $79B in 2021 to $52.9B in 2025, and net income swung from a $19.9B profit to a $267M loss. Gross margin steadied around 35%, but net margin turned negative at -0.5%. Despite some improvement in EBIT and EPS growth last year, Intel struggles with shrinking top-line and poor bottom-line returns, signaling operational and market challenges.
Verdict: Margin Power vs. Revenue Scale
NVIDIA dominates with explosive revenue growth and exceptional margins, delivering superior profitability and operational leverage. Intel faces revenue contraction and negative net margins, undermining its profit generation despite a large gross margin. For investors, NVIDIA’s profile offers a compelling combination of scale and efficiency, while Intel’s profile reflects structural headwinds and recovery risks.
Financial Ratios Comparison
These vital ratios act as a diagnostic tool to expose the underlying fiscal health, valuation premiums, and capital efficiency of the companies compared below:
| Ratios | NVIDIA Corporation (NVDA) | Intel Corporation (INTC) |
|---|---|---|
| ROE | 91.9% | -0.2% |
| ROIC | 75.3% | -0.02% |
| P/E | 39.9 | -658.4 |
| P/B | 36.7 | 1.54 |
| Current Ratio | 4.44 | 2.02 |
| Quick Ratio | 3.88 | 1.65 |
| D/E | 0.13 | 0.41 |
| Debt-to-Assets | 9.2% | 22.0% |
| Interest Coverage | 330.0 | -2.23 |
| Asset Turnover | 1.17 | 0.25 |
| Fixed Asset Turnover | 16.2 | 0.50 |
| Payout ratio | 1.1% | 0% |
| Dividend yield | 0.03% | 0% |
| Fiscal Year | 2025 | 2025 |
Efficiency & Valuation Duel: The Vital Signs
Financial ratios act as a company’s DNA, uncovering hidden risks and operational strengths essential for investment decisions.
NVIDIA Corporation
NVIDIA dominates with an exceptional 91.87% ROE and a robust 55.85% net margin, signaling outstanding profitability. However, its P/E ratio of 39.9 marks it as expensive relative to peers. The company reinvests heavily in R&D, evident in nearly 10% revenue allocation, fueling growth rather than relying on dividends, which remain minimal at 0.03%.
Intel Corporation
Intel struggles with a negative ROE of -0.23% and a net margin below zero, reflecting operational challenges. Its P/E ratio is negative, indicating losses, but the P/B at 1.54 suggests moderate valuation. Intel maintains a solid current ratio of 2.02, but it offers no dividends and faces efficiency issues with low asset turnover, highlighting risks in capital allocation.
Premium Valuation vs. Operational Fragility
NVIDIA offers a superior balance of profitability and growth investment despite a stretched valuation. Intel’s financial health shows more risk, with weak returns and no shareholder payouts. Investors seeking growth and operational excellence may prefer NVIDIA, while Intel’s profile fits those willing to navigate turnaround risks.
Which one offers the Superior Shareholder Reward?
I observe NVIDIA’s minimal dividend yield (~0.03%) with a low payout ratio (~1%) and a robust free cash flow of 2.48/share fueling aggressive buybacks. Intel pays no dividends in 2025 and reports negative free cash flow (-1B), limiting buybacks and stressing sustainability. NVIDIA’s capital allocation prioritizes shareholder returns through buybacks, while Intel focuses on restructuring amid losses. Given NVIDIA’s high-margin growth and sustainable distributions, I find it offers a superior total return profile for 2026 investors.
Comparative Score Analysis: The Strategic Profile
The radar chart reveals the fundamental DNA and trade-offs of NVIDIA and Intel, highlighting each firm’s financial strengths and valuation challenges:
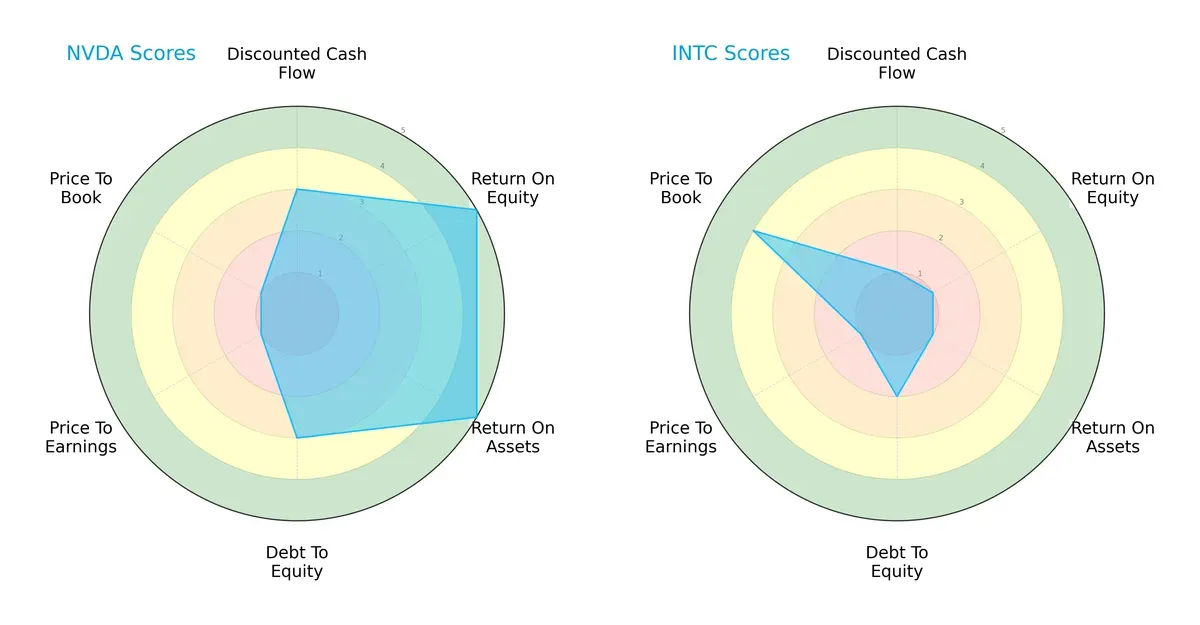
NVIDIA excels in profitability with top ROE and ROA scores (5 each), reflecting superior asset and equity efficiency. Intel lags significantly here, scoring just 1 across these metrics. NVIDIA also holds a moderate debt profile (3), while Intel’s slightly higher debt risk (2) signals cautious capital structure management. Valuation scores expose NVIDIA’s premium pricing (P/E and P/B both 1, very unfavorable), suggesting market expectations for growth. Intel’s valuation is mixed, with a favorable P/B (4) but still a poor P/E (1). Overall, NVIDIA displays a more balanced, profit-driven profile, whereas Intel relies on valuation appeal amid weaker operational performance.
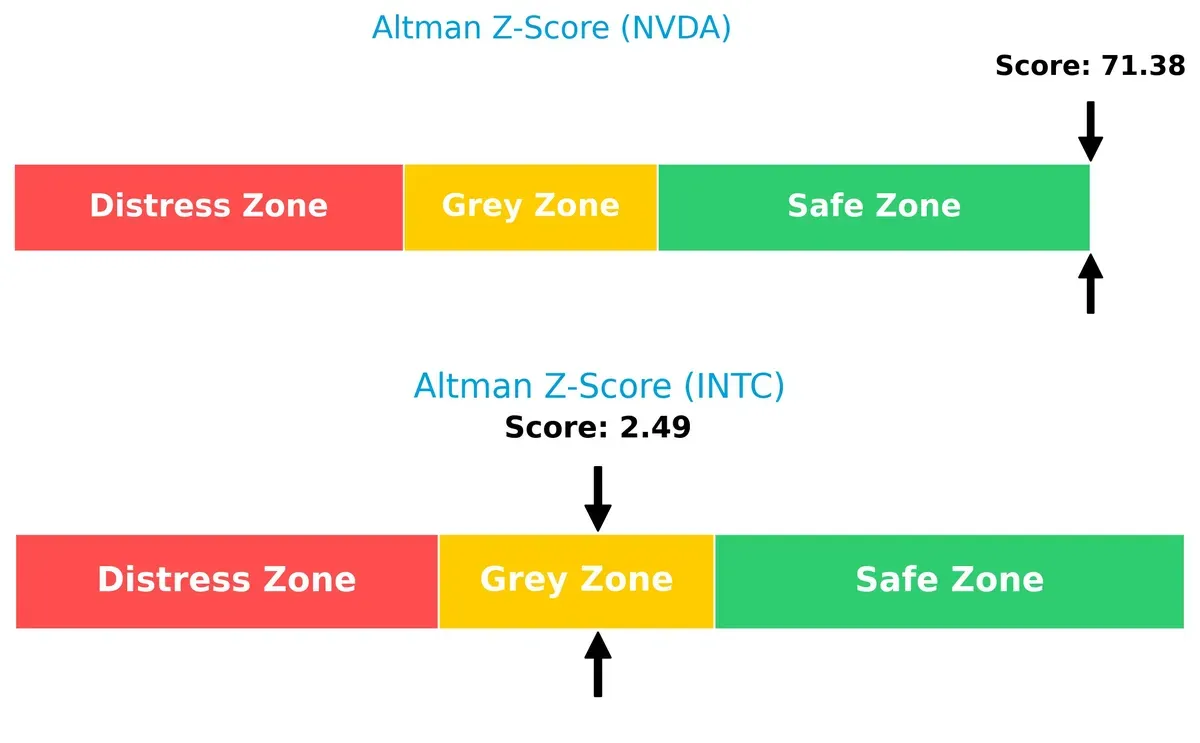
Bankruptcy Risk: Solvency Showdown
NVIDIA’s Altman Z-Score of 71.4 places it firmly in the safe zone, signaling robust financial health and low bankruptcy risk. Intel’s 2.49 score situates it in the grey zone, indicating moderate solvency concerns in this cycle:
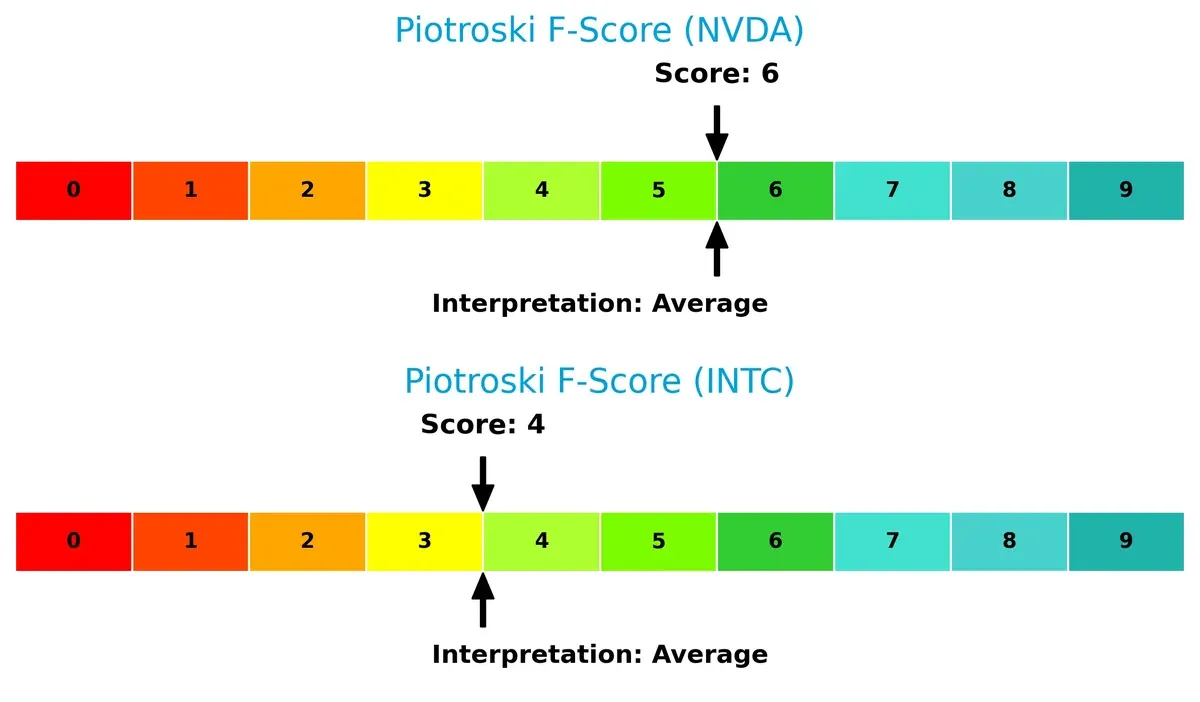
Financial Health: Quality of Operations
Both companies hold average Piotroski F-Scores, with NVIDIA at 6 and Intel at 4. NVIDIA’s higher score suggests stronger internal financial quality, while Intel’s lower mark raises mild red flags in operational efficiency and profitability metrics:
How are the two companies positioned?
This section dissects NVDA and INTC’s operational DNA by comparing revenue distribution and internal strengths and weaknesses. The goal is to confront their economic moats to identify which model offers a more resilient, sustainable advantage today.
Revenue Segmentation: The Strategic Mix
This visual comparison dissects how NVIDIA Corporation and Intel Corporation diversify their income streams and where their primary sector bets lie:
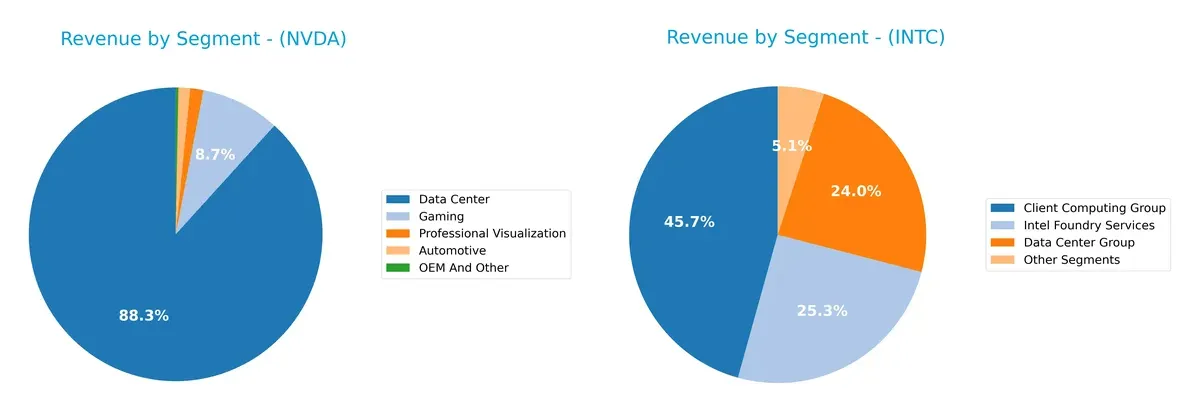
NVIDIA’s revenue pivots heavily on its Data Center segment at $115B, dwarfing its other segments like Gaming at $11.35B. This concentration anchors NVIDIA’s dominance in AI infrastructure but poses concentration risk. Intel spreads revenue more evenly, with Client Computing at $32.2B, Intel Foundry Services at $17.8B, and Data Center at $16.9B, showcasing diversification. Intel’s mix supports ecosystem lock-in across computing and manufacturing, balancing growth and risk.
Strengths and Weaknesses Comparison
This table compares the Strengths and Weaknesses of NVIDIA Corporation and Intel Corporation:
NVIDIA Strengths
- High net margin of 55.85% drives strong profitability
- ROE at 91.87% signals efficient equity use
- Robust ROIC at 75.28% exceeds WACC significantly
- Low debt-to-assets at 9.2% limits financial risk
- Diversified revenue across Data Center, Gaming, Automotive
- Strong global presence with large US and Asia revenues
Intel Strengths
- Favorable P/E and moderate P/B ratios indicate value perception
- Solid current and quick ratios reflect liquidity strength
- Favorable debt ratios at 0.41 D/E and 22.03% debt-to-assets
- Diversified revenue including Client Computing, Data Center, Foundry
- Global footprint includes US, China, Singapore, Taiwan markets
NVIDIA Weaknesses
- High WACC at 14.69% raises cost of capital concerns
- Elevated P/E (39.9) and P/B (36.66) suggest overvaluation risk
- Current ratio unusually high at 4.44 may indicate inefficient asset use
- Very low dividend yield at 0.03% limits income appeal
Intel Weaknesses
- Negative profitability metrics: net margin -0.51%, ROE -0.23%, ROIC -0.02%
- Unfavorable asset turnover ratios indicate lower operational efficiency
- Zero dividend yield limits shareholder returns
- Interest coverage ratio only neutral at 2.63 raises debt service risk
NVIDIA excels in profitability and capital efficiency, but its high valuation and capital costs warrant caution. Intel shows liquidity and valuation strengths but suffers from weak profitability and efficiency, impacting strategic growth prospects.
The Moat Duel: Analyzing Competitive Defensibility
A structural moat is the only reliable shield preserving long-term profits from relentless competitive erosion in dynamic markets:
NVIDIA Corporation: Network Effects and Innovation Powerhouse
NVIDIA’s moat stems from its dominant AI and GPU ecosystems, reflected in a stellar 60.6% ROIC premium over WACC and rock-solid margin expansion. Its growing AI and data center markets deepen this moat in 2026.
Intel Corporation: Legacy Scale Under Pressure
Intel relies on cost advantages and manufacturing scale but suffers a shrinking moat, evidenced by a negative ROIC trend and value destruction. Its turnaround hinges on successful node advancements and market repositioning in 2026.
AI Dominance vs. Manufacturing Legacy: The Moat Showdown
NVIDIA’s rapidly expanding AI-driven network effects create a wider, deeper moat than Intel’s eroding scale advantage. I see NVIDIA better positioned to defend and grow market share through innovation leadership.
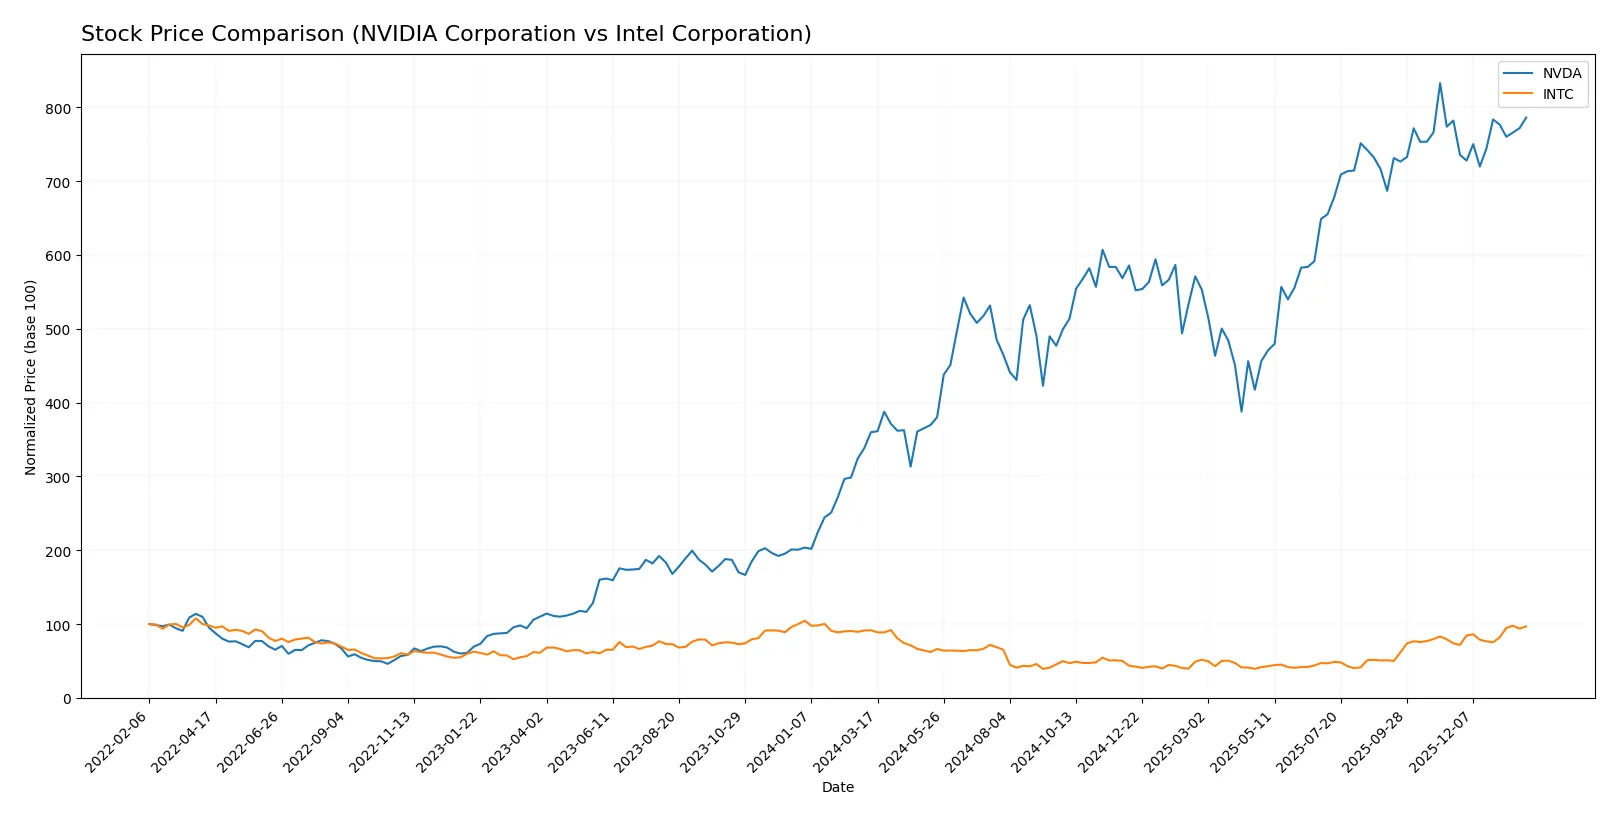
Which stock offers better returns?
The chart highlights key price surges and shifts in trading dynamics for NVIDIA and Intel over the past 12 months, illustrating divergent momentum and recent trend changes.
Trend Comparison
NVIDIA’s stock rose 118.36% over the past year, marking a strong bullish trend with decelerating momentum. It reached a high of 202.49 and a low of 76.2, showing wide price swings.
Intel’s stock gained 5.61% over the same period, reflecting a mild bullish trend with accelerating momentum. Its price ranged from 18.89 to 46.96, indicating moderate volatility.
NVIDIA outperformed Intel with a significantly higher total return and broader price range, despite Intel’s accelerating trend and recent strong gains.
Target Prices
Analysts present a broad but optimistic consensus on semiconductor leaders NVIDIA and Intel.
| Company | Target Low | Target High | Consensus |
|---|---|---|---|
| NVIDIA Corporation | 140 | 352 | 265.21 |
| Intel Corporation | 20 | 66 | 46.95 |
NVIDIA’s consensus target at 265 suggests significant upside from its 191 current price. Intel’s 46.95 target aligns closely with its 46.47 market price, indicating limited near-term appreciation.

Don’t Let Luck Decide Your Entry Point
Optimize your entry points with our advanced ProRealTime indicators. You’ll get efficient buy signals with precise price targets for maximum performance. Start outperforming now!
How do institutions grade them?
NVIDIA Corporation Grades
The table below summarizes recent grades from major financial institutions for NVIDIA Corporation.
| Grading Company | Action | New Grade | Date |
|---|---|---|---|
| Jefferies | Maintain | Buy | 2026-01-16 |
| Mizuho | Maintain | Outperform | 2026-01-09 |
| Stifel | Maintain | Buy | 2025-12-29 |
| Truist Securities | Maintain | Buy | 2025-12-29 |
| B of A Securities | Maintain | Buy | 2025-12-26 |
| Bernstein | Maintain | Outperform | 2025-12-26 |
| Baird | Maintain | Outperform | 2025-12-26 |
| Truist Securities | Maintain | Buy | 2025-12-19 |
| Tigress Financial | Maintain | Strong Buy | 2025-12-18 |
| Morgan Stanley | Maintain | Overweight | 2025-12-01 |
Intel Corporation Grades
The following table presents recent institutional grades for Intel Corporation.
| Grading Company | Action | New Grade | Date |
|---|---|---|---|
| RBC Capital | Maintain | Sector Perform | 2026-01-23 |
| Keybanc | Maintain | Overweight | 2026-01-23 |
| Evercore ISI Group | Maintain | In Line | 2026-01-23 |
| Needham | Maintain | Hold | 2026-01-23 |
| Benchmark | Maintain | Buy | 2026-01-23 |
| Rosenblatt | Maintain | Sell | 2026-01-23 |
| UBS | Maintain | Neutral | 2026-01-23 |
| Citigroup | Maintain | Neutral | 2026-01-23 |
| Stifel | Maintain | Hold | 2026-01-23 |
| Wedbush | Maintain | Neutral | 2026-01-23 |
Which company has the best grades?
NVIDIA consistently receives higher grades, including multiple “Buy” and “Outperform” ratings, versus Intel’s mixed assessments. This contrast signals stronger institutional confidence in NVIDIA’s growth prospects. Investors often interpret such consensus as a positive market signal.
Risks specific to each company
The following categories identify the critical pressure points and systemic threats facing both firms in the 2026 market environment:
1. Market & Competition
NVIDIA Corporation
- Dominates GPU and AI markets with strong innovation, facing fierce competition from AMD and new entrants.
Intel Corporation
- Struggles with market share loss and technology delays, pressured by AMD, NVIDIA, and new chipmakers.
2. Capital Structure & Debt
NVIDIA Corporation
- Maintains low debt-to-equity (0.13) and strong interest coverage (341x), reflecting conservative leverage.
Intel Corporation
- Higher leverage (D/E 0.41) and weaker interest coverage (2.63x) increase financial risk amid profitability challenges.
3. Stock Volatility
NVIDIA Corporation
- High beta (2.31) signals greater stock volatility, driven by growth expectations and tech sector cycles.
Intel Corporation
- Moderate beta (1.35) indicates less volatility but also weaker investor confidence in turnaround prospects.
4. Regulatory & Legal
NVIDIA Corporation
- Faces scrutiny over AI data usage and international trade restrictions, especially with China.
Intel Corporation
- Encounters antitrust risks and export controls, impacting global manufacturing and supply chains.
5. Supply Chain & Operations
NVIDIA Corporation
- Relies heavily on external foundries, vulnerable to geopolitical disruptions but benefits from diversified suppliers.
Intel Corporation
- Operates own fabs but faces costly capacity expansion and operational inefficiencies amid market shifts.
6. ESG & Climate Transition
NVIDIA Corporation
- Invests in energy-efficient AI technologies but must manage rising data center energy demands.
Intel Corporation
- Commits to sustainability goals but legacy manufacturing processes pose environmental costs.
7. Geopolitical Exposure
NVIDIA Corporation
- Significant exposure to US-China tensions affecting sales and supply, especially in semiconductors.
Intel Corporation
- Also exposed to geopolitical risks but benefits from diversified global manufacturing footprint.
Which company shows a better risk-adjusted profile?
NVIDIA’s dominant market position and robust financial health mitigate many risks despite high stock volatility. Intel’s profitability struggles, operational challenges, and weaker capital structure heighten its risk profile. The largest risk for NVIDIA lies in regulatory and geopolitical tensions disrupting supply and sales. For Intel, operational inefficiencies and market share erosion pose the greatest threat. Recent strong interest coverage and low leverage reinforce NVIDIA’s safer financial footing, validating my concern over Intel’s fragile turnaround prospects.
Final Verdict: Which stock to choose?
NVIDIA’s superpower lies in its exceptional capital efficiency and a rapidly growing economic moat. It commands industry-leading profitability and cash flow generation. The main point of vigilance is its lofty valuation, which could temper returns if growth slows. NVIDIA suits investors with an aggressive growth appetite.
Intel’s strategic moat centers on its entrenched market position and steady research investment, offering a more defensive profile. While it currently struggles with profitability and value creation, its lower valuation and improving cash cycle provide a buffer. Intel fits portfolios aiming for GARP—growth at a reasonable price.
If you prioritize cutting-edge innovation and durable competitive advantage, NVIDIA outshines with superior returns on invested capital and robust growth metrics. However, if you seek relative stability and a potential rebound from undervaluation, Intel offers better downside protection despite weaker profitability. Each choice aligns with distinct investor risk tolerance and strategic focus.
Disclaimer: Investment carries a risk of loss of initial capital. The past performance is not a reliable indicator of future results. Be sure to understand risks before making an investment decision.
Go Further
I encourage you to read the complete analyses of NVIDIA Corporation and Intel Corporation to enhance your investment decisions: