In the competitive landscape of healthcare, AstraZeneca PLC (AZN) and Amgen Inc. (AMGN) stand out as formidable players in the drug manufacturing sector. Both companies are renowned for their innovative approaches to biopharmaceuticals, targeting various therapeutic areas such as oncology and chronic diseases. This comparison will explore their market strategies, growth potential, and recent advancements, helping investors discern which company presents a more compelling investment opportunity. Join me as we unravel the nuances that could influence your investment decisions.

Table of contents
Company Overview
AstraZeneca PLC Overview
AstraZeneca PLC, headquartered in Cambridge, UK, is a prominent biopharmaceutical company dedicated to the discovery, development, manufacture, and commercialization of prescription medicines. With a diverse portfolio, AstraZeneca focuses on therapeutic areas including oncology, cardiovascular health, and rare diseases. Notable products include Tagrisso, Imfinzi, and the COVID-19 vaccine Vaxzevria. The company has positioned itself as a leader in innovative drug development, collaborating with various partners to enhance its research capabilities. AstraZeneca’s commitment to addressing significant unmet medical needs underscores its mission to improve patient outcomes globally.
Amgen Inc. Overview
Amgen Inc., based in Thousand Oaks, California, is a biotechnology company engaged in discovering, developing, manufacturing, and delivering human therapeutics across multiple disease areas, including cancer and cardiovascular conditions. Its flagship products, such as Enbrel and Neulasta, are critical in treating chronic diseases and improving patients’ quality of life. Amgen’s focus on innovation is evident in its ongoing partnerships and collaborations aimed at advancing therapeutic solutions. With a strong emphasis on scientific excellence, Amgen continues to drive progress in the biopharmaceutical sector.
Key Similarities and Differences
Both AstraZeneca and Amgen operate within the drug manufacturing industry, focusing on innovative therapies for significant health challenges. However, their business models differ; AstraZeneca emphasizes a broader range of therapeutic areas, including vaccines, while Amgen specializes in biotechnology with a strong focus on chronic and complex diseases. Additionally, AstraZeneca has a more extensive international market presence compared to Amgen’s primary focus on the U.S. market.
Income Statement Comparison
The following table compares the income statements of AstraZeneca PLC (AZN) and Amgen Inc. (AMGN) for the fiscal year 2024, highlighting key financial metrics.
| Metric | AstraZeneca (AZN) | Amgen (AMGN) |
|---|---|---|
| Revenue | 54.1B | 33.4B |
| EBITDA | 15.4B | 13.4B |
| EBIT | 10.4B | 7.8B |
| Net Income | 7.0B | 4.1B |
| EPS | 1.14 | 7.62 |
Interpretation of Income Statement
In 2024, AstraZeneca demonstrated a robust increase in revenue, growing from 45.8B in 2023 to 54.1B, reflecting a solid upward trend in demand for its products. Net income also surged from 5.9B to 7.0B, indicating improved profitability. Amgen, while also growing from 28.2B to 33.4B in revenue, reported a less dramatic increase in net income, from 6.7B to 4.1B, suggesting challenges in managing costs or investments. Overall, AstraZeneca’s margins improved, while Amgen faced pressures that may warrant further investigation for potential risks.
Financial Ratios Comparison
In the table below, I present a comparison of key financial ratios and metrics for AstraZeneca PLC (AZN) and Amgen Inc. (AMGN). This will help you gauge their financial health and operational efficiency.
| Metric | AZN | AMGN |
|---|---|---|
| ROE | 13.01% | 11.22% |
| ROIC | 15.29% | 14.67% |
| P/E | 28.87 | 34.48 |
| P/B | 4.98 | 23.99 |
| Current Ratio | 0.93 | 1.65 |
| Quick Ratio | 0.74 | 0.95 |
| D/E | 0.74 | 10.36 |
| Debt-to-Assets | 28.95% | 66.29% |
| Interest Coverage | 5.95 | 2.30 |
| Asset Turnover | 0.52 | 0.36 |
| Fixed Asset Turnover | 4.64 | 5.11 |
| Payout ratio | 65.80% | 117.14% |
| Dividend yield | 2.28% | 3.43% |
Interpretation of Financial Ratios
Both companies exhibit strong operational metrics, with AstraZeneca showing a healthier balance sheet reflected in its lower debt-to-assets ratio and better interest coverage. While Amgen has a higher dividend yield, its elevated payout ratio raises concerns about sustainability. Conversely, AZN’s P/E ratio suggests it may be undervalued compared to AMGN, offering a potential investment opportunity for cautious investors.
Dividend and Shareholder Returns
AstraZeneca (AZN) has a dividend yield of approximately 2.28% with a payout ratio of about 65.8%, indicating a balanced approach to shareholder returns. In contrast, Amgen (AMGN) offers a higher dividend yield of around 2.96% with a payout ratio of 67.8%. Both companies show commitment to share buybacks, enhancing shareholder value. Overall, these distributions appear sustainable, supporting long-term value creation for shareholders.
Strategic Positioning
In the biopharmaceutical sector, AstraZeneca PLC (AZN) and Amgen Inc. (AMGN) hold significant market shares, with AZN’s market capitalization at approximately $276B and AMGN at $181B. Both companies face competitive pressures from other major players and must navigate technological disruptions, particularly in AI-driven drug development and personalized medicine. AZN’s diverse oncology pipeline and AMGN’s strong portfolio in inflammation and cardiovascular therapies position them strategically, but continuous innovation is essential to maintain their market positions.
Stock Comparison
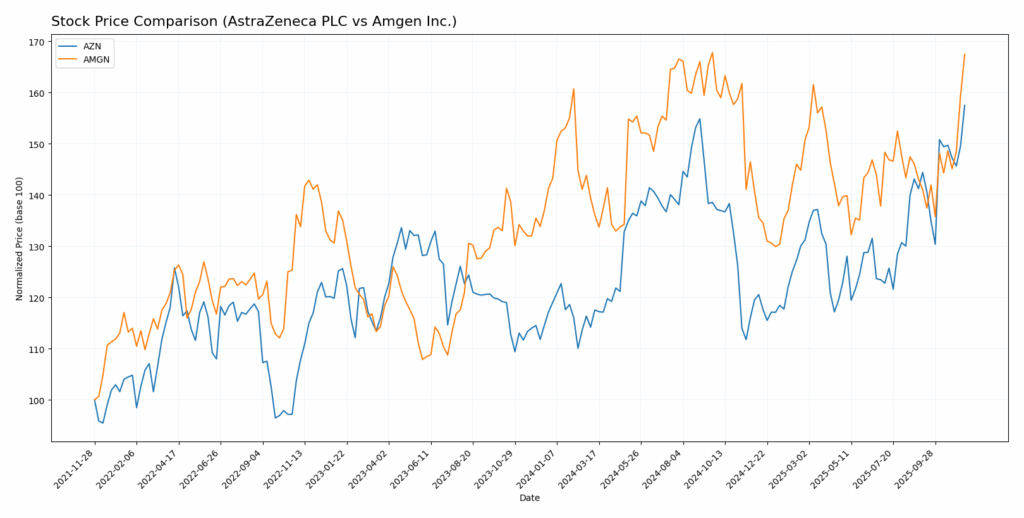
In this analysis, I will review the stock price movements and trading dynamics for AstraZeneca PLC (AZN) and Amgen Inc. (AMGN) over the past year, highlighting key price changes and trends.

Trend Analysis
AstraZeneca PLC (AZN) Over the past year, AZN has exhibited a strong bullish trend, with a percentage change of +34.41%. The stock has shown notable acceleration, reaching a highest price of 89.1 and a lowest price of 62.26. The standard deviation of 6.46 indicates a moderate level of volatility in its price movements. Recently, from August 31 to November 16, 2025, AZN continued to perform well, with a price change of +11.51% and a slight acceleration in trend slope (0.75).
Amgen Inc. (AMGN) In contrast, AMGN has experienced a bearish trend over the same period, with a percentage change of -18.5%. The stock has also shown acceleration, with its highest price at 337.38 and lowest at 261.22. The standard deviation is relatively high at 20.51, indicating significant volatility. In the recent trend from August 31 to November 16, 2025, AMGN managed a price change of +17.04%, reflecting a trend slope of 3.93, which suggests a slight positive shift amidst the overall bearish outlook.
In summary, AZN presents a strong opportunity for growth, while AMGN’s bearish trend warrants a cautious approach.
Analyst Opinions
Recent analyst recommendations for AstraZeneca PLC (AZN) and Amgen Inc. (AMGN) indicate a consensus rating of “B+”. Analysts highlight strong metrics in return on equity and return on assets, suggesting solid operational efficiency. For AZN, analysts appreciate its discounted cash flow score, while AMGN shines with a superior score in the same category. Both companies are seen as stable investments, with no urgent sell signals. Overall, the sentiment leans towards a “hold” strategy for the current year, as growth prospects remain cautiously optimistic.
Stock Grades
In this section, I will present the latest reliable stock grades for AstraZeneca PLC (AZN) and Amgen Inc. (AMGN) based on verifiable sources.
AstraZeneca PLC Grades
| Grading Company | Action | New Grade | Date |
|---|---|---|---|
| UBS | upgrade | Buy | 2025-02-13 |
| UBS | upgrade | Neutral | 2024-11-20 |
| Erste Group | upgrade | Buy | 2024-09-11 |
| TD Cowen | maintain | Buy | 2024-08-12 |
| Argus Research | maintain | Buy | 2024-05-30 |
| BMO Capital | maintain | Outperform | 2024-04-26 |
| Deutsche Bank | upgrade | Hold | 2024-04-16 |
| BMO Capital | maintain | Outperform | 2024-02-12 |
| Deutsche Bank | downgrade | Hold | 2024-02-08 |
| Jefferies | downgrade | Hold | 2024-01-03 |
Amgen Inc. Grades
| Grading Company | Action | New Grade | Date |
|---|---|---|---|
| Piper Sandler | maintain | Overweight | 2025-11-14 |
| Cantor Fitzgerald | maintain | Neutral | 2025-11-06 |
| Wells Fargo | maintain | Overweight | 2025-11-05 |
| Morgan Stanley | maintain | Equal Weight | 2025-11-05 |
| B of A Securities | maintain | Underperform | 2025-09-26 |
| Piper Sandler | maintain | Overweight | 2025-08-25 |
| Morgan Stanley | maintain | Equal Weight | 2025-08-06 |
| Citigroup | maintain | Neutral | 2025-08-06 |
| UBS | maintain | Neutral | 2025-08-06 |
| B of A Securities | maintain | Underperform | 2025-07-23 |
Overall, AstraZeneca has seen several upgrades recently, indicating a positive shift in sentiment among analysts. In contrast, Amgen’s grades have remained stable, with most analysts maintaining their ratings, suggesting a cautious but steady outlook for the company.
Target Prices
Currently, I have gathered reliable target price data for AstraZeneca PLC (AZN) and Amgen Inc. (AMGN) based on analyst consensus.
| Company | Target High | Target Low | Consensus |
|---|---|---|---|
| AstraZeneca PLC | 97 | 97 | 97 |
| Amgen Inc. | 381 | 300 | 332 |
For AstraZeneca, the consensus target price aligns perfectly at 97, indicating strong confidence from analysts compared to its current price of 89.1. In contrast, Amgen’s target consensus of 332 suggests a positive outlook compared to its current price of 336.74, reflecting a cautious but optimistic sentiment among analysts.
Strengths and Weaknesses
The following table outlines the strengths and weaknesses of AstraZeneca PLC (AZN) and Amgen Inc. (AMGN) based on the most current data.
| Criterion | AstraZeneca (AZN) | Amgen (AMGN) |
|---|---|---|
| Diversification | Strong product portfolio across multiple therapeutic areas. | Focuses on specialized areas like oncology and inflammation. |
| Profitability | Net Profit Margin: 13.01% (2024) | Net Profit Margin: 12.24% (2024) |
| Innovation | High investment in R&D, strong pipeline. | Robust pipeline with several innovative therapies. |
| Global presence | Extensive operations in Europe, Americas, and Asia. | Strong presence in North America and expanding globally. |
| Market Share | Significant share in oncology drugs. | Leadership in multiple therapeutic areas, particularly in hematology. |
| Debt level | Debt-to-Equity Ratio: 0.74 | Debt-to-Equity Ratio: 10.36 |
Key takeaways indicate that both companies demonstrate strong profitability and innovation, yet Amgen carries a significantly higher debt level, which investors should consider in their risk assessments.
Risk Analysis
In the following table, I outline the key risks associated with AstraZeneca PLC and Amgen Inc., two prominent companies in the biopharmaceutical sector.
| Metric | AstraZeneca PLC | Amgen Inc. |
|---|---|---|
| Market Risk | Moderate | Moderate |
| Regulatory Risk | High | High |
| Operational Risk | Moderate | Moderate |
| Environmental Risk | Low | Moderate |
| Geopolitical Risk | Moderate | Moderate |
Both companies face significant regulatory risks due to the stringent nature of the healthcare industry, with recent scrutiny on drug pricing and approval processes. Additionally, geopolitical tensions can impact operations and supply chains, particularly for AstraZeneca, which has a global footprint.
Which one to choose?
When comparing AstraZeneca PLC (AZN) and Amgen Inc. (AMGN), both companies exhibit solid fundamentals. AZN shows a gross profit margin of 81.1% and a net profit margin of 13.0%, while AMGN has a gross profit margin of 61.5% and a net profit margin of 12.2%. Despite AZN’s higher margins, AMGN has demonstrated stronger revenue growth with a 17% price increase recently compared to AZN’s 11.5%. Both companies hold a B+ rating from analysts, indicating a balanced outlook, but AZN’s price-to-earnings ratio stands at 28.87, higher than AMGN’s 22.94, signaling a potential overvaluation for AZN.
Investors focused on growth may prefer AMGN for its accelerating revenue, while those prioritizing stability might favor AZN for its robust profit margins. Both firms face risks from competition and market volatility in the biotech sector.
Disclaimer: This article is not financial advice. Each investor is responsible for their own investment decisions.
Go further
I encourage you to read the complete analyses of AstraZeneca PLC and Amgen Inc. to enhance your investment decisions:


