Home > Analyses > Consumer Cyclical > Lululemon Athletica Inc.
Lululemon Athletica shapes how millions embrace an active lifestyle through premium athletic apparel. Its innovative designs and strong brand loyalty dominate the retail apparel sector, especially in yoga and training wear. Known for quality and a direct-to-consumer model, Lululemon expands globally with a loyal customer base. As competition intensifies and valuations fluctuate, I question whether the company’s fundamentals still justify its lofty market expectations.

Table of contents
Business Model & Company Overview
Lululemon Athletica Inc., founded in 1998 and headquartered in Vancouver, Canada, dominates the athletic apparel retail sector. It has built a cohesive ecosystem around premium apparel and accessories designed for yoga, running, and training. With 39K employees and 574 stores globally, Lululemon integrates company-operated outlets, direct-to-consumer channels, and wholesale networks into a unified mission to promote healthy lifestyles.
The company’s revenue engine balances physical retail with a robust e-commerce platform, supported by interactive workout services and fitness accessories. Its strategic footprint spans the Americas, Europe, and Asia, establishing a diversified global presence. Lululemon’s strong brand loyalty and integrated distribution create a durable economic moat, positioning it as a key architect of the future athletic wear market.
Financial Performance & Fundamental Metrics
I analyze Lululemon Athletica Inc.’s income statement, key financial ratios, and dividend payout policy to assess its profitability and capital efficiency.
Income Statement
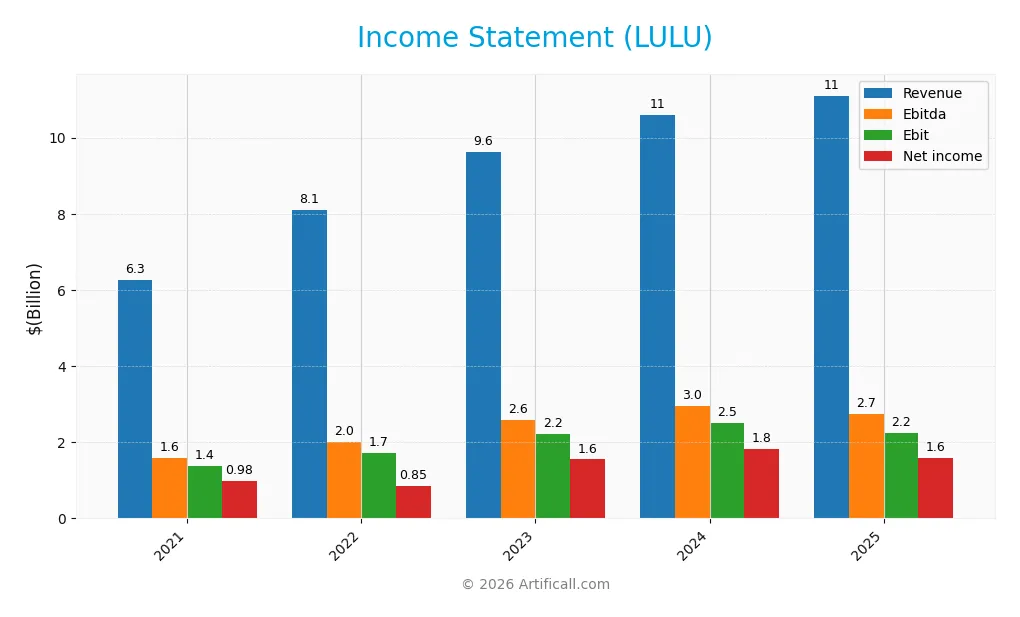
The table below summarizes Lululemon Athletica Inc.’s key income statement metrics for fiscal years 2021 through 2025, reflecting its revenue growth and profitability trends.
| 2021 | 2022 | 2023 | 2024 | 2025 | |
|---|---|---|---|---|---|
| Revenue | 6.26B | 8.11B | 9.62B | 10.59B | 11.10B |
| Cost of Revenue | 2.65B | 3.62B | 4.01B | 4.32B | 4.82B |
| Operating Expenses | 2.28B | 3.16B | 3.48B | 3.77B | 4.07B |
| Gross Profit | 3.61B | 4.49B | 5.61B | 6.27B | 6.28B |
| EBITDA | 1.60B | 2.02B | 2.59B | 2.95B | 2.74B |
| EBIT | 1.37B | 1.73B | 2.21B | 2.51B | 2.24B |
| Interest Expense | 0 | 0 | 0 | 0 | 0 |
| Net Income | 975M | 855M | 1.55B | 1.81B | 1.58B |
| EPS | 7.52 | 6.70 | 12.23 | 14.67 | 13.27 |
| Filing Date | 2022-03-29 | 2023-03-28 | 2024-03-21 | 2025-03-27 | 2026-03-17 |
Income Statement Evolution
Lululemon’s revenue grew 77% from 2021 to 2025, with a modest 4.9% increase from 2024 to 2025. Net income rose 62% over the period but declined nearly 17% in margin last year. Gross margin remained stable near 56.6%, while EBIT margin slipped to 20.2%, signaling margin pressure despite top-line growth.
Is the Income Statement Favorable?
The 2025 income statement shows solid fundamentals with a 14.2% net margin and zero interest expense, reflecting operational efficiency. However, EBIT fell 11% and net margin declined, driven by rising operating expenses matching revenue growth. Overall, half the metrics are favorable, but recent margin contractions warrant cautious monitoring.
Financial Ratios
The following table summarizes key financial ratios for Lululemon Athletica Inc. over the last five fiscal years:
| Ratios | 2021 | 2022 | 2023 | 2024 | 2025 |
|---|---|---|---|---|---|
| Net Margin | 16% | 11% | 16% | 17% | 14% |
| ROE | 36% | 27% | 37% | 42% | 32% |
| ROIC | 26% | 20% | 27% | 29% | 23% |
| P/E | 44.4 | 45.2 | 39.4 | 28.0 | 13.5 |
| P/B | 15.8 | 12.3 | 14.4 | 11.7 | 4.3 |
| Current Ratio | 1.9 | 2.1 | 2.5 | 2.2 | 2.3 |
| Quick Ratio | 1.2 | 1.1 | 1.7 | 1.4 | 1.4 |
| D/E | 0.32 | 0.34 | 0.33 | 0.36 | 0.36 |
| Debt-to-Assets | 18% | 19% | 20% | 21% | 21% |
| Interest Coverage | 0 | 0 | 0 | 0 | 0 |
| Asset Turnover | 1.3 | 1.4 | 1.4 | 1.4 | 1.3 |
| Fixed Asset Turnover | 3.6 | 3.6 | 3.4 | 3.3 | 3.0 |
| Dividend Yield | 0% | 0% | 0% | 0% | 0% |
Evolution of Financial Ratios
Lululemon’s Return on Equity (ROE) showed a moderate decline from 42% in 2024 to 32% in 2025, indicating a slowdown in equity profitability. The Current Ratio remained stable around 2.2, reflecting consistent liquidity. The Debt-to-Equity Ratio held steady near 0.36, suggesting disciplined leverage management throughout the period. Profitability margins experienced a gradual contraction, with net margins declining from 17.1% to 14.2%.
Are the Financial Ratios Fovorable?
In 2025, profitability ratios such as ROE (31.8%) and net margin (14.2%) are favorable, outperforming average sector benchmarks. Liquidity is strong, with a current ratio of 2.26 and quick ratio of 1.36, both signaling good short-term financial health. Leverage remains conservative at a debt-to-equity of 0.36. Market valuation is mixed: the price-to-earnings ratio is attractive at 13.5, while price-to-book at 4.29 is unfavorable. Overall, 79% of key ratios are favorable, indicating a very favorable financial profile.
Shareholder Return Policy
Lululemon Athletica Inc. does not pay dividends, reflecting a likely focus on reinvestment and growth rather than direct income distribution. The company’s absence of dividend payout is consistent with its strategy to prioritize capital allocation towards expansion or innovation.
Despite no dividends, Lululemon engages in share buybacks, which can enhance shareholder value by reducing shares outstanding. This approach appears aligned with sustainable long-term value creation, balancing growth investment and shareholder returns prudently.
Score analysis
The following radar chart illustrates Lululemon Athletica Inc.’s key financial scores across valuation, profitability, and leverage metrics:
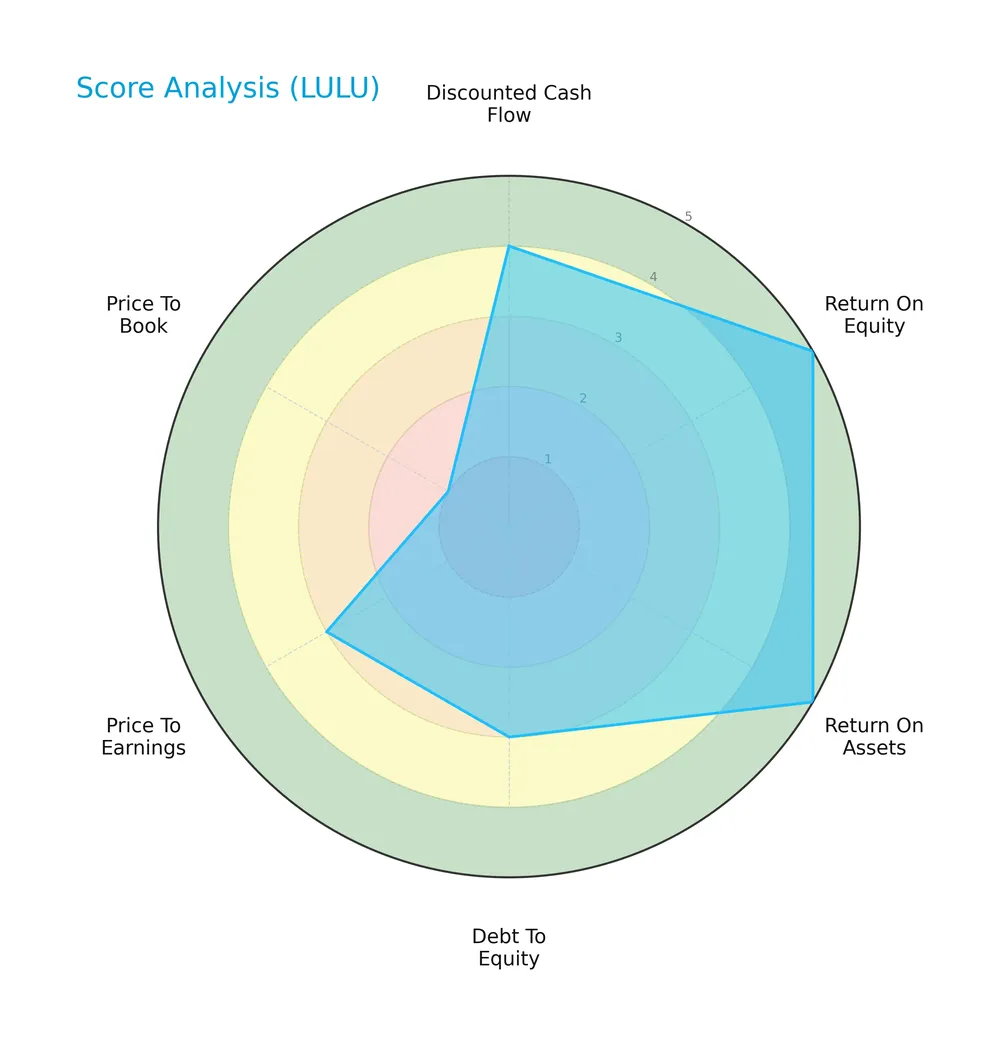
Lululemon scores very favorably on return on equity and assets with top marks of 5 each. Its discounted cash flow is favorable at 4. Debt-to-equity and price-to-earnings scores sit moderately at 3, while price-to-book is very unfavorable at 1.
Analysis of the company’s bankruptcy risk
Lululemon’s Altman Z-Score firmly places it in the safe zone, indicating a low risk of bankruptcy and solid financial stability:

Is the company in good financial health?
The Piotroski Score diagram below shows Lululemon’s financial health status based on profitability, leverage, liquidity, and efficiency metrics:

With a Piotroski Score of 6, Lululemon ranks as average in financial strength. This suggests decent financial health but room for improvement compared to very strong peers.
Competitive Landscape & Sector Positioning
This sector analysis explores Lululemon Athletica Inc.’s strategic positioning, revenue streams, and product portfolio. We examine the company’s main competitors and competitive advantages in the apparel retail industry. I will assess whether Lululemon holds a sustainable competitive advantage over its rivals.
Strategic Positioning
Lululemon focuses on a concentrated product portfolio dominated by women’s apparel (7B in 2025), with growing men’s and other segments. Geographically, it maintains strong North American presence, especially the US (6.3B), alongside significant expansion in China (3.7B) and diversified international markets.
Revenue by Segment
This pie chart presents Lululemon Athletica Inc.’s revenue distribution by product segment for fiscal year 2025, highlighting key drivers and segment contributions.
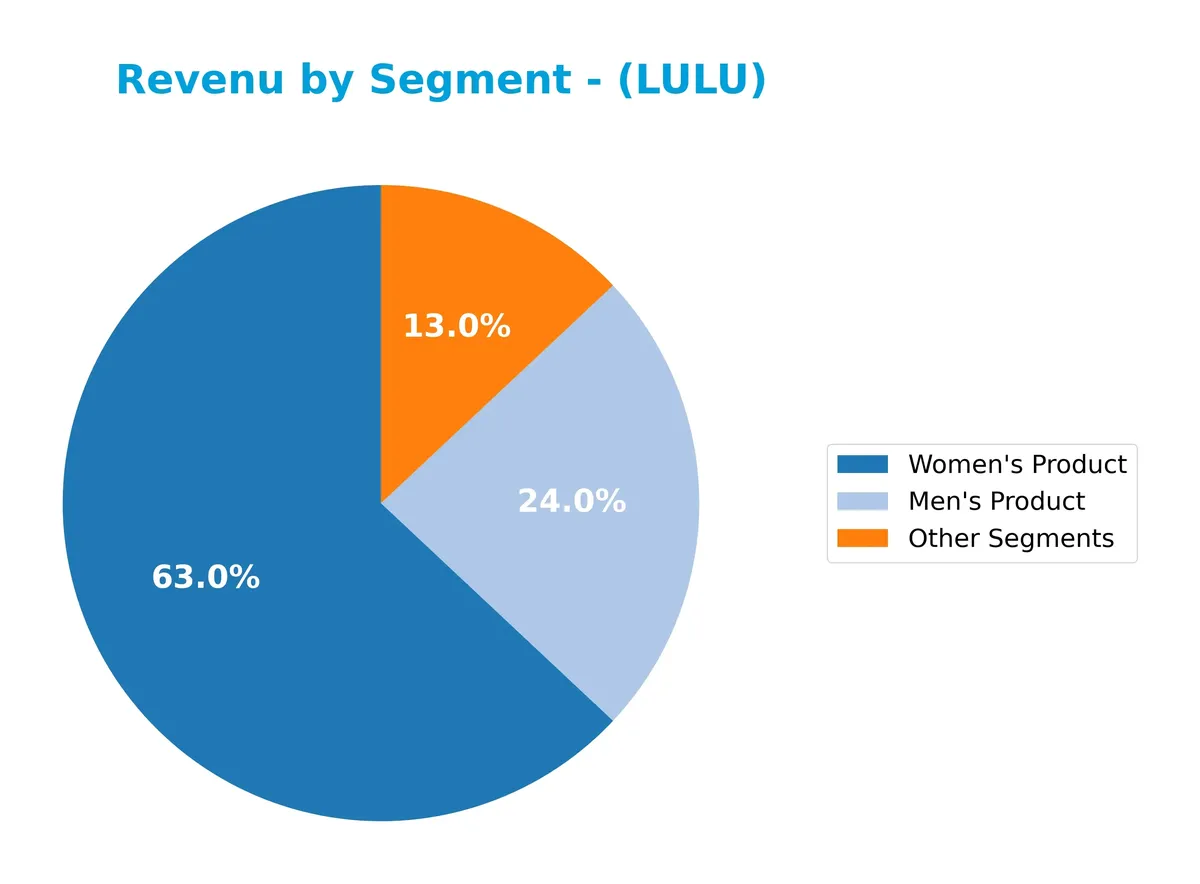
Women’s Product dominates with $7B, reflecting consistent growth and a strong brand moat in women’s athletic apparel. Men’s Product also expands to $2.7B, indicating successful diversification. Other Segments contribute $1.4B, showing steady but smaller scale impact. The 2025 data reveals acceleration in the core Women’s segment, reinforcing Lululemon’s focused capital allocation and market leadership.
Key Products & Brands
Lululemon’s key products and brands span athletic apparel and accessories for men and women, plus other related segments:
| Product | Description |
|---|---|
| Women’s Product | Athletic apparel including pants, shorts, tops, and jackets designed for yoga, running, training, and other activities. |
| Men’s Product | Athletic apparel tailored for men, covering similar categories as the women’s line. |
| Other Segments | Fitness-related accessories, footwear, and additional offerings beyond core apparel lines. |
Lululemon’s product mix remains heavily weighted toward women’s athletic apparel, which consistently generates the majority of revenue. Men’s products and other segments show steady growth, reflecting expanding diversification within the brand portfolio.
Main Competitors
There are 3 main competitors in the Apparel – Retail industry; the table below lists the top 3 leaders by market capitalization:
| Competitor | Market Cap. |
|---|---|
| The TJX Companies, Inc. | 172B |
| Ross Stores, Inc. | 59B |
| Lululemon Athletica Inc. | 24B |
Lululemon Athletica Inc. ranks 3rd among its competitors. Its market cap is about 10% of the leader, The TJX Companies. The company sits below both the average market cap of the top 10 in the sector (85B) and the median market cap (59B). It maintains a significant 247% gap to the next competitor above, Ross Stores.
Comparisons with competitors
Check out how we compare the company to its competitors:
Does LULU have a competitive advantage?
Lululemon Athletica Inc. shows a competitive advantage by consistently creating value, with a ROIC exceeding its WACC by 14.4%. However, its profitability trend is declining, signaling caution.
The company’s extensive global footprint and strong brand in athletic apparel position it well. Expansion into new international markets and continued product innovation offer growth opportunities ahead.
SWOT Analysis
This analysis highlights Lululemon Athletica Inc.’s key strategic factors to guide investment decisions.
Strengths
- strong brand equity
- robust gross margin at 56.6%
- high ROIC at 22.7% exceeding WACC
- strong market presence in US and China
Weaknesses
- declining ROIC trend
- high price-to-book ratio at 4.29
- recent net margin and EPS contraction
- no dividend yield
Opportunities
- expansion in emerging markets
- growth in direct-to-consumer segment
- innovation in fitness and lifestyle apparel
Threats
- intense retail competition
- supply chain disruptions
- sensitivity to consumer spending cycles
Lululemon’s strengths in profitability and brand position it well for growth, but declining profitability and valuation concerns require cautious capital allocation. Strategic focus on innovation and geographic expansion can mitigate competitive and macroeconomic risks.
Stock Price Action Analysis
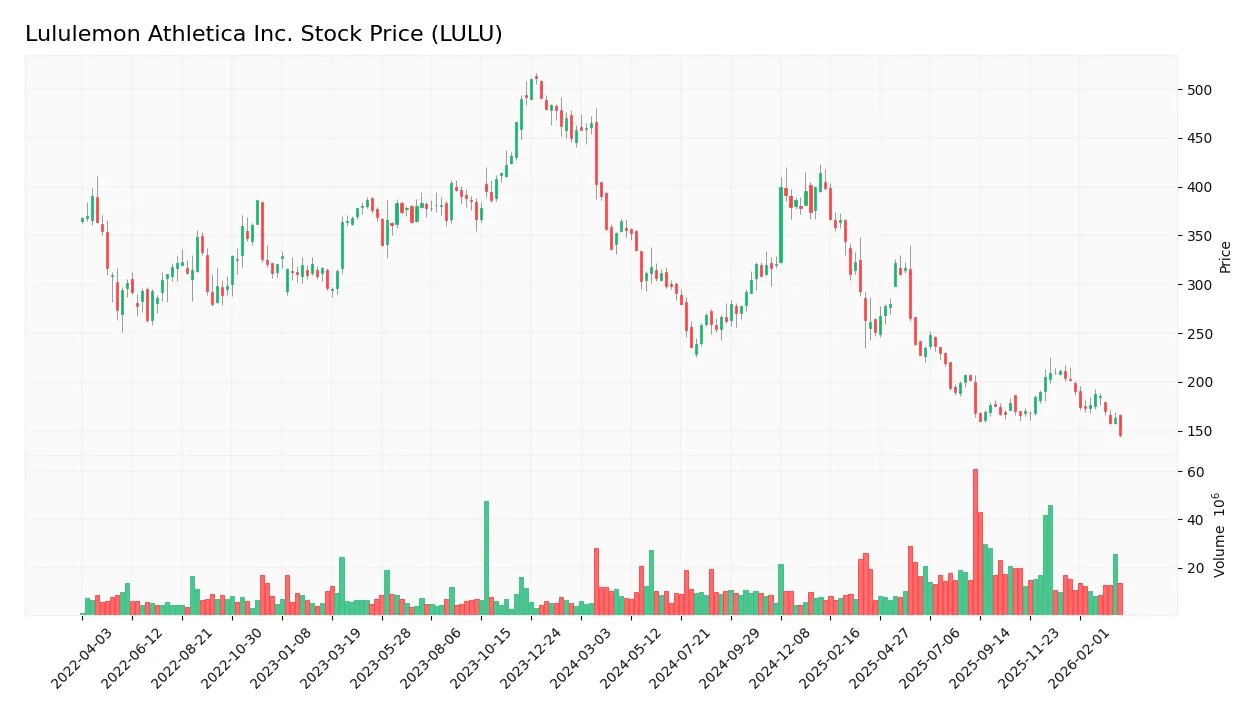
The weekly stock chart below illustrates Lululemon Athletica Inc.’s price movements and key levels over the past 12 months:
Trend Analysis
LULU’s stock declined sharply by 58.93% over the past year, confirming a bearish trend with decelerating momentum. The price swung between a high of 414.2 and a low of 145.85. Recent three-month data shows further decline of 28.47%, slope -4.19, reinforcing sustained downtrend amid moderate volatility.
Volume Analysis
Trading volume is increasing, with sellers dominating 72.82% of recent activity over the last three months. This seller-driven pressure signals weak investor confidence and heightened market participation on the downside. Buyer volume remains subdued at 27.18%, underscoring persistent selling momentum.
Target Prices
Analysts set a confident target consensus for Lululemon Athletica Inc., reflecting strong growth expectations.
| Target Low | Target High | Consensus |
|---|---|---|
| 146 | 250 | 201.25 |
The target range from 146 to 250 suggests optimism, with a consensus price of 201.25 indicating substantial upside potential.

Don’t Let Luck Decide Your Entry Point
Optimize your entry points with our advanced ProRealTime indicators. You’ll get efficient buy signals with precise price targets for maximum performance. Start outperforming now!
Analyst & Consumer Opinions
This section examines analyst ratings and consumer feedback to provide a comprehensive view of Lululemon Athletica Inc.’s market perception.
Stock Grades
Here are the latest verified analyst grades for Lululemon Athletica Inc., reflecting current market sentiment:
| Grading Company | Action | New Grade | Date |
|---|---|---|---|
| Citigroup | Maintain | Neutral | 2026-03-23 |
| BNP Paribas | Maintain | Neutral | 2026-03-18 |
| Telsey Advisory Group | Maintain | Market Perform | 2026-03-18 |
| Truist Securities | Maintain | Hold | 2026-03-18 |
| BTIG | Maintain | Buy | 2026-03-18 |
| Barclays | Maintain | Equal Weight | 2026-03-18 |
| Wells Fargo | Maintain | Equal Weight | 2026-03-18 |
| Stifel | Maintain | Hold | 2026-03-18 |
| JP Morgan | Maintain | Neutral | 2026-03-18 |
| UBS | Maintain | Neutral | 2026-03-18 |
The consensus leans toward a Hold rating, with a balanced mix of Buy and Hold grades and no recent upgrades or downgrades. This steady pattern indicates analyst caution amid stable company fundamentals.
Consumer Opinions
Lululemon Athletica Inc. evokes strong feelings among its customers, reflecting its brand strength and areas for improvement.
| Positive Reviews | Negative Reviews |
|---|---|
| High-quality, durable athletic apparel | Premium pricing limits accessibility |
| Stylish designs that balance comfort | Limited size range frustrating some |
| Excellent customer service experience | Occasional stock shortages reported |
Overall, customers praise Lululemon for its quality and style, creating loyal fans. However, pricing and sizing constraints consistently emerge as barriers for wider adoption.
Risk Analysis
Below is a summary of key risks facing Lululemon Athletica Inc., categorized by likelihood and potential impact:
| Category | Description | Probability | Impact |
|---|---|---|---|
| Market Volatility | Stock price fluctuates widely; 52-week range is 143.96–348.5 | Medium | High |
| Valuation Risk | High price-to-book ratio (4.29) suggests overvaluation risk | Medium | Medium |
| Competitive Pressure | Intense competition in athletic apparel retail | High | Medium |
| Consumer Trends | Shifts in lifestyle or fashion preferences could reduce demand | Medium | High |
| Dividend Policy | No dividend payout may deter income-focused investors | Low | Low |
| Debt Management | Low debt-to-equity (0.36) lowers financial risk | Low | Low |
Lululemon’s biggest risks stem from market volatility and valuation concerns. The stock’s wide trading range signals sensitivity to market cycles. Despite strong profitability and a safe Altman Z-Score (6.2), the high PB ratio warns of potential overvaluation. The company’s reliance on evolving consumer trends in athletic wear also warrants caution.
Should You Buy Lululemon Athletica Inc.?
Lululemon appears to be a robust value creator with a durable moat, despite a declining ROIC trend. Its leverage profile seems manageable, supported by safe-zone Altman Z-scores. The overall A- rating suggests a very favorable financial health profile.
Strength & Efficiency Pillars
Lululemon Athletica Inc. exhibits robust operational efficiency with a net margin of 14.22% and a return on equity of 31.83%. The company’s return on invested capital (ROIC) stands at 22.7%, well above its weighted average cost of capital (WACC) of 8.28%, confirming it as a clear value creator. High asset turnover (1.31) and fixed asset turnover (3.03) further underline efficient capital deployment. Despite a declining ROIC trend, Lululemon maintains strong profitability and operational margins in a competitive retail sector.
Weaknesses and Drawbacks
The company’s valuation presents concerns, notably an unfavorable price-to-book ratio of 4.29, signaling a premium valuation that could pressure future returns. While the price-to-earnings ratio at 13.49 remains reasonable, the moderate debt-to-equity ratio of 0.36 suggests some leverage risk. Market dynamics show seller dominance with only 27.18% buyer volume recently, intensifying short-term headwinds. These factors combined urge caution, especially given the bearish stock trend and recent deceleration in price momentum.
Our Final Verdict about Lululemon Athletica Inc.
Lululemon demonstrates strong fundamentals as a value creator with solid profitability and efficient capital use. However, the recent seller dominance and uncertain market sentiment suggest a wait-and-see approach. Despite its operational strengths, the bearish trend and premium valuation may warrant patience for a more favorable entry point. The profile may appear attractive for long-term exposure but requires careful monitoring of market signals.
Disclaimer: This content is for informational purposes only and does not constitute financial, investment, or other professional advice. Investing in financial markets involves a significant risk of loss, and past performance is not indicative of future results.
Additional Resources
- Lululemon (LULU) Price Target Cut Amid Leadership Concerns – Yahoo Finance (Mar 26, 2026)
- 68,697 Shares in lululemon athletica inc. $LULU Bought by Generate Investment Management Ltd – MarketBeat (Mar 28, 2026)
- lululemon athletica inc. (LULU) Is a Trending Stock: Facts to Know Before Betting on It – Yahoo Finance Singapore (Mar 24, 2026)
- LULU Stock Price, Quote & Chart | LULULEMON ATHLETICA INC (NASDAQ:LULU) – ChartMill (Mar 24, 2026)
- lululemon athletica inc. stock underperforms Wednesday when compared to competitors – MarketWatch (Mar 25, 2026)
For more information about Lululemon Athletica Inc., please visit the official website: shop.lululemon.com