Home > Analyses > Energy > Baker Hughes Company
Baker Hughes Company powers the global energy transition with cutting-edge technologies that shape oil and gas exploration and production. As a titan in oilfield services, equipment, turbomachinery, and digital solutions, it drives innovation and operational efficiency across upstream and downstream sectors. I’ve observed that Baker Hughes’ diverse portfolio and industrial scale position it uniquely amid energy market shifts. The key question now: do its fundamentals justify the current valuation and growth expectations in a turbulent energy landscape?

Table of contents
Business Model & Company Overview
Baker Hughes Company, founded in 1987 and headquartered in Houston, TX, dominates the Oil & Gas Equipment & Services sector with a diverse technology and service ecosystem. It operates four integrated segments—Oilfield Services, Oilfield Equipment, Turbomachinery & Process Solutions, and Digital Solutions—forming a cohesive mission to optimize energy and industrial value chains worldwide.
Its revenue engine balances equipment sales with high-margin recurring services across Americas, Europe, and Asia. The firm’s offerings span drilling, production, compression, and digital monitoring solutions. Baker Hughes leverages this broad portfolio and global reach to maintain a formidable economic moat, shaping the future of energy infrastructure.
Financial Performance & Fundamental Metrics
I analyze Baker Hughes Company’s income statement, key financial ratios, and dividend payout policy to evaluate its core financial health and shareholder value approach.
Income Statement
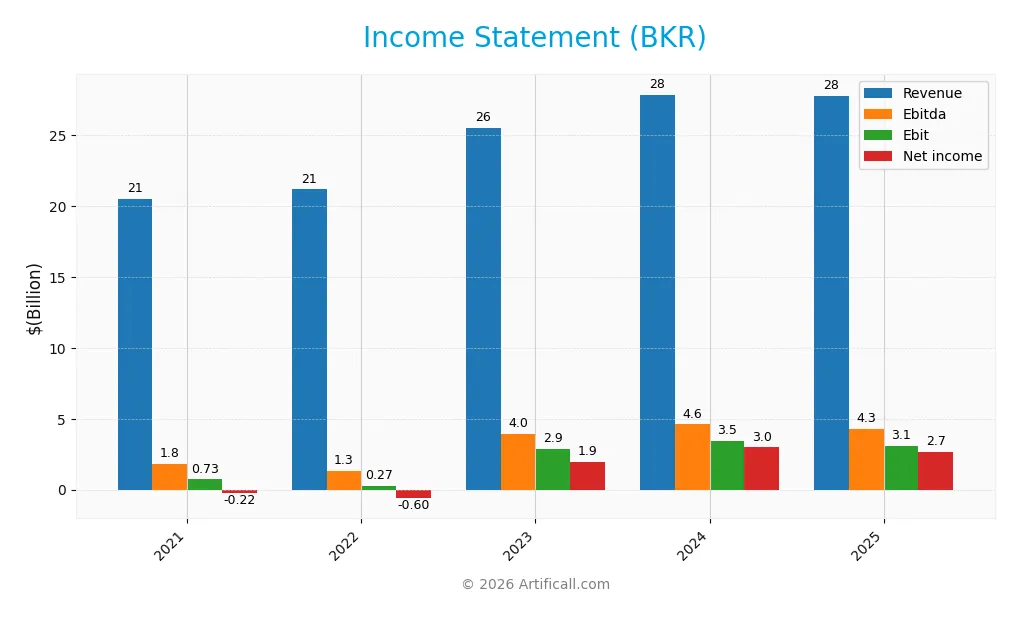
Below is the income statement summary for Baker Hughes Company (BKR) over the last five fiscal years, showing key profitability metrics and earnings per share.
| 2021 | 2022 | 2023 | 2024 | 2025 | |
|---|---|---|---|---|---|
| Revenue | 20.5B | 21.2B | 25.5B | 27.8B | 27.7B |
| Cost of Revenue | 16.5B | 16.8B | 20.3B | 21.9B | 21.2B |
| Operating Expenses | 2.7B | 3.2B | 2.9B | 2.8B | 3.2B |
| Gross Profit | 4.0B | 4.4B | 5.3B | 5.8B | 6.5B |
| EBITDA | 1.8B | 1.3B | 4.0B | 4.6B | 4.3B |
| EBIT | 727M | 274M | 2.9B | 3.5B | 3.1B |
| Interest Expense | 299M | 252M | 216M | 198M | 222M |
| Net Income | -219M | -601M | 1.9B | 3.0B | 2.7B |
| EPS | -0.27 | -0.61 | 1.93 | 3.00 | 2.62 |
| Filing Date | 2022-02-11 | 2023-02-14 | 2024-02-05 | 2025-02-04 | 2026-01-25 |
Income Statement Evolution
Baker Hughes’ revenue grew 35% from 2021 to 2025 but declined slightly by 0.34% in the last year. Net income surged over 1300% across the period, though it fell 10.4% in 2025. Gross and EBIT margins improved, with gross margin at 23.6% and EBIT margin at 11.17%, indicating enhanced profitability despite recent margin pressure.
Is the Income Statement Favorable?
The 2025 income statement shows solid fundamentals with a favorable net margin of 9.59% and low interest expense at 0.8% of revenue. However, revenue and net income declined slightly year-over-year, signaling near-term challenges. Overall, the profit margins and earnings per share remain strong, supporting a generally favorable income statement profile.
Financial Ratios
The following table summarizes key financial ratios for Baker Hughes Company (BKR) from 2021 to 2025, providing a clear snapshot of profitability, liquidity, valuation, leverage, efficiency, and dividend metrics:
| Ratios | 2021 | 2022 | 2023 | 2024 | 2025 |
|---|---|---|---|---|---|
| Net Margin | -1.1% | -2.8% | 7.6% | 10.7% | 9.6% |
| ROE | -1.5% | -4.2% | 12.6% | 17.6% | 12.3% |
| ROIC | -3.9% | -131% | 7.1% | 11.2% | 11.0% |
| P/E | -90.5x | -48.5x | 17.7x | 13.8x | 16.9x |
| P/B | 1.34x | 2.02x | 2.24x | 2.43x | 2.08x |
| Current Ratio | 1.65 | 1.32 | 1.25 | 1.32 | 1.36 |
| Quick Ratio | 1.21 | 0.90 | 0.86 | 0.94 | 1.00 |
| D/E | 0.45 | 0.46 | 0.39 | 0.36 | 0.28 |
| Debt-to-Assets | 19.0% | 19.5% | 16.3% | 15.7% | 14.9% |
| Interest Coverage | 4.38 | 4.70 | 10.7 | 15.6 | 15.1 |
| Asset Turnover | 0.58 | 0.62 | 0.69 | 0.73 | 0.68 |
| Fixed Asset Turnover | 4.20 | 4.66 | 5.21 | 5.43 | 5.21 |
| Dividend Yield | 2.99% | 2.49% | 2.28% | 2.04% | 2.02% |
Evolution of Financial Ratios
Return on Equity (ROE) fluctuated from negative in 2021 and 2022 to 12.31% in 2025, showing a recovery in profitability. The Current Ratio remained stable around 1.3 to 1.65, indicating consistent liquidity. Debt-to-Equity Ratio steadily improved from 0.45 in 2021 to 0.28 in 2025, reflecting reduced leverage and stronger balance sheet management.
Are the Financial Ratios Fovorable?
In 2025, profitability metrics like ROE (12.31%) and net margin (9.59%) are neutral, while Return on Invested Capital (11.01%) and Weighted Average Cost of Capital (7.32%) are favorable, signaling efficient capital use. Liquidity ratios (current 1.36, quick 1.0) are neutral. Leverage ratios, including debt-to-equity (0.28) and debt-to-assets (14.89%), are favorable. Market multiples like P/E (16.91) and P/B (2.08) remain neutral. Overall, ratios suggest a slightly favorable financial position.
Shareholder Return Policy
Baker Hughes maintains a consistent dividend payout with a 34% payout ratio and a 2.02% annual yield in 2025. Dividend per share rose steadily over recent years, supported by free cash flow coverage and occasional share buybacks, indicating disciplined capital allocation.
This balanced approach reflects prudent management of shareholder returns. The dividend policy, combined with buybacks, supports sustainable long-term value creation. However, investors should monitor payout levels relative to earnings to avoid pressure on cash flow in cyclical downturns.
Score analysis
This radar chart illustrates Baker Hughes Company’s fundamental valuation and financial performance metrics:
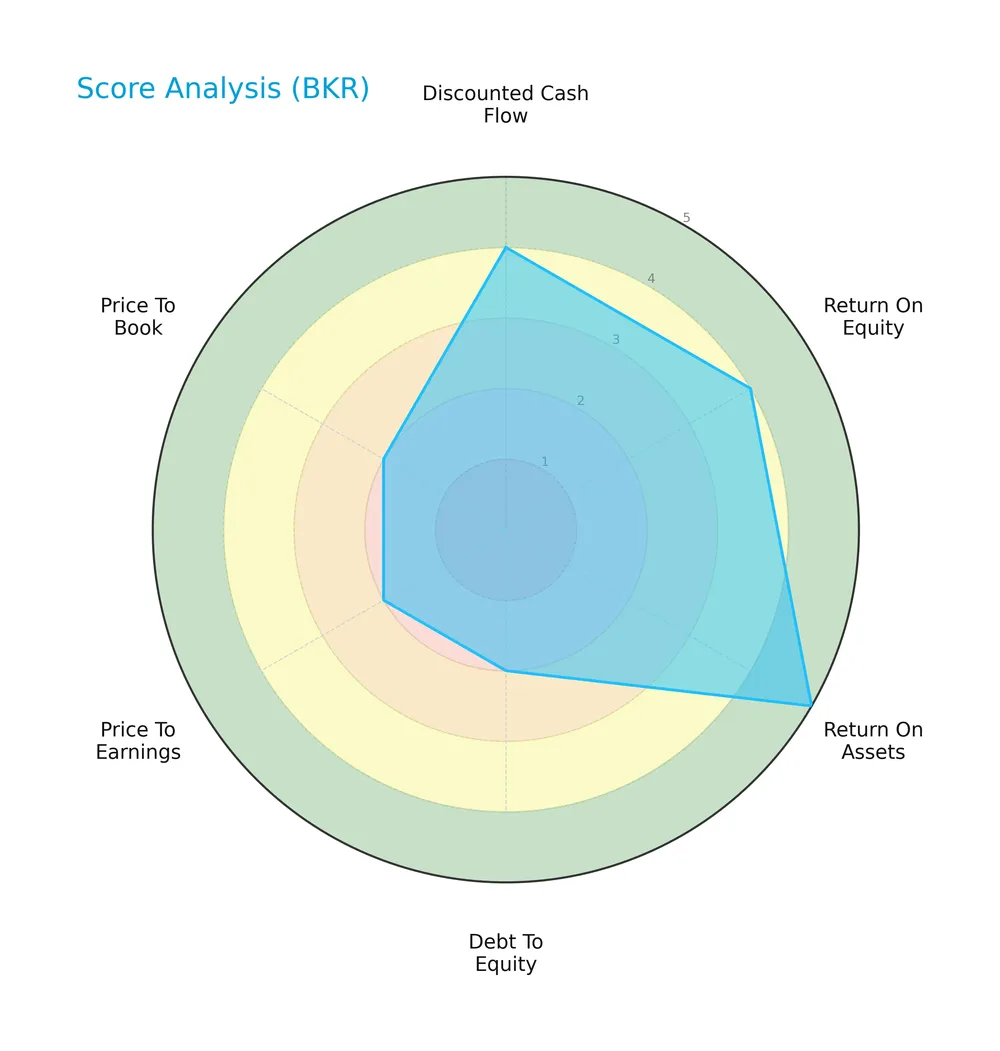
Baker Hughes scores well on discounted cash flow (4) and return on equity (4), indicating solid profitability and valuation. Return on assets scores very favorably at 5. However, debt-to-equity, price-to-earnings, and price-to-book scores are moderate at 2, reflecting some concerns on leverage and valuation multiples.
Analysis of the company’s bankruptcy risk
The Altman Z-Score places Baker Hughes in the grey zone, indicating a moderate risk of financial distress and potential bankruptcy:

Is the company in good financial health?
The Piotroski Score diagram presents an overview of the company’s financial strength based on nine fundamental criteria:

With a Piotroski Score of 8, Baker Hughes demonstrates very strong financial health, reflecting robust profitability, efficient capital use, and sound balance sheet management.
Competitive Landscape & Sector Positioning
This sector analysis examines Baker Hughes Company’s strategic positioning, revenue streams, and key products. I will assess whether Baker Hughes holds a competitive advantage over its main competitors.
Strategic Positioning
Baker Hughes Company diversifies across four key segments: Oilfield Services and Equipment, Industrial and Energy Technology, Turbomachinery & Process Solutions, and Digital Solutions. Geographically, it generates roughly 74% of revenue outside the US, reflecting broad global exposure in the oil and gas equipment and services sector.
Revenue by Segment
The pie chart illustrates Baker Hughes Company’s revenue distribution by segment for the fiscal year 2024, highlighting key business drivers in industrial technology and oilfield services.
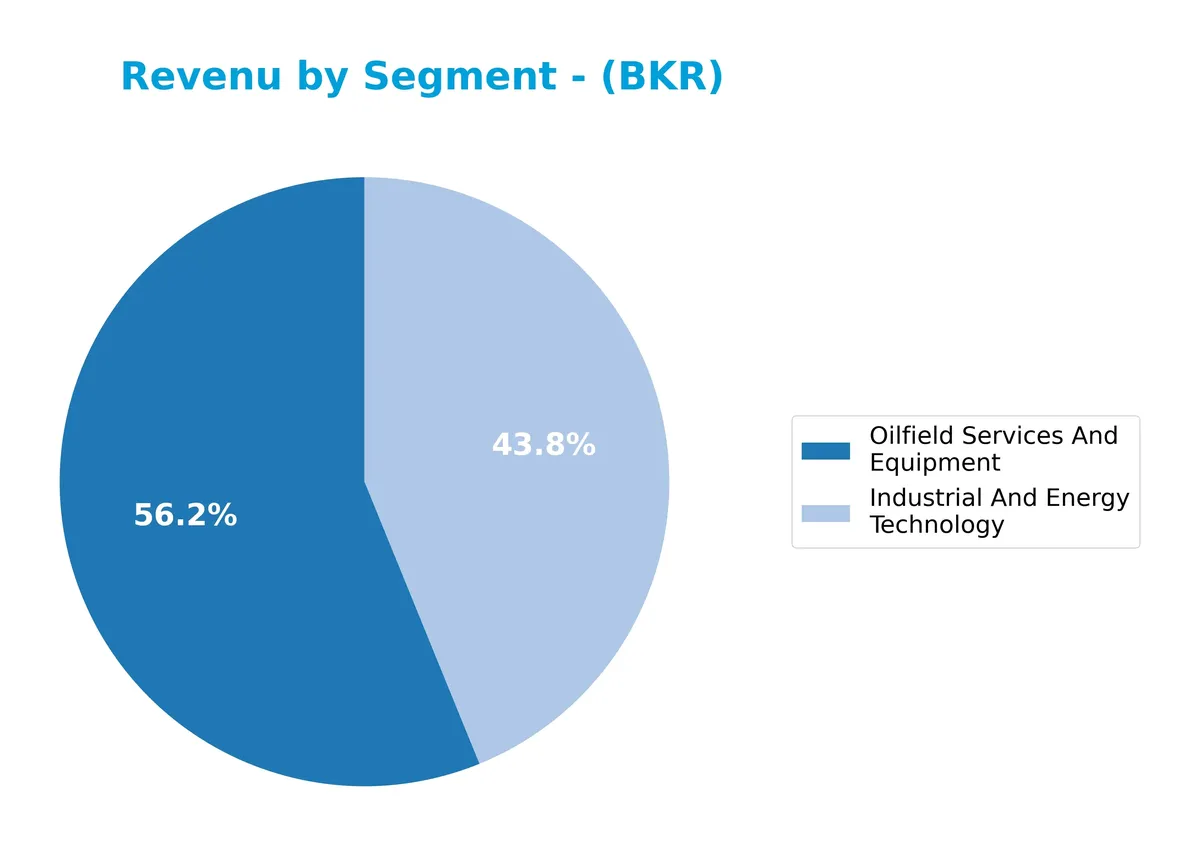
In 2024, Oilfield Services And Equipment leads with $15.6B, showing steady growth from $13.2B in 2022. Industrial And Energy Technology follows, accelerating sharply to $12.2B from $7.9B in 2022. This shift signals a strategic emphasis on advanced industrial solutions, reducing reliance on traditional oilfield equipment alone. Segment diversification improves resilience but requires monitoring as concentration in these two segments intensifies.
Key Products & Brands
The table below details Baker Hughes Company’s primary product segments and their core offerings:
| Product | Description |
|---|---|
| Oilfield Services and Equipment | Exploration, drilling, wireline, completion, production, intervention services; fluids, chemicals, artificial lift technologies. |
| Industrial and Energy Technology | Equipment and services for mechanical-drive, compression, power generation, pumps, valves, and LNG solutions. |
| Turbomachinery and Process Solutions | Mechanical-drive, compression, power-generation equipment; drivers, compressors, pumps, valves, LNG solutions. |
| Digital Solutions | Sensor-based measurements, machine health monitoring, asset management, control systems, non-destructive testing. |
| Oilfield Equipment | Subsea and surface wellheads, pressure control and production systems, flexible pipe systems, well intervention. |
Baker Hughes spans a broad portfolio, from traditional oilfield services to advanced digital and turbomachinery solutions. This diverse mix supports the entire energy value chain globally.
Main Competitors
There are 4 main competitors in the Oil & Gas Equipment & Services industry, with the table listing the top 4 leaders by market capitalization:
| Competitor | Market Cap. |
|---|---|
| SLB N.V. | 60B |
| Baker Hughes Company | 47B |
| Halliburton Company | 25B |
| TechnipFMC plc | 19B |
Baker Hughes ranks 2nd among its competitors, with a market cap at 95.07% of the leader SLB N.V. The company stands above both the average market cap of the top 10 competitors (37.7B) and the sector median (36B). It maintains a 5.19% gap below SLB, its closest rival.
Comparisons with competitors
Check out how we compare the company to its competitors:
Does Baker Hughes Company have a competitive advantage?
Baker Hughes Company demonstrates a sustainable competitive advantage, evidenced by a very favorable moat rating and ROIC exceeding WACC by nearly 3.7%, indicating value creation. The company’s ROIC trend has grown sharply, signaling efficient capital use and increasing profitability over 2021-2025.
Looking ahead, Baker Hughes leverages its diverse segments—Oilfield Services, Equipment, Turbomachinery, and Digital Solutions—to target global energy markets. Expansion in digital sensor technologies and life-of-field solutions offers promising opportunities to strengthen its market position and adapt to evolving industry demands.
SWOT Analysis
This SWOT analysis highlights Baker Hughes Company’s key strategic factors affecting its market position and future prospects.
Strengths
- diversified portfolio across four segments
- strong global presence with expanding non-US revenue
- favorable ROIC exceeding WACC indicating value creation
Weaknesses
- recent 1-year revenue decline
- margin compression in EBIT and net income growth
- moderate debt-to-equity ratio limits financial flexibility
Opportunities
- growing demand for digital and turbomachinery solutions
- increasing energy transition investments
- expanding service offerings in offshore and industrial sectors
Threats
- volatile oil & gas prices impact revenue stability
- regulatory and environmental compliance costs
- competitive pressure from integrated energy service firms
Baker Hughes leverages its diversified segments and solid capital efficiency to create value. However, recent revenue softness and margin pressures require strategic focus on innovation and cost control. The firm’s growth hinges on capturing energy transition opportunities while navigating sector volatility.
Stock Price Action Analysis
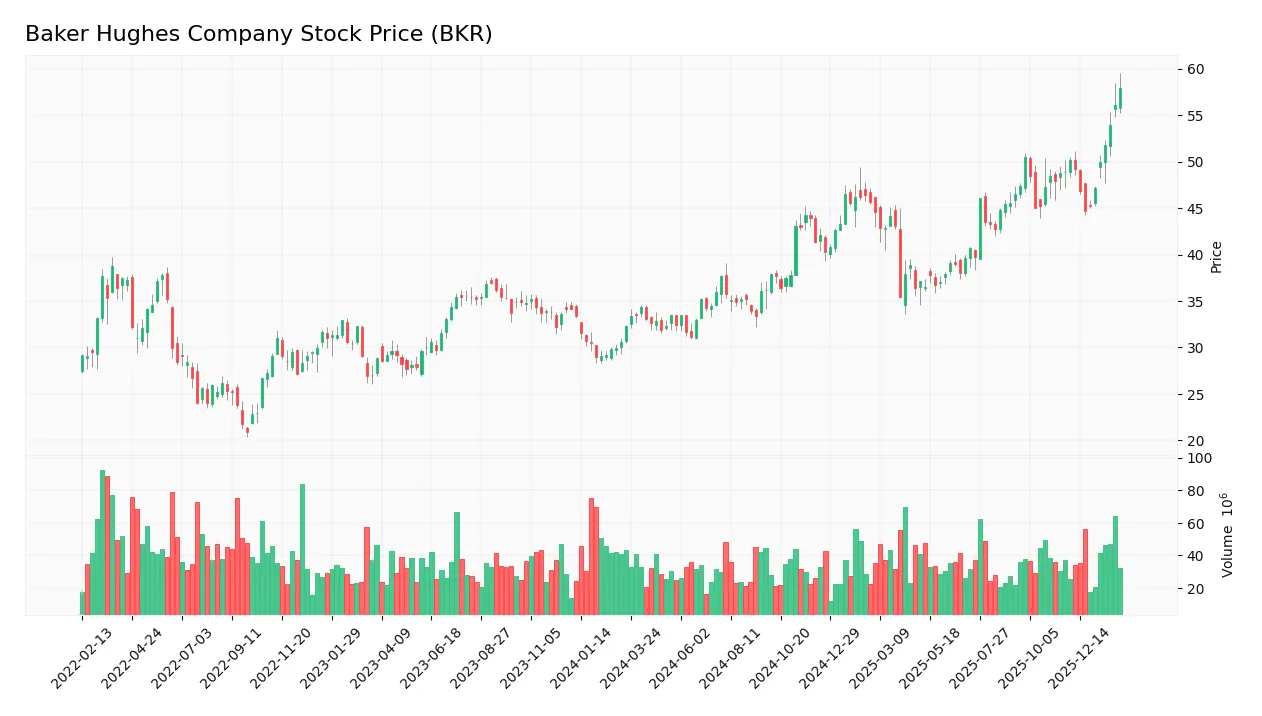
The weekly stock chart for Baker Hughes Company (BKR) highlights price movements and trends over the last 100 weeks:
Trend Analysis
Over the past two years, BKR’s stock price rose 79.24%, indicating a strong bullish trend with accelerating momentum. The price ranged from a low of 31.09 to a high of 57.93, with volatility measured by a 6.1% standard deviation. Recent months show continued upward slope and moderate volatility.
Volume Analysis
Over the last three months, trading volume increased with buyer volume at 332M versus seller volume at 125M, reflecting strong buyer dominance at 72.6%. This rising volume suggests robust investor interest and positive market participation in the stock.
Target Prices
Analysts set a clear target price consensus for Baker Hughes Company (BKR), reflecting moderate upside potential.
| Target Low | Target High | Consensus |
|---|---|---|
| 52 | 67 | 59.4 |
The target range suggests cautious optimism, with analysts expecting BKR to trade between $52 and $67, centering around $59.4.

Don’t Let Luck Decide Your Entry Point
Optimize your entry points with our advanced ProRealTime indicators. You’ll get efficient buy signals with precise price targets for maximum performance. Start outperforming now!
Analyst & Consumer Opinions
This section examines Baker Hughes Company’s recent analyst ratings and consumer feedback to assess market sentiment and reputation.
Stock Grades
The following table presents recent analyst grades for Baker Hughes Company from recognized firms:
| Grading Company | Action | New Grade | Date |
|---|---|---|---|
| Jefferies | Maintain | Buy | 2026-02-02 |
| Stifel | Maintain | Buy | 2026-02-02 |
| UBS | Maintain | Neutral | 2026-01-28 |
| Citigroup | Maintain | Buy | 2026-01-28 |
| JP Morgan | Maintain | Overweight | 2026-01-27 |
| Susquehanna | Maintain | Positive | 2026-01-27 |
| Barclays | Maintain | Overweight | 2026-01-27 |
| BMO Capital | Maintain | Outperform | 2026-01-27 |
| Stifel | Maintain | Buy | 2026-01-27 |
| Stifel | Maintain | Buy | 2026-01-21 |
Analyst sentiment remains broadly positive with multiple Buy and Overweight ratings. The consistent maintenance of prior grades reflects stable confidence in Baker Hughes amid the sector’s current dynamics.
Consumer Opinions
Baker Hughes Company (BKR) draws mixed reactions from its customer base, reflecting a dynamic perception of its services and products.
| Positive Reviews | Negative Reviews |
|---|---|
| Reliable equipment performance under tough conditions | Occasional delays in customer support response |
| Strong technical expertise and knowledgeable staff | Pricing perceived as higher than some competitors |
| Consistently high-quality products with durable materials | Complex contract terms confuse some clients |
Overall, consumer feedback highlights Baker Hughes’ strength in product reliability and expert service. However, customers frequently cite challenges with support responsiveness and pricing transparency. These factors warrant close attention for long-term client retention.
Risk Analysis
Below is a summary table of key risks facing Baker Hughes Company (BKR) and their potential impact on the business:
| Category | Description | Probability | Impact |
|---|---|---|---|
| Market Volatility | Oil & gas sector cyclicality affects demand for equipment and services. | High | High |
| Financial Distress | Altman Z-Score of 2.86 places BKR in a grey zone, indicating moderate bankruptcy risk. | Medium | Medium |
| Debt Management | Moderate debt-to-equity ratio (0.28) with favorable interest coverage reduces refinancing risk. | Low | Medium |
| Operational Risk | Exposure to offshore and onshore drilling risks including regulatory and environmental issues. | Medium | High |
| Price Fluctuations | Oil price swings can compress margins and reduce capital expenditure by clients. | High | High |
| Dividend Stability | Dividend yield at 2.02% is favorable but could be pressured by market downturns. | Medium | Low |
The most significant risks are market volatility and operational exposure, both common in the energy equipment sector. The Altman Z-Score signals moderate financial risk but is offset by strong Piotroski and ROIC metrics. Investors should watch oil price trends and regulatory developments closely.
Should You Buy Baker Hughes Company?
Baker Hughes appears to be improving operational efficiency with a durable competitive moat supported by strong value creation. Despite moderate leverage, its overall B+ rating and very strong Piotroski score suggest a solid financial profile with manageable risks.
Strength & Efficiency Pillars
Baker Hughes Company demonstrates solid profitability with a net margin of 9.59% and a return on equity of 12.31%. Its return on invested capital (ROIC) stands at a favorable 11.01%, comfortably above the weighted average cost of capital (WACC) at 7.32%, confirming it as a clear value creator. The Piotroski score of 8 indicates very strong financial health, while the Altman Z-score of 2.86 places the company in the grey zone, suggesting moderate financial risk but no immediate distress. Efficient capital allocation is further supported by a low debt-to-equity ratio of 0.28.
Weaknesses and Drawbacks
The company faces moderate valuation risks with a price-to-earnings ratio of 16.91 and a price-to-book ratio of 2.08, signaling a modest premium relative to historical industry averages. Liquidity metrics like a current ratio of 1.36 and a quick ratio of 1.0 are neutral but warrant monitoring for short-term obligations. Although leverage remains favorable, the slight decline in revenue by 0.34% over the last year and a 10.4% drop in net margin growth introduce headwinds. These factors could pressure short-term market sentiment despite strong buyer dominance.
Our Verdict about Baker Hughes Company
Baker Hughes Company’s long-term fundamental profile appears favorable, supported by strong value creation and robust financial health. The bullish overall trend, coupled with recent strongly buyer-dominant market behavior, suggests the stock may appear attractive for long-term exposure. However, investors should remain cautious of recent margin contractions and valuation premiums, which might suggest a measured entry approach.
Disclaimer: This content is for informational purposes only and does not constitute financial, investment, or other professional advice. Investing in financial markets involves a significant risk of loss, and past performance is not indicative of future results.
Additional Resources
- Baker Hughes to become Marathon’s preferred provider of downstream chemicals (BKR:NASDAQ) – Seeking Alpha (Feb 05, 2026)
- Baker Hughes Expands LNG And Low Carbon Projects In Energy Transition – simplywall.st (Feb 05, 2026)
- Baker Hughes to Provide Downstream Chemicals for Marathon Petroleum Refineries, Becoming Preferred Provider Across North America – Yahoo Finance Singapore (Feb 05, 2026)
- National Pension Service Increases Stock Position in Baker Hughes Company $BKR – MarketBeat (Feb 02, 2026)
- Analysts Offer Insights on Energy Companies: Exxon Mobil (XOM) and Baker Hughes Company (BKR) – The Globe and Mail (Feb 03, 2026)
For more information about Baker Hughes Company, please visit the official website: bakerhughes.com