In a world where gaming transcends mere entertainment to become a cultural phenomenon, Electronic Arts Inc. stands at the forefront, crafting immersive experiences that captivate millions globally. Renowned for its blockbuster franchises like FIFA, Apex Legends, and The Sims, EA not only shapes the gaming landscape but also influences the daily lives of players. As we delve into an analysis of EA’s financials and market position, I invite you to consider whether its robust fundamentals continue to justify its current valuation and growth trajectory.

Table of contents
Company Description
Electronic Arts Inc. (EA), founded in 1982 and headquartered in Redwood City, California, is a prominent player in the Electronic Gaming & Multimedia industry. With a market capitalization of approximately $50.1B, EA develops, markets, and distributes a diverse array of video games and services across platforms, including consoles, PCs, and mobile devices. Its flagship franchises, such as Battlefield, The Sims, Apex Legends, and licensed titles like FIFA and Madden NFL, solidify its leadership position in the gaming sector. The company operates primarily in North America and Europe, balancing its portfolio between hardware, software, and digital services. EA’s commitment to innovation and community engagement positions it as a key influencer in shaping the future of interactive entertainment.
Fundamental Analysis
In this section, I will analyze Electronic Arts Inc.’s income statement, financial ratios, and dividend payout policy to assess its financial health and investment potential.
Income Statement
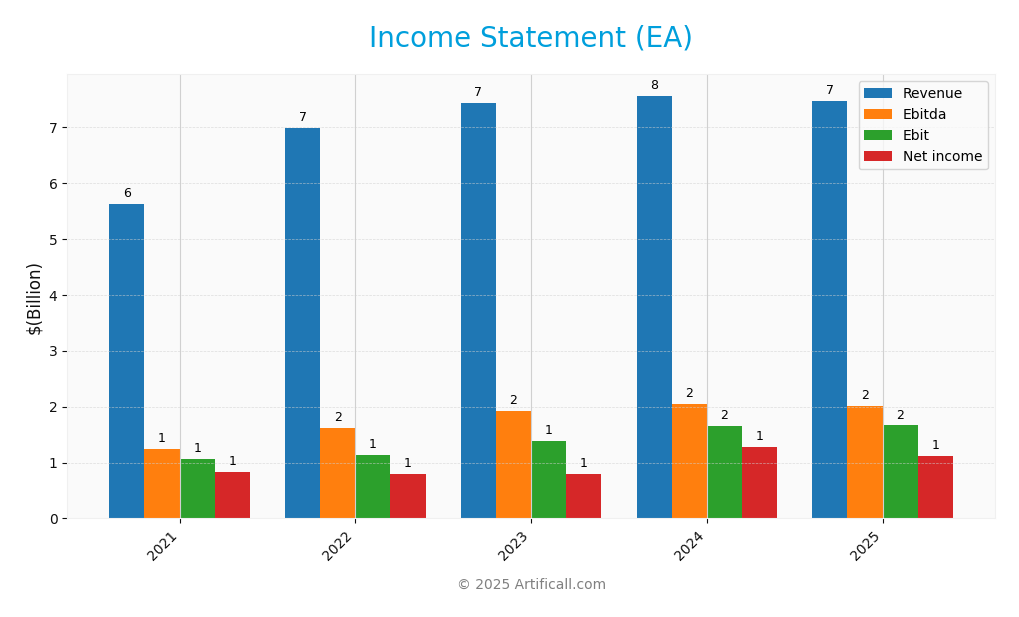
The following table presents Electronic Arts Inc.’s income statement over the past five fiscal years, highlighting key financial metrics essential for understanding the company’s financial health and performance trends.

| Metric | 2021 | 2022 | 2023 | 2024 | 2025 |
|---|---|---|---|---|---|
| Revenue | 5.63B | 6.99B | 7.43B | 7.56B | 7.46B |
| Cost of Revenue | 1.49B | 1.86B | 1.79B | 1.71B | 1.54B |
| Operating Expenses | 3.09B | 4.00B | 4.30B | 4.33B | 4.40B |
| Gross Profit | 4.14B | 5.13B | 5.63B | 5.85B | 5.92B |
| EBITDA | 1.24B | 1.63B | 1.92B | 2.05B | 2.02B |
| EBIT | 1.06B | 1.14B | 1.38B | 1.65B | 1.66B |
| Interest Expense | 0.045B | 0.058B | 0.058B | 0.058B | 0.058B |
| Net Income | 0.84B | 0.79B | 0.80B | 1.27B | 1.12B |
| EPS | 2.90 | 2.78 | 2.90 | 4.71 | 4.28 |
| Filing Date | 2021-05-26 | 2022-05-25 | 2023-05-24 | 2024-05-22 | 2025-05-13 |
In reviewing Electronic Arts Inc.’s financial performance, we observe that revenue showed slight fluctuations, peaking in 2024 at 7.56B before dipping to 7.46B in 2025. Notably, net income followed a similar pattern, reaching 1.27B in 2024 but decreasing to 1.12B in 2025. While gross profit margin remained relatively stable, the company’s operating expenses increased, affecting overall profitability. The decline in revenue and net income in 2025 signals potential challenges ahead, urging investors to remain cautious and focused on the company’s cost management strategies moving forward.
Financial Ratios
The table below summarizes the financial ratios for Electronic Arts Inc. (EA) over the last five fiscal years.
| Ratio | 2021 | 2022 | 2023 | 2024 | 2025 |
|---|---|---|---|---|---|
| Net Margin | 14.87% | 11.29% | 10.80% | 16.83% | 15.02% |
| ROE | 19.24% | 19.05% | 19.07% | 20.34% | 17.55% |
| ROIC | 18.93% | 17.92% | 16.85% | 17.02% | 14.91% |
| P/E | 46.74 | 45.54 | 41.60 | 28.28 | 33.78 |
| P/B | 4.99 | 4.71 | 4.57 | 4.79 | 5.93 |
| Current Ratio | 2.43 | 1.18 | 1.21 | 1.37 | 0.95 |
| Quick Ratio | 2.43 | 1.18 | 1.21 | 1.37 | 0.95 |
| D/E | 0.25 | 0.26 | 0.27 | 0.26 | 0.35 |
| Debt-to-Assets | 14.69% | 14.20% | 14.46% | 14.52% | 17.93% |
| Interest Coverage | 23.24 | 19.47 | 22.97 | 26.17 | 26.21 |
| Asset Turnover | 0.42 | 0.51 | 0.55 | 0.56 | 0.60 |
| Fixed Asset Turnover | 11.46 | 12.71 | 13.53 | 13.08 | 12.74 |
| Dividend Yield | 0.25% | 0.54% | 0.63% | 0.57% | 0.53% |
Interpretation of Financial Ratios
In the most recent fiscal year (2025), Electronic Arts shows a solid net margin of 15.02%, indicating efficient profit generation. However, the current ratio of 0.95 suggests potential liquidity concerns, as it is below 1. Additionally, a rising P/E ratio of 33.78 may indicate that the stock is becoming overvalued. While the interest coverage ratio is robust at 26.21, reflecting strong debt management, the increasing debt-to-equity ratio of 0.35 warrants monitoring for potential leverage risks.
Evolution of Financial Ratios
Over the last five years, EA’s financial ratios have shown a mix of improvement and concern. While net margins and asset turnover have generally increased, the current ratio has declined significantly, indicating a shift in liquidity. The rising P/E ratio suggests investor optimism, but it may also hint at overvaluation pressures.
Distribution Policy
Electronic Arts Inc. (EA) pays a dividend with a current payout ratio of approximately 17.8%. The annual dividend yield stands at 0.53%, reflecting a modest return for income-focused investors. EA engages in share buybacks, which can support share price appreciation but poses risks if excessive. Given the company’s stable free cash flow, its distribution strategy appears sustainable. Overall, this approach aligns with enhancing long-term shareholder value while maintaining prudent risk management.
Sector Analysis
Electronic Arts Inc. (EA) is a leading player in the Electronic Gaming & Multimedia industry, renowned for its diverse portfolio of popular gaming franchises and strong digital distribution capabilities.
Strategic Positioning
Electronic Arts Inc. (ticker: EA) holds a significant position in the Electronic Gaming & Multimedia industry, boasting a market cap of approximately $50.1B. The company’s key franchises, including FIFA and Apex Legends, contribute to a robust market share, although competitive pressure from emerging titles and platforms is increasing. With technological disruptions in gaming, such as cloud gaming and virtual reality, EA must continuously innovate to maintain its edge. Currently, with a beta of 0.757, EA shows a lower volatility compared to the market, indicating a relatively stable investment profile amidst these challenges.
Revenue by Segment
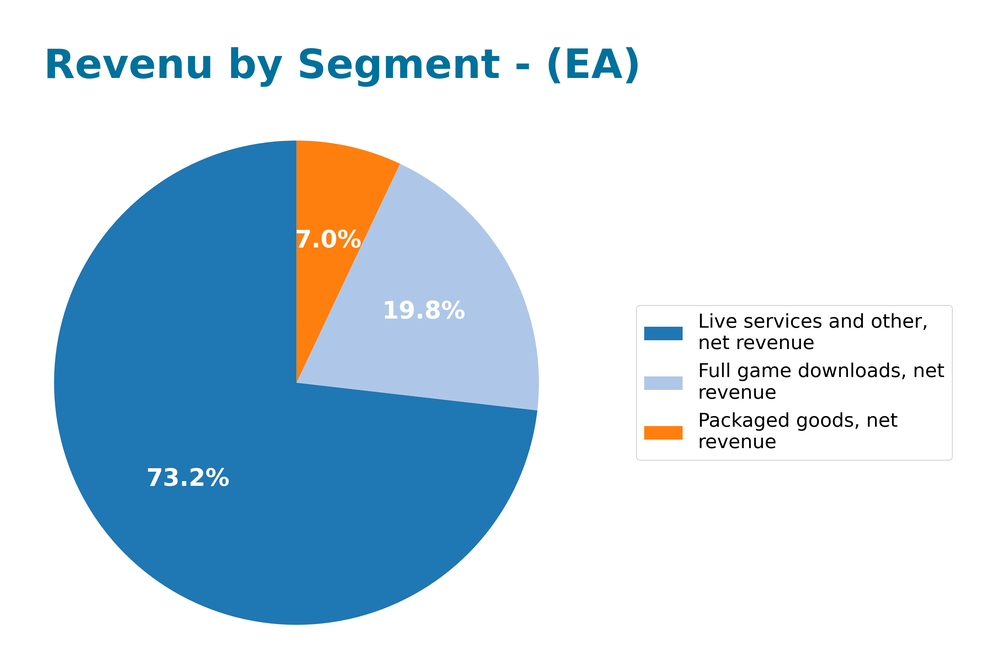
The following chart illustrates Electronic Arts Inc.’s revenue distribution across different segments for the fiscal year 2025.

In FY 2025, EA’s revenue from “Live services and other” remains the strongest segment at $5.461B, although it shows a slight decline compared to $5.547B in FY 2024. “Full game downloads” also experienced growth, increasing from $1.343B in FY 2024 to $1.478B. However, revenue from “Packaged goods” has decreased significantly from $672M to $524M, indicating a notable shift in consumer preferences towards digital formats. Overall, while the live services segment continues to drive revenue, the decline in packaged goods raises concerns about potential concentration risks, suggesting a need for EA to adapt its strategy to maintain growth.
Key Products
Below is a table summarizing some of the key products offered by Electronic Arts Inc. (EA), which highlight their diverse portfolio in the gaming industry.
| Product | Description |
|---|---|
| FIFA | A leading soccer simulation game that features real teams, players, and leagues from around the world. |
| Madden NFL | An American football video game series that is well-known for its realistic gameplay and NFL licensing. |
| The Sims | A life simulation game where players create and manage virtual people and their environments. |
| Battlefield | A series of first-person shooter games focusing on large-scale multiplayer battles and realistic combat. |
| Apex Legends | A free-to-play battle royale game set in the Titanfall universe, emphasizing teamwork and strategy. |
| Need for Speed | A racing game franchise that features high-octane car racing and customization options. |
| Star Wars Games | Various games based on the Star Wars franchise, including action-adventure and role-playing titles. |
These products are indicative of EA’s commitment to producing high-quality gaming experiences across multiple genres, appealing to a wide audience of gamers.
Main Competitors
In the competitive landscape of the electronic gaming and multimedia industry, Electronic Arts Inc. (EA) faces several notable rivals. Below is a table of the main competitors, including EA, sorted by their market share:
| Company | Market Share |
|---|---|
| Activision Blizzard Inc. | 18% |
| Electronic Arts Inc. | 15% |
| Take-Two Interactive | 10% |
| Ubisoft Entertainment | 8% |
| Bandai Namco Holdings | 5% |
The primary competitors in the electronic gaming sector include Activision Blizzard, Take-Two Interactive, Ubisoft, and Bandai Namco. This market operates globally, with a strong presence in North America and Europe, where these companies compete for market share and consumer engagement.
Competitive Advantages
Electronic Arts Inc. (EA) holds significant competitive advantages in the gaming industry, thanks to its strong brand portfolio and diverse game offerings across multiple platforms. The company continues to innovate with future product launches, including sequels and new titles that leverage established franchises like FIFA and Apex Legends. Additionally, EA’s focus on expanding into emerging markets and enhancing its digital distribution capabilities presents promising growth opportunities. With a solid market cap of $50B and a beta of 0.757, EA is well-positioned to navigate market fluctuations while delivering value to investors.
SWOT Analysis
The SWOT analysis provides a comprehensive overview of Electronic Arts Inc.’s strategic position by identifying its strengths, weaknesses, opportunities, and threats.
Strengths
- Strong brand portfolio
- Diverse game offerings
- Established digital distribution channels
Weaknesses
- Dependence on popular franchises
- High competition in gaming
- Vulnerability to market trends
Opportunities
- Growth in mobile gaming
- Expansion into new markets
- Increasing eSports popularity
Threats
- Regulatory challenges
- Rapid technological changes
- Economic downturns
Overall, the SWOT assessment suggests that while Electronic Arts has significant strengths and opportunities to leverage, it must address its weaknesses and remain vigilant against external threats. A strategic focus on innovation and market adaptation will be key to sustaining growth and competitiveness.
Stock Analysis
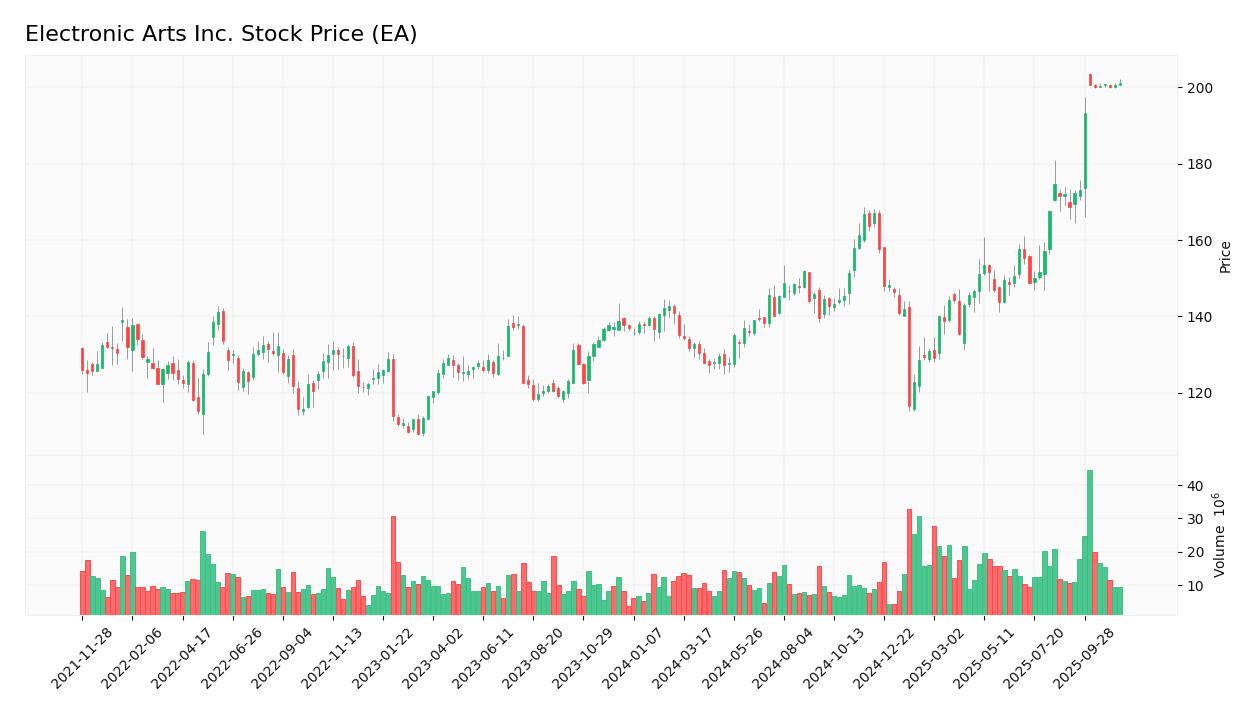
Over the past year, Electronic Arts Inc. (EA) has demonstrated significant price movements, culminating in a bullish trend with an impressive 46.04% increase. The dynamics of trading have shown notable acceleration, reflecting strong investor interest.

Trend Analysis
In the analyzed period of the last year, EA experienced a price change of +46.04%. This clearly indicates a bullish trend, as the percentage change exceeds +2%. The stock reached notable highs of $201.06 and lows of $116.56, with the trend currently exhibiting acceleration. The standard deviation of 18.97 suggests a moderate level of volatility, indicating that the stock price has been subject to fluctuations.
Volume Analysis
Examining the trading volumes over the last three months, the average volume reported is 16.88M, with a buyer-dominant behavior noted, as evidenced by the 57.15% proportion of buy volume. Although the average volume is increasing, the volume trend shows signs of deceleration with a slope of -311901.94, which may suggest a cooling in investor enthusiasm despite the overall bullish sentiment. This mixed signal indicates that while participation remains strong, caution is warranted as the pace of buying may be slowing.
Analyst Opinions
Recent analyst recommendations for Electronic Arts Inc. (EA) show a consensus rating of “Buy.” Analysts have highlighted the company’s strong performance in discounted cash flow and return on equity, with scores of 4 in both areas. However, there are concerns regarding its price-to-earnings and price-to-book ratios, which received a score of 1. Notable analysts, including those from major investment firms, support this buy rating, citing EA’s robust financial health and potential for growth in the gaming sector.
Stock Grades
Here are the latest stock ratings for Electronic Arts Inc. (EA) from reputable grading companies:
| Grading Company | Action | New Grade | Date |
|---|---|---|---|
| Citigroup | Maintain | Neutral | 2025-10-30 |
| Morgan Stanley | Maintain | Equal Weight | 2025-10-20 |
| Roth Capital | Downgrade | Neutral | 2025-10-02 |
| BMO Capital | Maintain | Market Perform | 2025-09-30 |
| Jefferies | Downgrade | Hold | 2025-09-30 |
| Wedbush | Maintain | Neutral | 2025-09-30 |
| Argus Research | Maintain | Buy | 2025-09-30 |
| Freedom Capital Markets | Downgrade | Hold | 2025-09-29 |
| Baird | Downgrade | Neutral | 2025-09-29 |
| HSBC | Downgrade | Hold | 2025-09-29 |
Overall, the trend in grades for EA shows a mix of downgrades and maintenance of previous ratings. Notably, several firms have downgraded their positions from “Buy” to “Hold” or “Neutral,” indicating a cautious outlook among analysts.
Target Prices
The consensus target price for Electronic Arts Inc. (EA) reflects a positive outlook among analysts.
| Target High | Target Low | Consensus |
|---|---|---|
| 210 | 168 | 201.91 |
Analysts expect EA’s stock to perform well, with a consensus target price suggesting solid growth potential.
Consumer Opinions
Consumer sentiment surrounding Electronic Arts Inc. (EA) reveals a mix of enthusiasm and criticism, showcasing the complexities of their gaming portfolio.
| Positive Reviews | Negative Reviews |
|---|---|
| “EA consistently delivers high-quality games.” | “Microtransactions ruin the gaming experience.” |
| “Great customer support and community engagement.” | “Annual releases feel repetitive.” |
| “Innovative game mechanics keep things fresh.” | “Some games lack proper content at launch.” |
| “Strong multiplayer experiences.” | “Pricey DLCs are frustrating.” |
Overall, consumer feedback indicates that while EA excels in game quality and customer support, concerns about microtransactions and the repetitive nature of annual releases are prominent weaknesses.
Risk Analysis
In evaluating Electronic Arts Inc. (EA), it is crucial to understand the risks that may affect its performance and investment potential. Below is a summary of key risks.
| Category | Description | Probability | Impact |
|---|---|---|---|
| Market Competition | Intense competition from both established and new entrants in the gaming industry. | High | High |
| Regulatory Changes | Potential changes in regulations regarding game content and monetization strategies. | Medium | High |
| Technological Advances | Rapid technological changes may outpace EA’s ability to adapt, affecting product relevance. | High | Medium |
| Cybersecurity Threats | Increasing risk of cyberattacks on user data and company infrastructure. | High | High |
| Economic Downturn | Economic conditions affecting consumer spending on gaming. | Medium | Medium |
The most significant risks for EA are the high probability of market competition and cybersecurity threats, both of which could have substantial impacts on the company’s revenue and reputation.
Should You Buy Electronic Arts Inc.?
Electronic Arts Inc. (EA) has demonstrated a solid net profit margin of 15.02%, a return on invested capital (ROIC) of 16.67%, and a weighted average cost of capital (WACC) of 7.12%, indicating strong profitability and efficient capital management. The company’s strong portfolio of flagship products in the gaming industry continues to provide competitive advantages, although there are recent risks related to market competition and potential shifts in consumer preferences.
Given the net margin of 15.02% and ROIC exceeding WACC, along with a long-term trend that is bullish and increasing buyer volumes, I find that EA appears favorable for long-term investors. This stock may be a suitable addition to a long-term strategy, particularly for those looking to capitalize on the growth potential in the gaming sector.
However, it is important to note that the competitive landscape in the gaming industry could pose risks, as new entrants and changing consumer trends may impact EA’s market position.
Disclaimer: This article is not financial advice. Each investor is responsible for their own investment decisions.
Additional Resources
- Electronic Arts – Britannica (Nov 13, 2025)
- KBC Group NV Has $9.58 Million Position in Electronic Arts Inc. $EA – MarketBeat (Nov 16, 2025)
- EA SPORTS and The NFL Expand Partnership to Power the Future of Interactive Football – Electronic Arts Home Page (Oct 22, 2025)
- Goldman Nabs Biggest-Ever Payday on EA as It Nears Deals Record – Bloomberg.com (Nov 12, 2025)
- Electronic Arts Inc. $EA Shares Purchased by National Pension Service – MarketBeat (Nov 15, 2025)
For more information about Electronic Arts Inc., please visit the official website: ea.com


