PACCAR Inc is not just a manufacturer; it’s a cornerstone of the global transportation industry, impacting how goods traverse the world. Renowned for its innovative designs and high-quality trucks under the Kenworth, Peterbilt, and DAF brands, PACCAR has established a strong reputation in the commercial vehicle sector. As we delve into this analysis, I invite you to consider whether PACCAR’s robust fundamentals and market presence still justify its current valuation and growth trajectory.

Table of contents
Company Description
PACCAR Inc, founded in 1905 and headquartered in Bellevue, Washington, is a prominent player in the agricultural machinery industry, specializing in the design, manufacture, and distribution of light, medium, and heavy-duty commercial trucks. The company operates through three main segments: Truck, Parts, and Financial Services, offering a comprehensive range of products and services under the Kenworth, Peterbilt, and DAF nameplates. With a global presence spanning the United States, Europe, Mexico, South America, and Australia, PACCAR also provides after-market parts and financial solutions, including leasing and equipment financing. As an industry leader, PACCAR is recognized for its commitment to innovation and operational excellence, shaping the future of commercial transportation.
Fundamental Analysis
In this section, I will provide a fundamental analysis of PACCAR Inc, focusing on its income statement, financial ratios, and dividend payout policy.
Income Statement
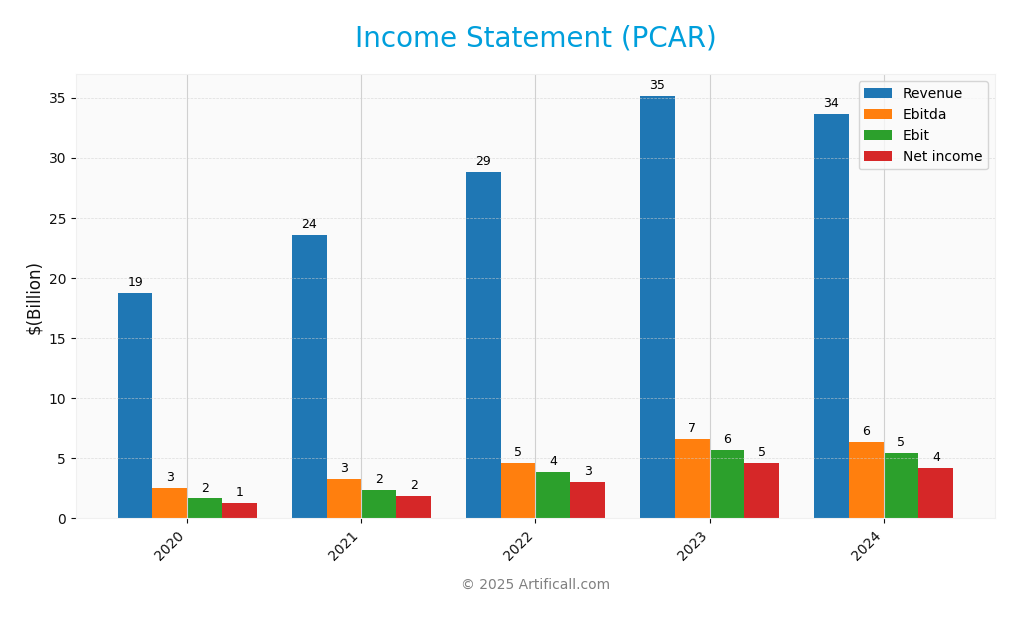
The following table summarizes the income statement for PACCAR Inc (PCAR) over the last five fiscal years, showcasing key financial metrics.

| Metric | 2020 | 2021 | 2022 | 2023 | 2024 |
|---|---|---|---|---|---|
| Revenue | 18.72B | 23.54B | 28.84B | 35.16B | 33.65B |
| Cost of Revenue | 16.18B | 20.26B | 24.09B | 27.91B | 27.28B |
| Operating Expenses | 0.88B | 1.00B | 1.07B | 1.20B | 1.27B |
| Gross Profit | 2.54B | 3.83B | 4.74B | 7.25B | 6.37B |
| EBITDA | 2.56B | 3.27B | 4.65B | 6.63B | 6.35B |
| EBIT | 1.66B | 2.40B | 3.84B | 5.72B | 5.43B |
| Interest Expense | 0.00B | 0.01B | 0.00B | 0.01B | 0.03B |
| Net Income | 1.30B | 1.87B | 3.01B | 4.60B | 4.16B |
| EPS | 2.50 | 3.58 | 5.76 | 8.78 | 7.92 |
| Filing Date | 2021-02-17 | 2022-02-23 | 2023-02-22 | 2024-02-21 | 2025-02-19 |
Over the five-year period, PACCAR’s revenue peaked in 2023 at 35.16B, reflecting robust demand, but dropped to 33.65B in 2024, indicating a slight contraction. Net income trends show a similar pattern, with a high of 4.60B in 2023 and a decline to 4.16B in 2024. Gross margins fluctuated, with the most recent year seeing a decrease in profitability, primarily due to rising operating costs and a dip in revenue. This signals potential caution for investors as the company navigates these challenges while maintaining a strong market position.
Financial Ratios
The following table summarizes the key financial ratios for PACCAR Inc (PCAR) over the last five fiscal years.
| Ratios | 2020 | 2021 | 2022 | 2023 | 2024 |
|---|---|---|---|---|---|
| Net Margin | 6.95% | 7.93% | 10.44% | 13.09% | 12.37% |
| ROE | 14.82% | 13.56% | 15.04% | 21.59% | 20.50% |
| ROIC | 10.71% | 10.42% | 12.76% | 14.30% | 14.15% |
| P/E | 22.99 | 16.46 | 11.45 | 11.12 | 13.13 |
| P/B | 2.87 | 2.65 | 2.62 | 3.22 | 3.12 |
| Current Ratio | 2.69 | 2.62 | 2.60 | 2.50 | 2.64 |
| Quick Ratio | 2.52 | 2.37 | 2.37 | 2.30 | 2.45 |
| D/E | 1.09 | 0.93 | 0.89 | 0.91 | 0.91 |
| Debt-to-Assets | 40.02% | 36.47% | 35.10% | 35.22% | 36.61% |
| Interest Coverage | 0.00 | 556.56 | 0.00 | 1187.39 | 164.05 |
| Asset Turnover | 0.66 | 0.80 | 0.87 | 0.86 | 0.78 |
| Fixed Asset Turnover | 2.73 | 3.57 | 4.60 | 5.78 | 5.66 |
| Dividend Yield | 4.14% | 2.31% | 2.91% | 2.97% | 4.19% |
Interpretation of Financial Ratios
In the most recent year, PACCAR’s ratios demonstrate strong profitability with a net margin of 12.37% and a solid return on equity (ROE) of 20.50%. The interest coverage ratio of 164.05 indicates excellent ability to meet interest obligations, though the D/E ratio of 0.91 suggests a moderately leveraged position. My concern lies with the slightly declining net margin compared to the previous year, which could indicate pressure on profitability.
Evolution of Financial Ratios
Over the past five years, PACCAR’s financial ratios exhibit an overall positive trend in profitability and efficiency, with significant improvements in net margin and ROE. However, there are signs of potential stabilization or slight decline in some ratios, such as net margin and asset turnover, suggesting a need for cautious monitoring moving forward.
Distribution Policy
PACCAR Inc (PCAR) maintains a dividend payout ratio of approximately 33% and a dividend yield of around 2.97%. The company has steadily increased its dividend per share, demonstrating a commitment to returning value to shareholders. Additionally, PACCAR engages in share buyback programs, further enhancing shareholder value. While its current distribution strategy appears sustainable, investors should remain cautious of potential risks, including economic downturns that may impact cash flow. Overall, PACCAR’s approach supports long-term value creation for shareholders.
Sector Analysis
PACCAR Inc operates in the agricultural machinery industry, specializing in manufacturing commercial trucks and providing financial services, with a strong position against competitors like Volvo and Daimler.
Strategic Positioning
PACCAR Inc (PCAR) holds a significant position in the commercial truck manufacturing market, with a market cap of approximately $50.2B. The company operates through three segments: Truck, Parts, and Financial Services, leveraging its strong brand recognition with Kenworth, Peterbilt, and DAF. With an average volume of 2.9M shares traded, PACCAR faces competitive pressure from other major players in the industry. Technological disruption, particularly in electric and autonomous vehicles, poses both challenges and opportunities, necessitating continuous innovation to maintain its market share.
Revenue by Segment
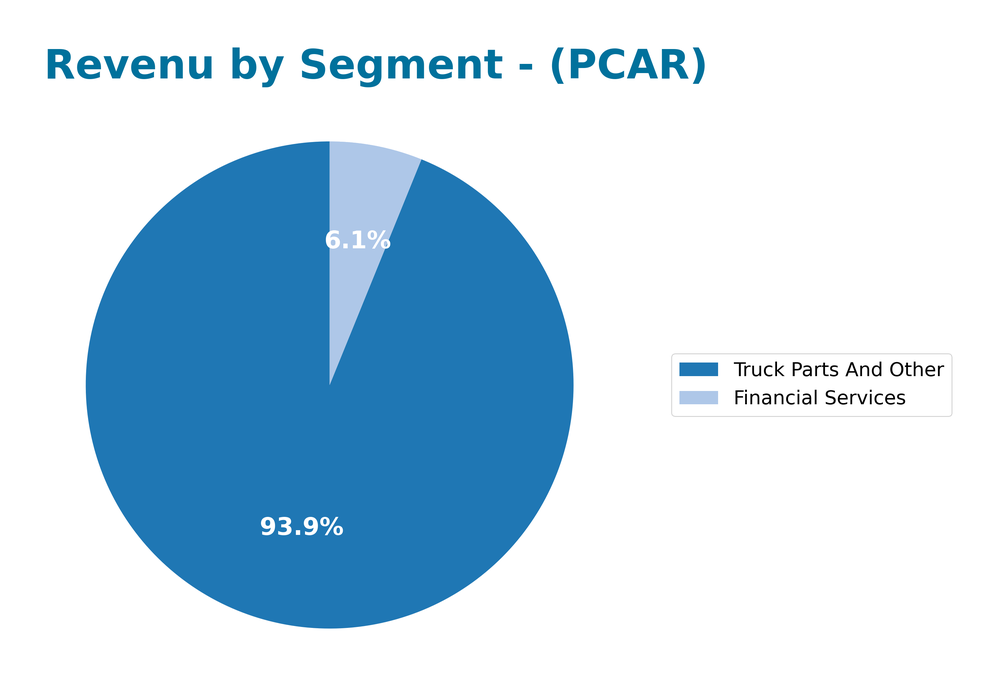
The following chart illustrates PACCAR Inc’s revenue distribution across its segments for the fiscal year ending December 31, 2024.

In 2024, PACCAR’s revenue from “Truck Parts And Other” reached 32.1B, while “Financial Services” contributed 2.1B. The Truck Parts segment remains the dominant revenue driver, despite a decrease from 33.3B in 2023, highlighting a potential slowing trend. Meanwhile, the Financial Services segment showed steady growth, indicating a diversification strategy. Overall, while the company continues to face margin pressures in the truck segment, the resilience of its financial services offers a buffer against potential downturns.
Key Products
Below is a table summarizing the key products offered by PACCAR Inc, which plays a significant role in the commercial truck industry.
| Product | Description |
|---|---|
| Kenworth Trucks | Heavy-duty trucks known for their durability and performance, catering to the over-the-road hauling needs. |
| Peterbilt Trucks | A premium brand offering a range of medium to heavy-duty trucks, recognized for their innovative design and comfort. |
| DAF Trucks | European brand specializing in commercial vehicle solutions, known for fuel efficiency and sustainability. |
| Aftermarket Parts | Comprehensive range of aftermarket parts for trucks and related commercial vehicles, ensuring optimal performance and compliance. |
| PacLease Services | Full-service leasing and financing options for commercial trucking companies, enhancing operational flexibility. |
| Industrial Winches | Winches manufactured under the Braden, Carco, and Gearmatic names, catering to various heavy-duty applications. |
These products reflect PACCAR’s commitment to quality and innovation in the commercial vehicle sector, providing solutions that meet diverse customer needs across the globe.
Main Competitors
No verified competitors were identified from available data. However, PACCAR Inc (ticker: PCAR) operates within the agricultural machinery sector and has an estimated market share of approximately 5% in the commercial truck manufacturing industry. The company holds a competitive position through its established brands, such as Kenworth, Peterbilt, and DAF, and continues to maintain a strong presence in North America, Europe, and other international markets.
Competitive Advantages
PACCAR Inc. boasts a strong competitive edge through its established brand presence with Kenworth, Peterbilt, and DAF trucks, which are recognized for quality and reliability. The company’s commitment to innovation positions it well for future growth, particularly with the expansion into electric and autonomous vehicle markets. Additionally, PACCAR’s robust financial services segment enhances customer loyalty, providing tailored leasing and financing solutions. The outlook is promising, with opportunities in emerging markets and advancements in technology likely to drive revenue growth and market share in the coming years.
SWOT Analysis
The SWOT analysis aims to provide a clear overview of PACCAR Inc’s current strategic position.
Strengths
- Strong brand reputation
- Diverse product range
- Global market presence
Weaknesses
- Dependence on cyclical markets
- High manufacturing costs
- Limited diversification outside trucks
Opportunities
- Growth in e-commerce logistics
- Increasing demand for electric trucks
- Expansion into emerging markets
Threats
- Economic downturns
- Intense competition
- Regulatory changes in emissions standards
Overall, PACCAR Inc’s strengths and opportunities suggest a solid foundation for growth, but the company must remain vigilant about its weaknesses and external threats to maintain its market position and drive future success.
Stock Analysis
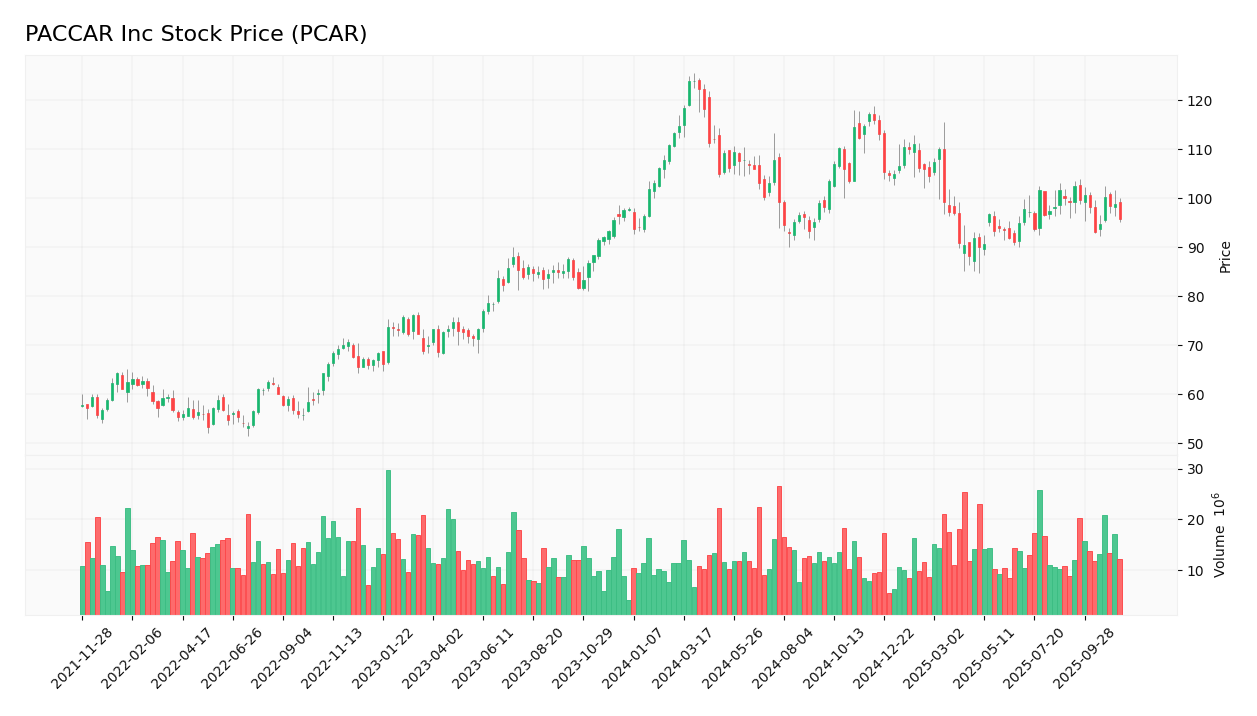
PACCAR Inc (PCAR) has experienced notable price movements over the past year, reflecting a bearish sentiment that has emerged in its trading dynamics. The stock price has fluctuated significantly, with highs and lows that illustrate the market’s response to broader economic conditions.

Trend Analysis
Over the past two years, PACCAR’s stock has seen a percentage change of -1.93%. This indicates a bearish trend, as the decline exceeds the -2% threshold. The trend is characterized by a deceleration, suggesting that while prices have been falling, the rate of decline is slowing. The stock reached a notable high of 123.89 and a low of 88.17, which further emphasizes the volatility with a standard deviation of 8.13.
Volume Analysis
Analyzing the trading volumes over the last three months, the average volume has increased to approximately 14.15M shares, indicating heightened market participation. Despite this increase, the activity appears seller-driven, as sellers have outpaced buyers, with an average sell volume of 7.58M compared to an average buy volume of 6.58M. This suggests a cautious investor sentiment, with a notable trend slope indicating acceleration in selling activity.
Analyst Opinions
Recent analyst recommendations for PACCAR Inc (PCAR) indicate a consensus rating of “Buy” for the current year. Analysts have highlighted the company’s strong financial health, reflected in its robust return on assets (score of 5) and solid return on equity (score of 4). Notably, the A- rating from analysts showcases confidence in PACCAR’s growth potential. The company’s low debt-to-equity ratio (score of 1) also adds to its appeal, suggesting strong risk management. Overall, the positive sentiment from analysts positions PACCAR as a favorable investment choice.
Stock Grades
PACCAR Inc (PCAR) has received various stock ratings from reputable grading companies, reflecting a mix of sentiments in the market. Below is a summary of the most recent grades:
| Grading Company | Action | New Grade | Date |
|---|---|---|---|
| Wolfe Research | Upgrade | Peer Perform | 2025-10-22 |
| Truist Securities | Maintain | Hold | 2025-10-22 |
| JP Morgan | Maintain | Neutral | 2025-10-22 |
| UBS | Maintain | Neutral | 2025-10-22 |
| JP Morgan | Maintain | Neutral | 2025-10-14 |
| Truist Securities | Maintain | Hold | 2025-10-08 |
| JP Morgan | Maintain | Neutral | 2025-07-23 |
| Truist Securities | Maintain | Hold | 2025-07-23 |
| UBS | Upgrade | Neutral | 2025-07-23 |
| Citigroup | Maintain | Neutral | 2025-06-24 |
Overall, the recent trend shows a slight upgrade from Wolfe Research, moving from “Underperform” to “Peer Perform.” However, most of the grades remain stable, with several companies maintaining their previous ratings. This suggests a cautious but steady sentiment among analysts regarding PACCAR’s market position.
Target Prices
The current consensus among analysts indicates a positive outlook for PACCAR Inc (PCAR).
| Target High | Target Low | Consensus |
|---|---|---|
| 114 | 86 | 99.57 |
Analysts expect PACCAR to reach a consensus target price of approximately 99.57, with a range between 86 and 114. This suggests a cautiously optimistic sentiment towards the stock’s future performance.
Consumer Opinions
Consumer sentiment surrounding PACCAR Inc (PCAR) reveals a mixture of satisfaction and areas needing improvement.
| Positive Reviews | Negative Reviews |
|---|---|
| “Excellent build quality of trucks.” | “Customer service can be slow to respond.” |
| “Innovative technology in their vehicles.” | “High maintenance costs for older models.” |
| “Reliable performance on the road.” | “Limited dealer network in rural areas.” |
Overall, consumer feedback highlights PACCAR’s strong build quality and innovative technology, while concerns about customer service and maintenance costs are common weaknesses.
Risk Analysis
In order to make informed investment decisions regarding PACCAR Inc (PCAR), it is essential to understand the various risks that could impact the company’s performance. Below is a summary of key risks.
| Category | Description | Probability | Impact |
|---|---|---|---|
| Market Risk | Fluctuations in demand for trucks due to economic cycles | High | High |
| Supply Chain Risk | Disruptions in supply chain can delay production | Medium | High |
| Regulatory Risk | Changes in environmental regulations affecting production | Medium | Medium |
| Competition Risk | Increased competition from electric vehicle manufacturers | High | Medium |
| Currency Risk | Exchange rate volatility impacting international sales | Medium | Low |
Recent trends indicate a significant shift toward electric vehicles, which poses high competition risk for traditional truck manufacturers like PACCAR. Monitoring these risks is crucial for effective risk management and investment strategy.
Should You Buy PACCAR Inc?
PACCAR Inc has a net profit margin of 12.37%, a return on invested capital (ROIC) of 7.9%, and a weighted average cost of capital (WACC) of 7.22%. The company benefits from strong brand recognition and a robust supply chain but faces challenges from increasing competition and potential economic downturns.
Given that PACCAR’s net margin is greater than zero and its ROIC exceeds the WACC, alongside a positive long-term trend despite recent seller volumes, this situation appears favorable for long-term investors. However, since buyer volumes are currently lower, it may be prudent to wait for clearer signs of demand strength before making an addition to your portfolio.
Specific risks include heightened competition in the commercial vehicle market and potential supply chain disruptions that could impact profitability.
Disclaimer: This article is not financial advice. Each investor is responsible for their own investment decisions.
Additional Resources
- Massachusetts Financial Services Co. MA Decreases Stake in PACCAR Inc. $PCAR – MarketBeat (Nov 16, 2025)
- PACCAR Inc. $PCAR Stock Position Reduced by Mitsubishi UFJ Trust & Banking Corp – MarketBeat (Nov 16, 2025)
- PACCAR Inc (PCAR) Q3 2025 Earnings Call Highlights: Record Parts Revenue and Strategic … – Yahoo Finance (Oct 21, 2025)
- ABN Amro Investment Solutions Makes New Investment in PACCAR Inc. $PCAR – MarketBeat (Nov 16, 2025)
- PACCAR (PCAR): Assessing Valuation Potential After Recent Share Price Fluctuations – Yahoo Finance (Nov 12, 2025)
For more information about PACCAR Inc, please visit the official website: paccar.com


