Home > Analyses > Consumer Cyclical > Airbnb, Inc.
Airbnb transforms how millions experience travel by turning ordinary homes into unique destinations. It dominates the travel services sector with its peer-to-peer marketplace, connecting hosts and guests worldwide. Renowned for innovation and a seamless user experience, Airbnb reshapes lodging beyond traditional hotels. As market dynamics evolve, I ask: do Airbnb’s fundamentals still support its lofty valuation and growth ambitions in a competitive, cyclical industry?

Table of contents
Business Model & Company Overview
Airbnb, Inc., founded in 2007 and headquartered in San Francisco, CA, dominates the travel services sector with a global platform connecting hosts and guests. Its ecosystem offers private rooms, primary homes, and vacation rentals, creating a seamless marketplace for stays and experiences. This core mission unites diverse offerings under one digital roof, driving its position as an industry leader.
The company’s revenue engine balances transaction-based income from bookings with scalable tech infrastructure supporting millions of users. Airbnb operates across the Americas, Europe, and Asia, leveraging mobile and online channels to expand reach. Its competitive advantage lies in network effects and brand recognition, establishing a durable economic moat that shapes the future of travel hospitality.
Financial Performance & Fundamental Metrics
I will analyze Airbnb, Inc.’s income statement, key financial ratios, and dividend payout policy to assess its core financial health and shareholder value creation.
Income Statement
The table below summarizes Airbnb, Inc.’s key income statement metrics for fiscal years 2021 through 2025, highlighting revenue growth and profitability trends.

| 2021 | 2022 | 2023 | 2024 | 2025 | |
|---|---|---|---|---|---|
| Revenue | 6B | 8.4B | 9.9B | 11B | 12.2B |
| Cost of Revenue | 1.2B | 1.5B | 1.7B | 1.9B | 2.1B |
| Operating Expenses | 4.4B | 5.1B | 6.7B | 6.7B | 7.6B |
| Gross Profit | 4.8B | 6.9B | 8.2B | 9.2B | 10.2B |
| EBITDA | 276M | 2B | 1.6B | 2.6B | 2.5B |
| EBIT | 138M | 1.9B | 1.5B | 2.6B | 2.5B |
| Interest Expense | 438M | 24M | 83M | 0 | 0 |
| Net Income | -352M | 1.9B | 4.8B | 2.6B | 2.5B |
| EPS | -0.57 | 2.97 | 7.52 | 4.19 | 4.1 |
| Filing Date | 2022-02-25 | 2023-02-17 | 2024-02-16 | 2025-02-13 | 2026-02-12 |
Income Statement Evolution
Airbnb’s revenue rose steadily from 6B in 2021 to 12.2B in 2025, more than doubling over five years. Net income recovered sharply from a -352M loss in 2021 to 2.5B in 2025. Gross and net margins improved consistently, with gross margin near 83% and net margin above 20% in 2025, reflecting strong operational leverage despite rising expenses.
Is the Income Statement Favorable?
The 2025 income statement shows solid fundamentals with 10.3% revenue growth but a slight 0.35% EBIT decline, signaling margin pressure. Operating expenses grew in line with revenue, which is unfavorable. Still, net income remains robust at 2.5B, supported by zero interest expense and a net margin above 20%. Overall, the income statement is favorable but warrants monitoring expense trends.
Financial Ratios
The following table summarizes key financial ratios for Airbnb, Inc. from 2021 to 2025, reflecting profitability, valuation, liquidity, leverage, efficiency, and dividend metrics:
| Ratios | 2021 | 2022 | 2023 | 2024 | 2025 |
|---|---|---|---|---|---|
| Net Margin | -5.9% | 22.5% | 48.3% | 23.9% | 20.5% |
| ROE | -7.4% | 34.0% | 58.7% | 31.5% | 30.6% |
| ROIC | 5.8% | 21.1% | 14.1% | 18.7% | 19.3% |
| P/E | -291.4 | 28.8 | 18.1 | 31.4 | 33.1 |
| P/B | 21.5 | 9.8 | 10.6 | 9.9 | 10.1 |
| Current Ratio | 1.95 | 1.86 | 1.66 | 1.69 | 1.38 |
| Quick Ratio | 1.95 | 1.86 | 1.66 | 1.69 | 1.38 |
| D/E | 0.51 | 0.42 | 0.28 | 0.27 | 0.24 |
| Debt-to-Assets | 17.6% | 14.6% | 11.2% | 10.9% | 9.0% |
| Interest Coverage | 1.0 | 75.1 | 18.3 | 0.0 | 0.0 |
| Asset Turnover | 0.44 | 0.52 | 0.48 | 0.53 | 0.55 |
| Fixed Asset Turnover | 14.0 | 32.4 | 35.5 | 38.2 | 0.0 |
| Dividend Yield | 0.0% | 0.0% | 0.0% | 0.0% | 0.0% |
Evolution of Financial Ratios
From 2021 to 2025, Airbnb’s Return on Equity (ROE) improved markedly from -7.37% to 30.63%. The Current Ratio declined steadily from 1.95 to 1.38, suggesting reduced liquidity but remaining above 1. The Debt-to-Equity Ratio decreased from 0.51 to 0.24, indicating lower leverage and improved financial stability. Profitability margins stabilized, with net margins rising to around 20.5%.
Are the Financial Ratios Favorable?
In 2025, Airbnb’s profitability ratios, including ROE (30.63%) and net margin (20.51%), are favorable, reflecting strong earnings relative to equity and sales. Liquidity ratios are neutral to favorable, with a Current Ratio of 1.38 and Quick Ratio of 1.38. Leverage is low, with a Debt-to-Equity of 0.24 and Debt-to-Assets at 9%. However, valuation ratios like P/E (33.13) and P/B (10.15) appear unfavorable. Overall, the financial ratios lean slightly favorable.
Shareholder Return Policy
Airbnb, Inc. does not pay dividends, reflecting a reinvestment strategy consistent with its growth phase. The company also does not engage in share buybacks, focusing resources on business expansion and innovation.
This approach aligns with long-term value creation by prioritizing capital allocation towards growth rather than immediate shareholder distributions. However, investors should monitor when and if the company transitions to returning capital, as sustained reinvestment must translate into continued profitability and cash flow growth.
Score analysis
The radar chart below illustrates Airbnb, Inc.’s performance across key financial metrics:
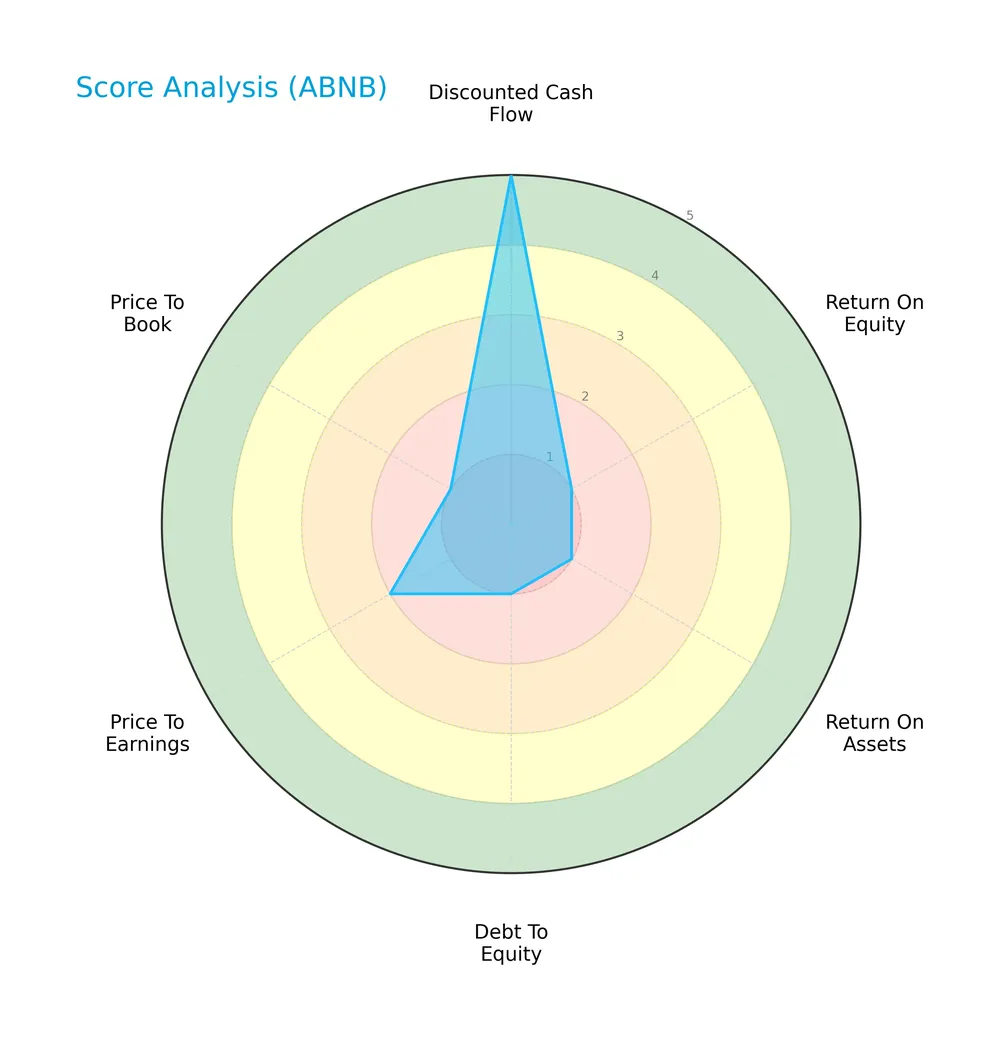
Airbnb scores very favorably on discounted cash flow with a 5. However, returns on equity and assets are very unfavorable at 1 each. Debt to equity and price to book also score very poorly, signaling capital structure concerns. Price to earnings is unfavorable at 2.
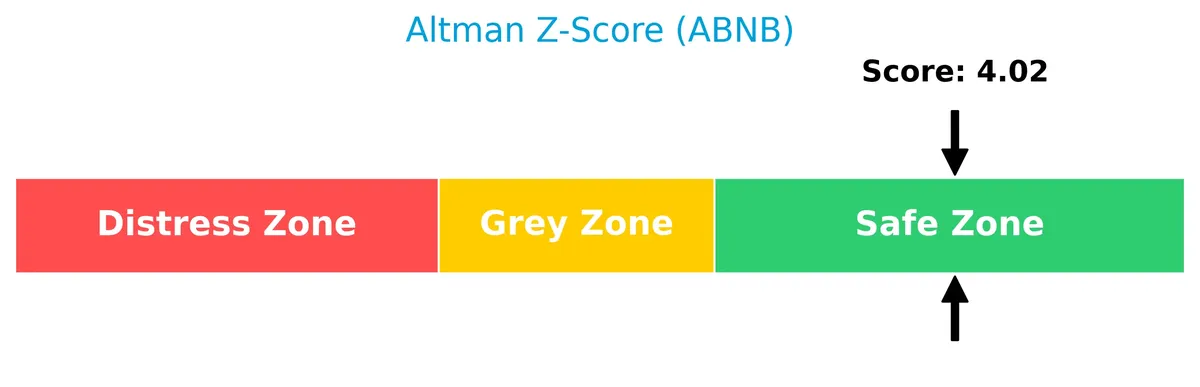
Analysis of the company’s bankruptcy risk
Airbnb’s Altman Z-Score places it well within the safe zone, indicating a low probability of bankruptcy:
Is the company in good financial health?
The Piotroski diagram below reflects Airbnb’s financial strength based on nine performance criteria:

With a Piotroski score of 6, Airbnb demonstrates average financial health. This suggests moderate strength but leaves room for improvement in profitability and efficiency metrics.
Competitive Landscape & Sector Positioning
This sector analysis examines Airbnb, Inc.’s strategic positioning, revenue streams, key products, and main competitors within travel services. I will evaluate whether Airbnb holds a competitive advantage over its industry peers.
Strategic Positioning
Airbnb concentrates revenue in a single reportable segment—travel services—while diversifying geographically across North America (5.2B), EMEA (4.7B), Asia Pacific (1.2B), and Latin America (1.2B) in 2025. This spread balances exposure between mature and emerging markets.
Revenue by Segment
This pie chart illustrates Airbnb, Inc.’s revenue composition by segment for fiscal years 2024 and 2025, highlighting the company’s core business concentration.
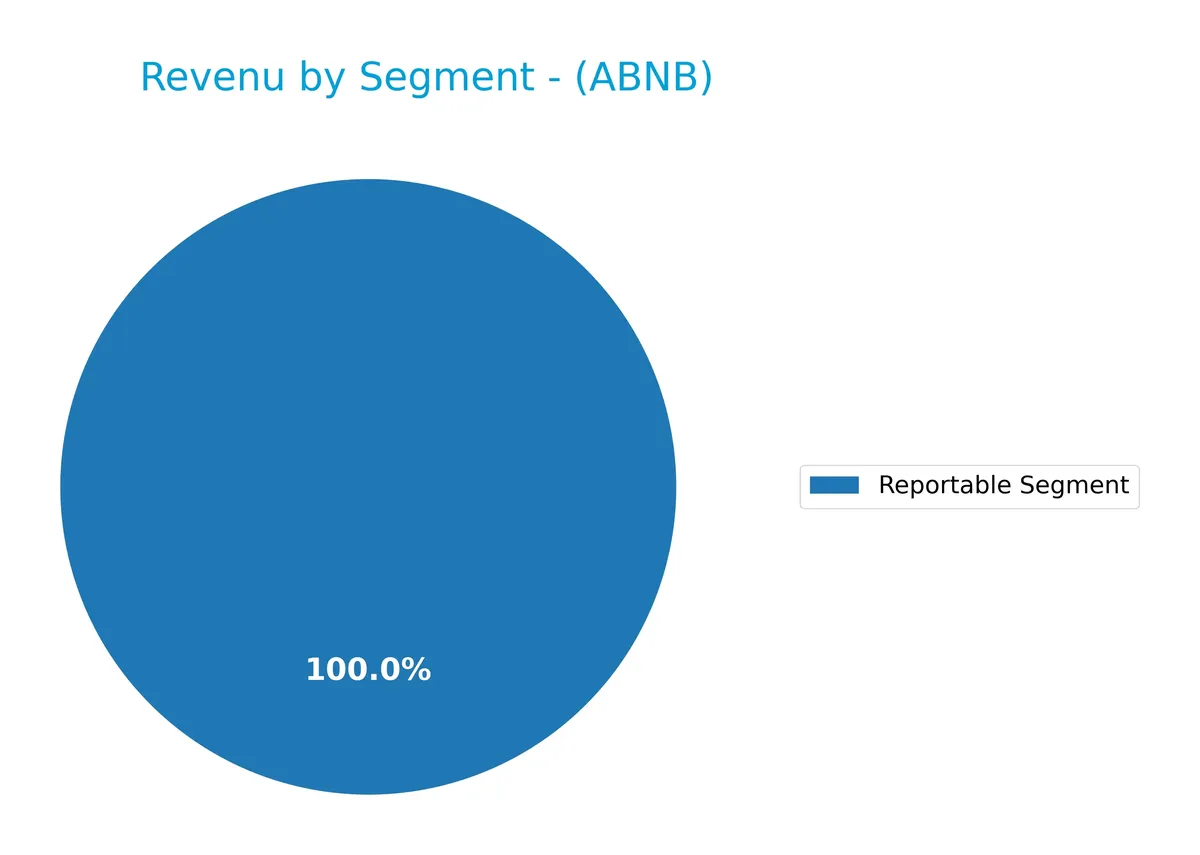
Airbnb’s revenue is concentrated entirely in its Reportable Segment, which grew from 11.1B in 2024 to 12.2B in 2025. This steady increase reinforces the company’s reliance on its primary business line without diversification. The acceleration in revenue suggests strong demand, but investors should note the concentration risk due to the absence of multiple revenue streams.
Key Products & Brands
Airbnb’s primary offerings focus on accommodation and unique travel experiences through its digital platform:
| Product | Description |
|---|---|
| Home Stays | Private rooms, primary homes, and vacation homes listed by hosts worldwide for guest stays. |
| Experiences | Curated activities and local experiences offered by hosts to enhance travel itineraries. |
Airbnb, Inc. operates a marketplace connecting hosts and guests globally. Its core revenue derives from booking accommodations and experiences via its online platform. This model leverages digital convenience and peer-to-peer trust.
Main Competitors
There are 5 main competitors in the Travel Services industry; the table lists the top 5 leaders by market capitalization:
| Competitor | Market Cap. |
|---|---|
| Booking Holdings Inc. | 172B |
| Airbnb, Inc. | 82.3B |
| Royal Caribbean Cruises Ltd. | 77.2B |
| Expedia Group, Inc. | 33.1B |
| Norwegian Cruise Line Holdings Ltd. | 10.4B |
Airbnb ranks 2nd among its peers with a market cap 44% the size of the leader, Booking Holdings. It sits above the average market cap of the top 10 competitors but below the sector median. Airbnb maintains a significant 129% gap over the next competitor above, highlighting strong positioning within this concentrated peer group.
Comparisons with competitors
Check out how we compare the company to its competitors:
Does Airbnb have a competitive advantage?
Airbnb demonstrates a sustainable competitive advantage, creating significant value with a ROIC exceeding WACC by over 10%, accompanied by a strong upward ROIC trend. This indicates efficient capital use and growing profitability, signaling a robust economic moat in the travel services sector.
Looking ahead, Airbnb’s expanding presence across Asia Pacific, EMEA, and Latin America presents substantial growth opportunities. Continued innovation in its platform and diversification into new experiences may further strengthen its market position globally.
SWOT Analysis
This SWOT analysis highlights Airbnb’s key internal and external factors shaping its strategic position.
Strengths
- Strong gross margin at 83%
- High net margin of 20.5%
- Growing ROIC well above WACC (19.3% vs. 8.8%)
Weaknesses
- High P/E of 33.1 signals expensive valuation
- Limited fixed asset turnover at 0
- No dividend yield to attract income investors
Opportunities
- Expanding international revenue, especially in EMEA and Asia Pacific
- Growing global travel demand post-pandemic
- Opportunity to leverage platform for new experiences
Threats
- Intense competition in travel services sector
- Regulatory risks in key markets
- Economic downturn could reduce discretionary travel spending
Airbnb’s robust profitability and scalable platform create a durable competitive advantage. However, valuation risks and operational inefficiencies warrant caution. The firm should focus on geographic expansion and innovation while managing regulatory and economic headwinds.
Stock Price Action Analysis
The weekly stock chart illustrates Airbnb, Inc.’s price movements and volatility over the past 12 months:
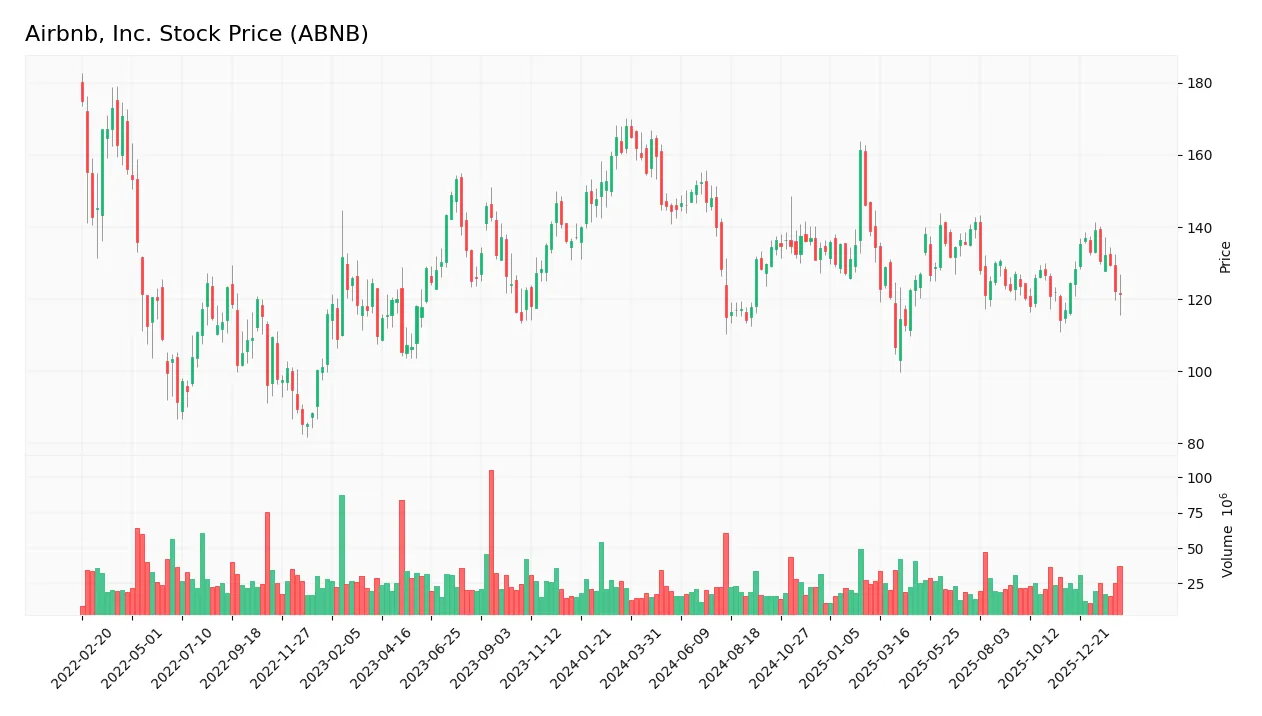
Trend Analysis
Over the past year, ABNB’s stock price declined by 27.71%, signaling a bearish trend with accelerating downside momentum. The 12.58% volatility underlines significant price swings. The stock hit a high of 167.86 and a low of 106.66, confirming a pronounced downtrend.
Volume Analysis
Trading volume shows an increasing trend, totaling 2.8B shares, with buyers accounting for 52.5%. In the recent three months, buyer dominance rose to 56.22%, indicating a slightly buyer-driven market and growing investor participation.
Target Prices
Analysts set a target consensus for Airbnb, Inc. reflecting cautious optimism.
| Target Low | Target High | Consensus |
|---|---|---|
| 107 | 170 | 141.93 |
The target range indicates moderate upside potential. The consensus price suggests steady growth expectations amid sector volatility.

Don’t Let Luck Decide Your Entry Point
Optimize your entry points with our advanced ProRealTime indicators. You’ll get efficient buy signals with precise price targets for maximum performance. Start outperforming now!
Analyst & Consumer Opinions
This section examines Airbnb, Inc.’s analyst grades alongside consumer feedback to provide a comprehensive sentiment overview.
Stock Grades
Here are the latest verified stock grades from recognized financial institutions for Airbnb, Inc.:
| Grading Company | Action | New Grade | Date |
|---|---|---|---|
| BMO Capital | Maintain | Market Perform | 2026-02-13 |
| TD Cowen | Maintain | Buy | 2026-02-13 |
| Barclays | Maintain | Equal Weight | 2026-02-13 |
| Wedbush | Maintain | Neutral | 2026-02-13 |
| Evercore ISI Group | Upgrade | Outperform | 2026-02-13 |
| Benchmark | Maintain | Buy | 2026-02-13 |
| Deutsche Bank | Upgrade | Buy | 2026-02-13 |
| Wells Fargo | Maintain | Equal Weight | 2026-02-13 |
| Wedbush | Maintain | Neutral | 2026-02-06 |
| Citizens | Upgrade | Market Outperform | 2026-02-04 |
The consensus shows a cautious tilt with upgrades from Evercore ISI, Deutsche Bank, and Citizens, while most firms maintain neutral or hold-equivalent grades. The overall trend indicates measured optimism amid balanced analyst opinions.
Consumer Opinions
Airbnb, Inc. continues to evoke strong emotions from its user base, reflecting its impact on travel and hospitality.
| Positive Reviews | Negative Reviews |
|---|---|
| “Easy to use platform with a wide variety of options worldwide.” | “Customer service response times are often slow.” |
| “Hosts are generally friendly and accommodating.” | “Cleaning standards vary significantly between listings.” |
| “Great value for unique stays compared to traditional hotels.” | “Cancellation policies can be confusing and strict.” |
Overall, consumers praise Airbnb’s diverse offerings and user-friendly interface. However, inconsistent service quality and support remain persistent concerns.
Risk Analysis
Below is a summary of key risks facing Airbnb, Inc., categorized by likelihood and potential impact:
| Category | Description | Probability | Impact |
|---|---|---|---|
| Market Volatility | High beta (1.14) exposes Airbnb to travel sector cyclicality and tech swings | Medium | High |
| Valuation Risk | Elevated P/E (33.13) and P/B (10.15) ratios indicate potential overvaluation | High | Medium |
| Competitive Risk | Intense competition from traditional hotels and alternative platforms | Medium | Medium |
| Liquidity Risk | Moderate current ratio (1.38) provides some cushion but limits flexibility | Low | Medium |
| Operational Risk | Dependence on global travel trends and regulatory changes | Medium | High |
| Financial Health | Strong Altman Z-score (4.02) signals low bankruptcy risk | Low | Low |
I consider valuation risk the most pressing. The stock trades at steep multiples relative to sector averages, limiting upside if growth slows. Market volatility also bears watching, given Airbnb’s sensitivity to economic cycles and travel disruptions. Operational risks remain elevated due to shifting travel regulations worldwide. However, the company’s low leverage and strong liquidity mitigate financial distress threats. Prudence dictates watching valuation and macro trends closely before committing.
Should You Buy Airbnb, Inc.?
Airbnb appears to be generating robust value creation with a durable competitive moat supported by growing ROIC well above WACC. Despite a manageable leverage profile reflected in a safe Altman Z-Score, its overall rating could be seen as cautious, suggesting mixed operational efficiency signals.
Strength & Efficiency Pillars
Airbnb, Inc. posts strong operational efficiency with a net margin of 20.51% and a return on equity of 30.63%. Its return on invested capital (ROIC) stands at 19.29%, comfortably above its weighted average cost of capital (WACC) at 8.84%. This gap confirms Airbnb as a clear value creator. The company’s gross margin of 82.96% and EBIT margin of 20.78% further underscore its robust profitability and competitive positioning in the travel sector.
Weaknesses and Drawbacks
Despite solid profitability, Airbnb faces valuation headwinds with a high P/E ratio of 33.13 and a price-to-book ratio of 10.15, signaling a premium market price that may limit near-term upside. The current ratio of 1.38 is adequate but not exceptional, suggesting moderate liquidity. The stock has been bearish overall with a 27.71% decline, though recent trading shows slight buyer dominance at 56.22%, indicating tentative positive momentum amid ongoing market pressure.
Our Final Verdict about Airbnb, Inc.
Airbnb’s long-term fundamentals appear solid, supported by value creation and profitability. However, the bearish overall trend and premium valuation suggest prudence. Despite recent buyer interest, a cautious wait-and-see approach might be warranted for investors seeking a better entry point. The profile may appear attractive for those with a tolerance for market volatility and valuation risk.
Disclaimer: This content is for informational purposes only and does not constitute financial, investment, or other professional advice. Investing in financial markets involves a significant risk of loss, and past performance is not indicative of future results.
Additional Resources
- Airbnb Gains as ‘Healthy’ Demand Fuels Faster Growth in 2026 – Bloomberg.com (Feb 13, 2026)
- AI-insulated? CEO Chesky thinks AI is ‘the best thing to happen to Airbnb’ (ABNB:NASDAQ) – Seeking Alpha (Feb 13, 2026)
- Airbnb Posts Q4 Beat, ‘Wins The Narrative Battle’: Analysts – Benzinga (Feb 13, 2026)
- DA Davidson lowers Airbnb stock price target to $150 on multiple compression – Investing.com (Feb 13, 2026)
- Airbnb sees double-digit booking growth continuing into FY26 (ABNB:NASDAQ) – Seeking Alpha (Feb 12, 2026)
For more information about Airbnb, Inc., please visit the official website: airbnb.com