Comcast Corporation is reshaping how we connect and consume media, making it an integral part of daily life for millions. As a powerhouse in telecommunications and entertainment, Comcast’s innovative offerings—from Xfinity’s broadband and streaming services to its iconic NBCUniversal content—set the standard for quality and market influence. However, in a fast-evolving industry, I must ask: do Comcast’s fundamentals still support its current market valuation and growth potential?

Table of contents
Company Description
Comcast Corporation (CMCSA), founded in 1963 and headquartered in Philadelphia, PA, is a leading media and technology company operating globally. The firm primarily functions through five segments: Cable Communications, Media, Studios, Theme Parks, and Sky. Under the Xfinity brand, it provides broadband, video, voice, and wireless services to residential and business clients. Its Media segment encompasses NBCUniversal’s television and streaming platforms, while the Studios segment manages film and television production. With operations in the US, Europe, and Asia, Comcast is not only a telecommunications leader but also a significant player in entertainment and leisure, shaping the industry through continuous innovation and a robust content ecosystem.
Fundamental Analysis
In this section, I will analyze Comcast Corporation’s financial health by examining its income statement, financial ratios, and dividend payout policy.
Income Statement
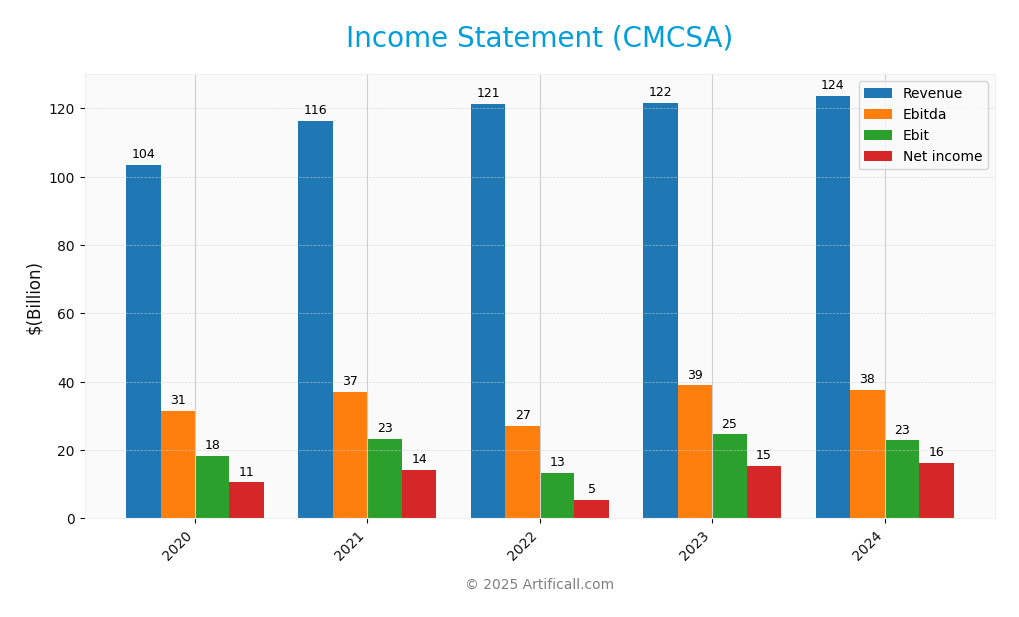
The following table outlines Comcast Corporation’s income statement for the past five fiscal years, showcasing key financial metrics that can help investors assess the company’s performance.

| Metric | 2020 | 2021 | 2022 | 2023 | 2024 |
|---|---|---|---|---|---|
| Revenue | 104B | 116B | 121B | 122B | 124B |
| Cost of Revenue | 46B | 52B | 52B | 51B | 52B |
| Operating Expenses | 40B | 43B | 47B | 47B | 49B |
| Gross Profit | 57B | 64B | 69B | 71B | 72B |
| EBITDA | 31B | 37B | 27B | 39B | 38B |
| EBIT | 18B | 23B | 13B | 25B | 23B |
| Interest Expense | 4.6B | 4.3B | 3.9B | 4.1B | 4.1B |
| Net Income | 10B | 14B | 5.4B | 15B | 16B |
| EPS | 2.3 | 3.1 | 1.2 | 3.7 | 4.2 |
| Filing Date | 2021-02-04 | 2022-02-02 | 2023-02-03 | 2024-01-31 | 2025-01-31 |
Over the past five years, Comcast has exhibited a steady increase in both Revenue and Net Income, with revenue moving from 104B in 2020 to 124B in 2024. Notably, net income has also improved significantly, rising from 10B to 16B during the same period. The gross profit margin has remained relatively stable, indicating efficient cost management. In 2024, while revenue growth continued, EBITDA slightly decreased, suggesting potential challenges in maintaining operating efficiency, which warrants further observation in future quarters. Overall, Comcast’s financial health appears robust, but investors should remain vigilant regarding margin trends and operational costs.
Financial Ratios
The following table summarizes Comcast Corporation’s financial ratios over the last available years, allowing for an easy comparison of performance metrics.
| Ratios | 2020 | 2021 | 2022 | 2023 | 2024 |
|---|---|---|---|---|---|
| Net Margin | 10.17% | 12.17% | 4.42% | 12.66% | 13.09% |
| ROE | 11.66% | 12.92% | 6.64% | 17.01% | 18.81% |
| ROIC | 5.57% | 6.99% | 2.96% | 8.02% | 8.82% |
| P/E | 22.75 | 16.29 | 28.69 | 11.75 | 9.06 |
| P/B | 2.65 | 2.40 | 1.90 | 2.19 | 1.71 |
| Current Ratio | 0.93 | 0.85 | 0.78 | 0.60 | 0.68 |
| Quick Ratio | 0.93 | 0.85 | 0.78 | 0.60 | 0.68 |
| D/E | 1.21 | 1.04 | 1.24 | 1.17 | 1.16 |
| Debt-to-Assets | 39.77% | 36.25% | 38.86% | 36.66% | 37.22% |
| Interest Coverage | 3.86 | 4.86 | 5.81 | 5.70 | 5.64 |
| Asset Turnover | 0.38 | 0.42 | 0.47 | 0.46 | 0.46 |
| Fixed Asset Turnover | 1.99 | 2.15 | 2.19 | 2.04 | 1.98 |
| Dividend Yield | 1.73% | 1.96% | 3.08% | 2.64% | 3.28% |
Interpretation of Financial Ratios
In the most recent year (2024), Comcast’s financial ratios indicate a generally strong performance, highlighted by a net margin of 13.09% and an impressive return on equity (ROE) of 18.81%. However, the current and quick ratios below 1 signal potential liquidity concerns, suggesting limited short-term asset coverage against liabilities.
Evolution of Financial Ratios
Over the past five years, Comcast’s financial ratios have shown a mixed trend. While net margins and ROE have improved, indicating better profitability, liquidity ratios have declined, raising concerns about short-term financial health. The P/E ratio has also decreased significantly, reflecting a decline in market valuation relative to earnings.
Distribution Policy
Comcast Corporation (CMCSA) maintains a distribution strategy that includes paying dividends, with a current annual dividend yield of approximately 3.28%. The dividend payout ratio stands at around 29.7%, indicating a sustainable approach to shareholder returns. Additionally, the company engages in share buybacks, which further supports shareholder value. However, investors should be cautious of potential risks associated with unsustainable distributions in an unpredictable market environment. Overall, this distribution policy appears to support sustainable long-term value creation for shareholders.
Sector Analysis
Comcast Corporation operates in the Telecommunications Services industry, offering diverse media and technology solutions, including broadband, video, and streaming services, while competing against major players like AT&T and Verizon.
Strategic Positioning
Comcast Corporation (CMCSA) holds a significant position in the telecommunications and media market, with a market cap of approximately 100.25B. The company faces competitive pressure from both traditional cable providers and emerging streaming platforms, making it essential to adapt. With a beta of 0.826, Comcast exhibits lower volatility compared to the market, indicating a degree of stability. Technological disruption is a constant threat, particularly in broadband and streaming services, necessitating ongoing innovation to maintain its market share and competitive edge.
Revenue by Segment
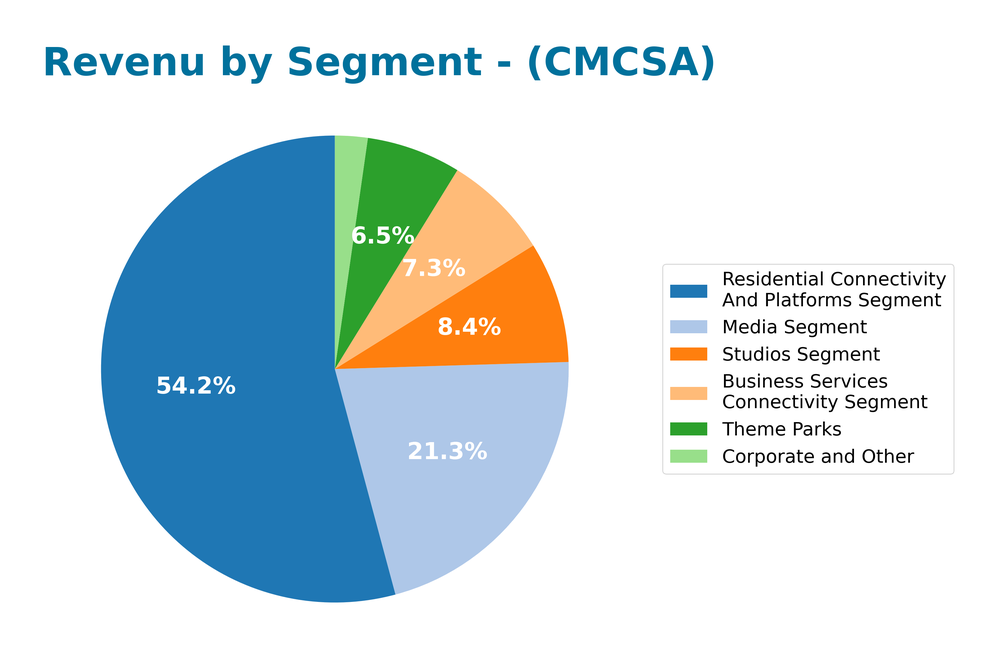
The following chart illustrates Comcast Corporation’s revenue distribution across various segments for the fiscal year ending December 31, 2024.

In 2024, Comcast’s revenue was primarily driven by the Residential Connectivity and Platforms Segment, contributing 72B, followed by the Media Segment at 28B. The Business Services Connectivity Segment also showed growth, reaching 9.7B. Notably, the Studios Segment experienced a slight decline to 11.1B, while Theme Parks brought in 8.6B. The overall trend indicates a stable performance in connectivity services, although the Media Segment’s growth rate has slowed, suggesting potential margin pressures and increased competition in content delivery.
Key Products
Below is a table summarizing the key products offered by Comcast Corporation.
| Product | Description |
|---|---|
| Xfinity Broadband | High-speed internet service that provides residential and business customers with fast and reliable connectivity. |
| Xfinity Video | Cable television service offering a variety of channels, on-demand content, and streaming options. |
| Xfinity Voice | Digital voice service that includes unlimited calling, voicemail, and advanced calling features. |
| Peacock Streaming Service | A subscription-based streaming platform featuring movies, TV shows, news, and sports content from NBCUniversal. |
| NBCUniversal Media | Operates various television networks, including NBC and Telemundo, delivering news and entertainment programming. |
| Universal Theme Parks | A collection of theme parks located in Orlando, Hollywood, Osaka, and Beijing, offering entertainment and attractions. |
| Sky Direct-to-Consumer | Provides video, broadband, and voice services primarily in the UK and Europe, along with a variety of entertainment networks. |
| NBCUniversal Studios | Involved in film and television production, responsible for creating and distributing a wide range of content. |
This table provides an overview of Comcast’s diverse product offerings, which span telecommunications services, media, and entertainment, allowing the company to maintain a strong position in the market.
Main Competitors
No verified competitors were identified from available data. Comcast Corporation, a prominent player in the telecommunications services sector, currently has an estimated market share of approximately 30% in the U.S. market. The company maintains a competitive position through its diverse offerings, including broadband, video, and streaming services, which are crucial in a rapidly evolving digital landscape.
Competitive Advantages
Comcast Corporation (CMCSA) holds a robust position in the telecommunications sector due to its diverse service offerings and established brand recognition. Key advantages include its extensive cable communications network and a growing footprint in streaming services through Peacock. The company also benefits from synergistic operations among its media, studios, and theme parks segments. Looking ahead, Comcast has opportunities to expand in international markets and enhance its content portfolio, particularly with new original programming and strategic partnerships. These initiatives could bolster revenue and market share, positioning the company for sustained growth.
SWOT Analysis
The SWOT analysis helps identify key internal and external factors influencing Comcast Corporation’s strategic decision-making.
Strengths
- Strong brand recognition
- Diverse service offerings
- Robust market position
Weaknesses
- High debt levels
- Intense competition
- Regulatory challenges
Opportunities
- Expansion in streaming services
- Growth in broadband demand
- International market opportunities
Threats
- Economic downturns
- Rapid technological changes
- Cybersecurity risks
Overall, Comcast Corporation’s strengths position it well in the competitive telecommunications landscape, yet the company must navigate its weaknesses and external threats effectively. Focusing on leveraging opportunities, particularly in streaming and broadband, will be crucial for sustained growth.
Stock Analysis
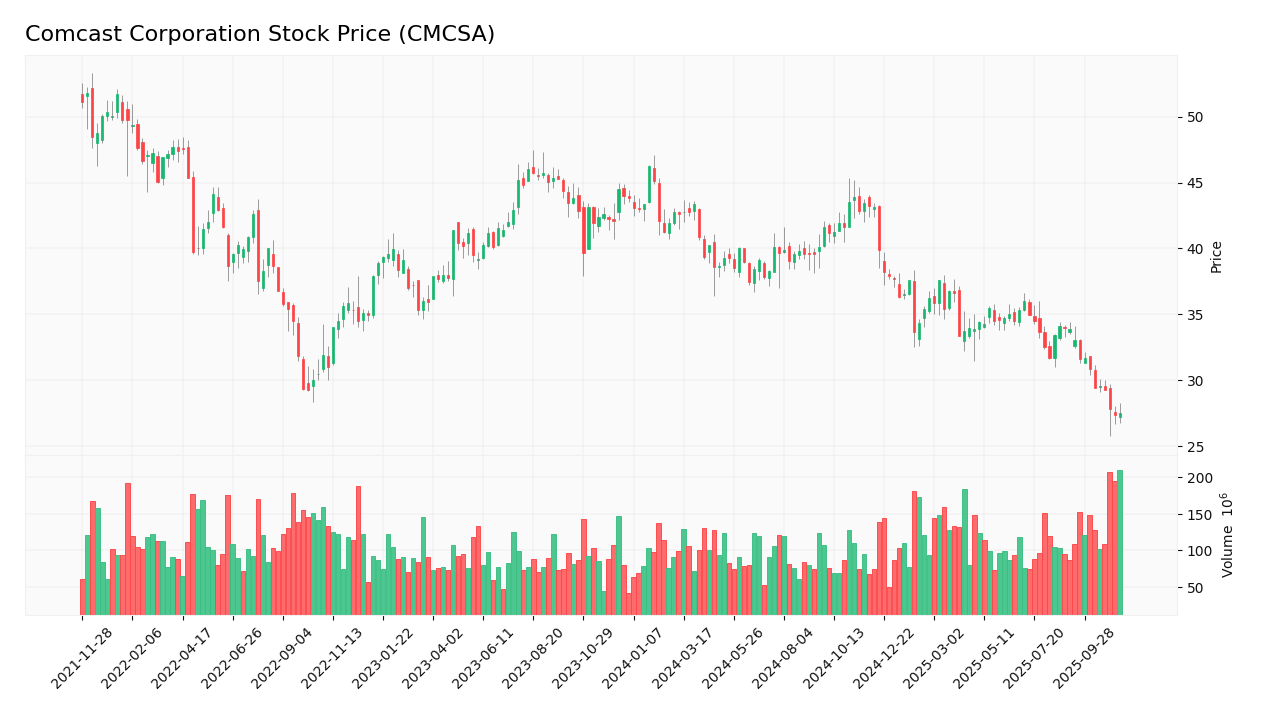
Over the past year, Comcast Corporation (CMCSA) has experienced significant price movements, culminating in a notable bearish trend characterized by a price drop of 37.48%. This analysis provides insights into the stock’s trading dynamics and recent performance.

Trend Analysis
Analyzing the stock’s trend over the past year, I observe a percentage change of -37.48%, indicating a bearish trend. During the recent period from August 31, 2025, to November 16, 2025, the price change was -19.02%, also reflecting a bearish direction. The stock’s volatility, indicated by a standard deviation of 2.28 during this recent timeframe, shows that the price is subject to fluctuations. The highest price recorded was 46.26, while the lowest was 27.35. The trend is currently in a state of deceleration.
Volume Analysis
Over the last three months, the average trading volume for CMCSA has been approximately 138.33M. The activity appears to be seller-driven, with average sell volume at 86.03M compared to average buy volume of 52.30M, indicating dominant selling pressure. Additionally, the volume trend is bullish due to an increasing volume trend slope of 9.18M, suggesting heightened market participation despite the prevailing bearish sentiment.
Analyst Opinions
Recent analyst recommendations for Comcast Corporation (CMCSA) have been predominantly positive. Analysts have rated the stock with an “A” rating, reflecting strong fundamentals, particularly in discounted cash flow and return on equity, both scoring 5. Analysts emphasize the company’s solid debt-to-equity position, which scored 1, indicating low leverage. Notable analysts suggest a “buy” consensus for CMCSA this year, highlighting its potential for growth amidst a competitive landscape. Overall, the sentiment leans towards a buy, making it an attractive option for investors looking to enhance their portfolios.
Stock Grades
The stock ratings for Comcast Corporation (CMCSA) reflect a mix of maintained positions and a few downgrades, indicating a cautious outlook.
| Grading Company | Action | New Grade | Date |
|---|---|---|---|
| Goldman Sachs | maintain | Neutral | 2025-11-03 |
| Barclays | maintain | Equal Weight | 2025-11-03 |
| Citigroup | maintain | Buy | 2025-11-03 |
| Benchmark | maintain | Buy | 2025-10-31 |
| TD Cowen | maintain | Buy | 2025-10-31 |
| Bernstein | maintain | Market Perform | 2025-10-31 |
| Scotiabank | maintain | Sector Perform | 2025-10-31 |
| Seaport Global | downgrade | Neutral | 2025-10-31 |
| Evercore ISI Group | maintain | Outperform | 2025-10-31 |
| Keybanc | downgrade | Sector Weight | 2025-10-31 |
Overall, the trend shows that while several firms maintain a positive or neutral stance on CMCSA, the recent downgrades from Seaport Global and Keybanc may suggest caution among some analysts regarding the stock’s near-term performance.
Target Prices
The consensus target price for Comcast Corporation (CMCSA) reflects a balanced outlook from analysts.
| Target High | Target Low | Consensus |
|---|---|---|
| 41.5 | 28 | 34.59 |
Analysts expect Comcast’s stock to range between 28 and 41.5, with a consensus target of 34.59, suggesting a cautiously optimistic view.
Consumer Opinions
Consumer sentiment about Comcast Corporation (CMCSA) reflects a mix of satisfaction and frustration among its users.
| Positive Reviews | Negative Reviews |
|---|---|
| “Great cable service with reliable internet.” | “Customer service is often unresponsive.” |
| “Wide range of channels and content.” | “High prices for bundled services.” |
| “Quick installation and setup process.” | “Frequent service outages in my area.” |
Overall, consumer feedback highlights Comcast’s strong content offerings and installation efficiency but points out significant issues with customer service and pricing, suggesting areas for improvement.
Risk Analysis
In assessing the investment potential of Comcast Corporation (CMCSA), it’s essential to understand the various risks that could impact its performance. Below is a summary of key risks to consider:
| Category | Description | Probability | Impact |
|---|---|---|---|
| Market Competition | Intense competition from streaming services | High | High |
| Regulatory Changes | Changes in telecommunications regulations | Medium | High |
| Economic Downturn | Potential recession impacting consumer spending | High | Medium |
| Technological Shift | Rapid changes in technology affecting service delivery | Medium | High |
| Cybersecurity Threats | Increasing risk of data breaches and cyberattacks | High | High |
Currently, the most pressing risks for CMCSA include intense competition from streaming services and cybersecurity threats, both of which have significant implications for profitability and market share.
Should You Buy Comcast Corporation?
Comcast Corporation (CMCSA) boasts a net margin of 13.09%, a return on invested capital (ROIC) of 10.01%, and a weighted average cost of capital (WACC) of 5.45%. The company has strong competitive advantages in its market presence and diversified services, though it faces risks such as increasing competition and market dependence.
Given that Comcast’s net margin is positive, ROIC exceeds WACC, and the long-term trend appears negative, I recommend exercising caution. The recent seller volumes suggest that it’s better to wait for more favorable buyer volumes to return before considering an investment.
Specific risks include escalating competition within the telecommunications industry and potential valuation concerns driven by market fluctuations.
Disclaimer: This article is not financial advice. Each investor is responsible for their own investment decisions.
Additional Resources
- Comcast: Even Better Buying Opportunity With Double-Digit Returns Amid Market Overreaction – Seeking Alpha (Nov 13, 2025)
- Wrapmanager Inc. Buys 9,862 Shares of Comcast Corporation $CMCSA – MarketBeat (Nov 15, 2025)
- ProVise Management Group LLC Raises Stock Holdings in Comcast Corporation $CMCSA – MarketBeat (Nov 16, 2025)
- BNP Paribas Upgrades Comcast (CMCSA) to Neutral – Finviz (Nov 16, 2025)
- Is Comcast a Bargain After a 33% Share Price Drop in 2025? – simplywall.st (Nov 16, 2025)
For more information about Comcast Corporation, please visit the official website: corporate.comcast.com


