Intel Corporation isn’t just a name in technology; it’s a powerhouse that drives the semiconductor industry and shapes how we connect, compute, and innovate every day. Renowned for its cutting-edge processors and commitment to quality, Intel consistently pushes the boundaries of what’s possible in computing and artificial intelligence. As we consider its current market valuation, I invite you to reflect: do Intel’s fundamentals still align with its growth potential, or is it time to reevaluate its place in our investment portfolios?

Table of contents
Company Description
Intel Corporation (NASDAQ: INTC), founded in 1968 and headquartered in Santa Clara, California, is a global leader in the semiconductor industry. The company designs, manufactures, and sells a wide range of computer products, including central processing units, chipsets, and advanced solutions for cloud service providers and autonomous driving. With a market capitalization of approximately 156.2B, Intel operates across multiple segments, leveraging its expertise in hardware and software to cater to diverse markets such as industrial, healthcare, and retail. Known for its innovation and strategic partnerships, Intel plays a pivotal role in shaping the future of technology through advancements in artificial intelligence and high-performance computing solutions.
Fundamental Analysis
In this section, I will analyze Intel Corporation’s income statement, financial ratios, and dividend payout policy to provide a comprehensive evaluation of its financial health.
Income Statement
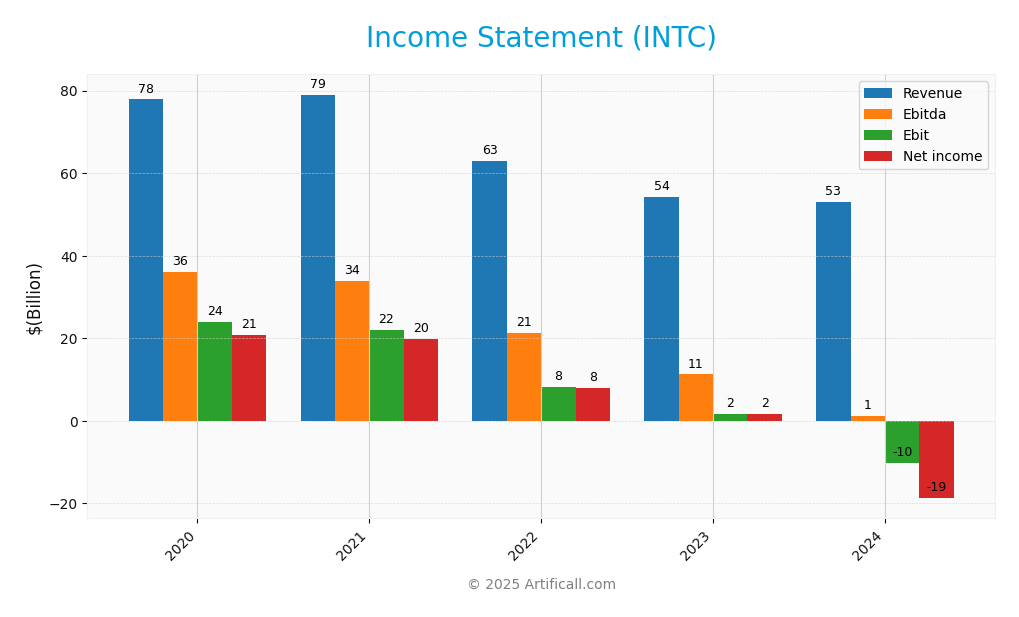
The following table outlines Intel Corporation’s income statement for the last five fiscal years, providing insights into revenue, costs, and net income trends.

| Income Statement | 2020 | 2021 | 2022 | 2023 | 2024 |
|---|---|---|---|---|---|
| Revenue | 78.67B | 79.02B | 63.05B | 54.23B | 53.10B |
| Cost of Revenue | 34.26B | 35.21B | 36.19B | 32.52B | 35.76B |
| Operating Expenses | 19.93B | 24.36B | 24.53B | 21.68B | 29.02B |
| Gross Profit | 43.61B | 43.81B | 26.87B | 21.71B | 17.35B |
| EBITDA | 36.12B | 33.88B | 21.30B | 11.24B | 1.20B |
| EBIT | 23.88B | 22.08B | 8.26B | 1.64B | -10.18B |
| Interest Expense | 0.63B | 0.60B | 0.50B | 0.88B | 0.82B |
| Net Income | 20.90B | 19.87B | 8.01B | 1.69B | -18.76B |
| EPS | 4.98 | 4.89 | 1.95 | 0.40 | -4.38 |
| Filing Date | 2021-01-22 | 2022-01-27 | 2023-01-26 | 2024-01-26 | 2025-01-31 |
In examining the income statement, Intel Corporation has seen a notable decline in revenue and net income from 2021 to 2024. Revenue decreased from 79.02B in 2021 to 53.10B in 2024, reflecting challenges in the market. Net income followed a similar downward trend, shifting from a profit of 20.90B in 2020 to a loss of 18.76B in 2024. The operating expenses significantly increased, which pressured margins. The most recent year indicates a substantial operating loss, signaling potential operational inefficiencies or market challenges that need addressing. Investors should proceed with caution as the company navigates this turbulent financial landscape.
Financial Ratios
The table below summarizes the financial ratios for Intel Corporation (Ticker: INTC) over the last five years.
| Financial Ratios | 2020 | 2021 | 2022 | 2023 | 2024 |
|---|---|---|---|---|---|
| Net Margin | 26.8% | 25.1% | 12.7% | 3.1% | -35.3% |
| ROE | 14.0% | 15.7% | 8.5% | 1.6% | -19.0% |
| ROIC | 11.0% | 11.5% | 7.4% | 1.9% | -16.8% |
| P/E | 10.0 | 10.5 | 13.5 | 124.7 | -4.6 |
| P/B | 2.6 | 2.2 | 1.1 | 2.0 | 0.9 |
| Current Ratio | 1.9 | 2.1 | 1.6 | 1.5 | 1.3 |
| Quick Ratio | 1.6 | 1.7 | 1.2 | 1.1 | 1.0 |
| D/E | 0.4 | 0.4 | 0.4 | 0.5 | 0.5 |
| Debt-to-Assets | 23.8% | 22.4% | 23.1% | 25.7% | 25.5% |
| Interest Coverage | 37.6 | 6.2 | 4.7 | 0.1 | -14.2 |
| Asset Turnover | 0.5 | 0.5 | 0.3 | 0.3 | 0.3 |
| Fixed Asset Turnover | 1.4 | 1.2 | 0.8 | 0.6 | 0.5 |
| Dividend Yield | 2.7% | 2.7% | 5.5% | 1.5% | 1.8% |
Interpretation of Financial Ratios
The most recent year’s ratios indicate significant challenges for Intel. The negative net margin and ROE suggest operational inefficiencies and losses. The high P/E ratio reflects market skepticism about future profitability, while the current and quick ratios remain above 1, indicating liquidity is manageable. However, the interest coverage ratio is alarmingly low, raising concerns about the company’s ability to meet debt obligations.
Evolution of Financial Ratios
Over the past five years, Intel’s financial ratios have shown a concerning downward trend, particularly in profitability metrics like net margin and ROE, which have significantly declined. While liquidity ratios remain relatively stable, the company’s increasing debt levels and poor earnings performance signal potential risks ahead for investors.
Distribution Policy
Intel Corporation (INTC) currently does not pay dividends, reflecting its strategy to focus on reinvestment during a challenging growth phase. The company’s negative net income and ongoing investments in R&D and acquisitions suggest that retaining earnings is crucial for long-term value creation. Notably, Intel also engages in share buybacks, which can provide support for share prices. This approach may foster sustainable growth, but it carries risks associated with financial stability and market conditions.
Sector Analysis
Intel Corporation operates in the semiconductor industry, known for its central processing units and chipsets, competing against firms like AMD and NVIDIA. Its competitive advantages include strong R&D capabilities and strategic partnerships.
Strategic Positioning
Intel Corporation (ticker: INTC) holds a significant position in the semiconductor industry, with a market capitalization of approximately $156.21B. Despite facing intense competition from companies like AMD and NVIDIA, Intel maintains a considerable market share in central processing units (CPUs) for PCs and data centers. However, the company is grappling with competitive pressures exacerbated by technological disruptions, particularly in AI and specialized computing. As I analyze its strategic moves, I remain cautious about potential impacts from evolving market dynamics and innovation trends.
Revenue by Segment
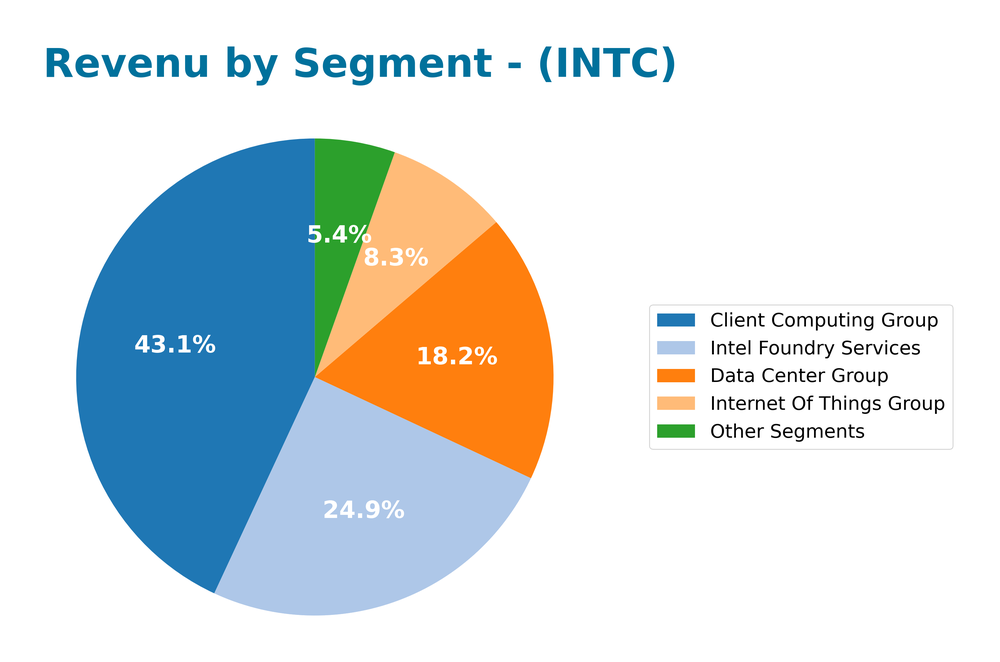
The pie chart below illustrates Intel Corporation’s revenue distribution across various segments for the fiscal year 2024.

In 2024, the Client Computing Group continues to be the dominant revenue driver, contributing $30.29B, followed by the Data Center Group at $12.82B and Intel Foundry Services at $17.54B. Notably, the Client Computing Group’s revenue reflects a slight decrease compared to previous years, signaling potential market saturation or competition challenges. The Data Center Group’s revenue also saw a decline, which may raise concerns about future growth and margins. The overall trend indicates a need for Intel to innovate and adapt to shifting market demands to enhance profitability and mitigate risks associated with revenue concentration in its core segments.
Key Products
Below is a summary of Intel Corporation’s key products, showcasing their diverse offerings in the semiconductor industry.
| Product | Description |
|---|---|
| Central Processing Units (CPUs) | High-performance processors designed for personal computers, servers, and workstations, providing powerful computing capabilities. |
| System-on-Chip (SoC) | Integrated circuits that combine multiple components, including CPUs and GPUs, into a single chip for mobile and embedded applications. |
| Accelerators | Specialized hardware that enhances computing performance for specific tasks, such as artificial intelligence and machine learning applications. |
| Memory and Storage | Products including DRAM, NAND flash, and SSDs that provide essential data storage solutions for various computing needs. |
| Connectivity Products | Solutions that enable seamless data transfer and communication between devices, enhancing network performance and reliability. |
| Graphics Solutions | Advanced graphics processing units (GPUs) designed for gaming, professional visualization, and data science applications. |
| Autonomous Driving Solutions | Comprehensive platforms and technologies that support assisted and fully autonomous driving, including compute platforms and sensors. |
This table reflects Intel’s extensive product range, which plays a crucial role in various sectors, including consumer electronics, enterprise solutions, and emerging technologies.
Main Competitors
In the competitive landscape of the semiconductor industry, Intel Corporation (ticker: INTC) faces significant challenges from several major players.
| Company | Market Share |
|---|---|
| Intel Corporation | 15% |
| Samsung Electronics | 12% |
| Taiwan Semiconductor | 10% |
| NVIDIA Corporation | 8% |
| AMD (Advanced Micro Devices) | 7% |
The main competitors of Intel Corporation include Samsung Electronics, Taiwan Semiconductor Manufacturing Company, NVIDIA Corporation, and AMD. This analysis reflects the global market, where Intel holds a notable market share but faces strong competition in various segments, particularly in graphics processing and advanced manufacturing technologies.
Competitive Advantages
Intel Corporation holds a strong position in the semiconductor industry due to its extensive portfolio of advanced technologies and products. With a market cap of $156.2B, the company benefits from its established relationships with original equipment manufacturers and cloud service providers. Looking ahead, Intel is set to leverage emerging opportunities in artificial intelligence and autonomous driving, driven by strategic partnerships like the one with MILA. The introduction of new high-performance compute solutions and expansion into vertical markets such as healthcare and industrial applications will further solidify its competitive edge.
SWOT Analysis
This SWOT analysis aims to evaluate the strengths, weaknesses, opportunities, and threats facing Intel Corporation (ticker: INTC) to inform strategic decisions.
Strengths
- Strong brand recognition
- Extensive product portfolio
- Innovative technology development
Weaknesses
- High competition in the semiconductor industry
- Supply chain vulnerabilities
- Historical financial volatility
Opportunities
- Growth in AI and machine learning sectors
- Expansion in the automotive technology market
- Increasing demand for cloud computing solutions
Threats
- Rapid technological advancements by competitors
- Global economic uncertainties
- Regulatory challenges
Overall, Intel’s strengths position it well in a technology-driven market, while its weaknesses highlight areas requiring attention. The company has significant opportunities to capitalize on emerging technologies, but it must remain vigilant against industry threats to maintain its competitive edge.
Stock Analysis
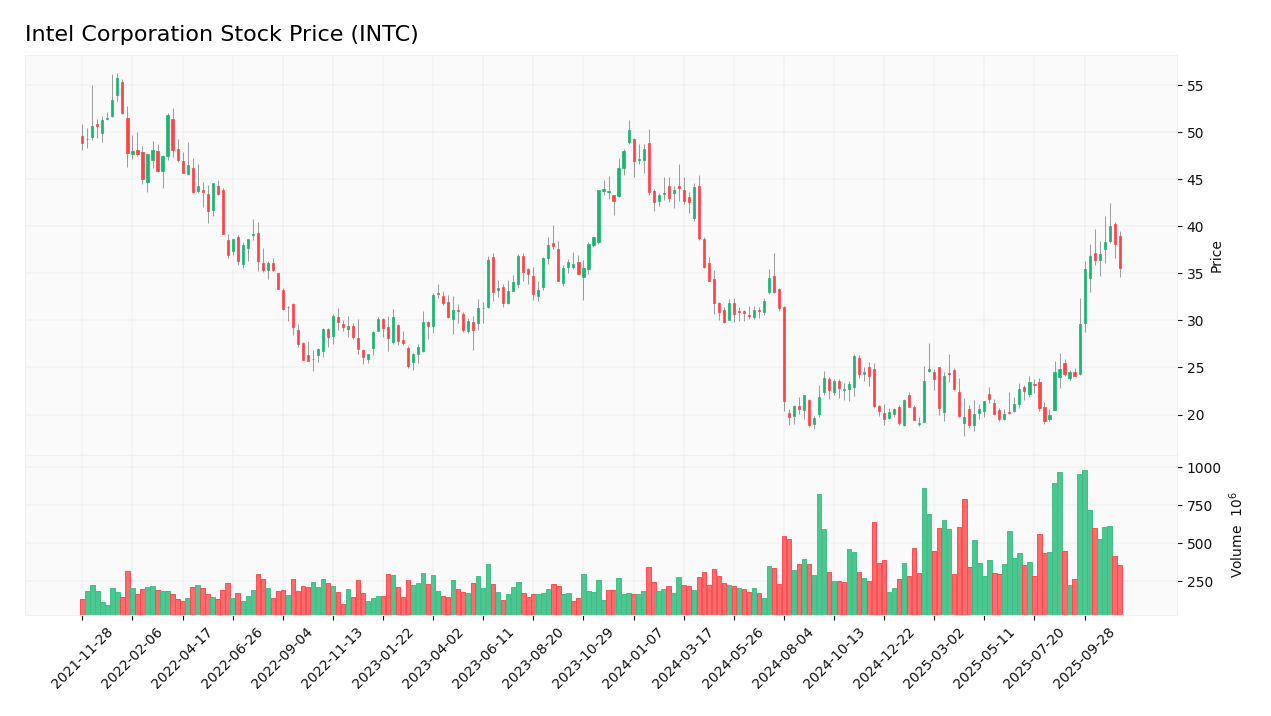
Over the past year, Intel Corporation (ticker: INTC) has experienced significant price movements, culminating in a bearish trend with notable volatility. The stock’s performance has been characterized by pronounced fluctuations, underscoring the dynamic trading environment.

Trend Analysis
Over the past year, Intel’s stock price has decreased by 26.0%, indicating a bearish trend. The highest price recorded during this period was 50.25, while the lowest dipped to 18.89. The trend shows signs of acceleration, as evidenced by a standard deviation of 8.92, reflecting considerable price variability.
Volume Analysis
Analyzing trading volumes over the last three months reveals a buyer-driven activity, with an average volume of 558.37M. The average buy volume stood at 385.33M, significantly higher than the average sell volume of 173.04M, indicating strong investor interest. However, the volume trend is currently showing signs of deceleration, suggesting a potential cooling in market participation despite a dominant buyer sentiment.
Analyst Opinions
Recent analyst recommendations for Intel Corporation (INTC) have yielded a mixed outlook. Analysts have assigned a C+ rating, indicating a cautious stance. Key points from analysts include concerns over Intel’s price-to-earnings ratio, which is rated low, suggesting potential undervaluation but also risk. Conversely, the company’s price-to-book ratio is more favorable, indicating solid asset management. Given these factors, the consensus remains a cautious “hold” for 2025, as analysts weigh growth potential against current market challenges.
Stock Grades
Intel Corporation (ticker: INTC) has received recent evaluations from reputable grading companies, providing insight into its current market standing.
| Grading Company | Action | New Grade | Date |
|---|---|---|---|
| Tigress Financial | maintain | Buy | 2025-11-04 |
| Barclays | maintain | Equal Weight | 2025-10-27 |
| Wells Fargo | maintain | Equal Weight | 2025-10-24 |
| Mizuho | maintain | Neutral | 2025-10-24 |
| JP Morgan | maintain | Underweight | 2025-10-24 |
| Truist Securities | maintain | Hold | 2025-10-24 |
| Rosenblatt | maintain | Sell | 2025-10-24 |
| Needham | maintain | Hold | 2025-10-24 |
| TD Cowen | maintain | Hold | 2025-10-24 |
| Morgan Stanley | maintain | Equal Weight | 2025-10-24 |
Overall, the grades indicate a mixed sentiment towards Intel Corporation, with a range from “Buy” to “Sell.” Notably, multiple firms have chosen to maintain their previous ratings, suggesting a cautious yet stable outlook in the face of market conditions.
Target Prices
The consensus target price for Intel Corporation (INTC) reflects a mix of optimistic and cautious outlooks from analysts.
| Target High | Target Low | Consensus |
|---|---|---|
| 52 | 20 | 35.22 |
Analysts expect Intel’s stock to have a wide range of potential outcomes, indicating varying levels of confidence in its future performance.
Consumer Opinions
Consumer sentiment surrounding Intel Corporation (INTC) reflects a mix of enthusiasm and frustration, as customers navigate the evolving landscape of technology.
| Positive Reviews | Negative Reviews |
|---|---|
| “Intel’s processors are powerful and reliable.” | “Customer service has been slow to respond.” |
| “I appreciate the consistent updates and improvements.” | “Some products are overpriced compared to competitors.” |
| “Great performance in gaming applications.” | “Issues with overheating in certain models.” |
Overall, feedback on Intel Corporation indicates strong appreciation for product performance and reliability, while concerns about customer service responsiveness and pricing persist among consumers.
Risk Analysis
In evaluating Intel Corporation (INTC), it’s essential to consider various risks that may affect its performance and stock value. Below is a summary of key risks to keep in mind:
| Category | Description | Probability | Impact |
|---|---|---|---|
| Market Competition | Intense competition from AMD and NVIDIA affecting market share. | High | High |
| Supply Chain | Disruptions in semiconductor supply chains could delay production. | Medium | High |
| Technological | Rapid technological advancements may render current products obsolete. | High | Medium |
| Regulatory | Potential regulatory changes affecting operations and costs. | Medium | Medium |
| Economic | Global economic downturn could reduce demand for technology products. | Medium | High |
In my analysis, the most pressing risks for Intel are its high competition and potential supply chain disruptions, especially given the increasing demand for semiconductors in various sectors.
Should You Buy Intel Corporation?
Intel Corporation’s flagship products include microprocessors and integrated circuits, but the company is currently facing significant challenges, exemplified by a net margin of -35.32%, a return on invested capital (ROIC) that is not reported, and a weighted average cost of capital (WACC) of 8.47%. Despite its strong brand and technological capabilities, recent risks such as increased competition and supply chain issues are concerning.
Given Intel’s current net margin of -35.32%, I recommend waiting for the fundamentals to improve before considering an investment. The long-term trend has been bearish, and buyer volumes, although present, do not indicate a strong enough recovery signal. Therefore, it may be prudent to observe the stock for signs of a bullish reversal and improved financial performance before making any long-term commitments.
Specific risks include heightened competition in the semiconductor industry and ongoing supply chain disruptions that could impact operational efficiency and profitability.
Disclaimer: This article is not financial advice. Each investor is responsible for their own investment decisions.
Additional Resources
- Y.D. More Investments Ltd Raises Position in Intel Corporation $INTC – MarketBeat (Nov 16, 2025)
- Intel Appoints Dr. Craig H. Barratt to Board of Directors – intc.com (Nov 10, 2025)
- Intel (NASDAQ:INTC) Is Posting Solid Earnings, But It Is Not All Good News – Yahoo Finance (Nov 13, 2025)
- Intel’s Incredible Rally Might Be Over (Rating Downgrade) (NASDAQ:INTC) – Seeking Alpha (Nov 13, 2025)
- Intel Corporation $INTC Shares Acquired by Letko Brosseau & Associates Inc. – MarketBeat (Nov 16, 2025)
For more information about Intel Corporation, please visit the official website: intel.com


