T-Mobile US, Inc. revolutionizes the way we communicate, driving innovation in the telecommunications landscape and connecting over 108M customers daily. As a powerhouse in mobile communications, T-Mobile offers a robust portfolio of services, including voice, messaging, and data, alongside cutting-edge devices. With a reputation for quality and market influence, the company consistently challenges the status quo. As we delve into T-Mobile’s financials, I invite you to consider: do its fundamentals still justify its current market valuation?

Table of contents
Company Description
T-Mobile US, Inc. (NASDAQ: TMUS), founded in 1994 and headquartered in Bellevue, Washington, is a leading player in the telecommunications services industry. The company provides mobile communication services to approximately 108.7M customers across the United States, Puerto Rico, and the U.S. Virgin Islands. T-Mobile offers a wide range of products, including voice, messaging, and data services, along with wireless devices such as smartphones, wearables, and tablets, under the T-Mobile and Metro by T-Mobile brands. With a robust infrastructure of around 102K macro cell sites and 41K small cell sites, T-Mobile is well-positioned to innovate and shape the future of mobile connectivity, emphasizing customer-centric solutions and competitive pricing strategies.
Fundamental Analysis
In this section, I will conduct a fundamental analysis of T-Mobile US, Inc., examining its income statement, financial ratios, and dividend payout policy.
Income Statement
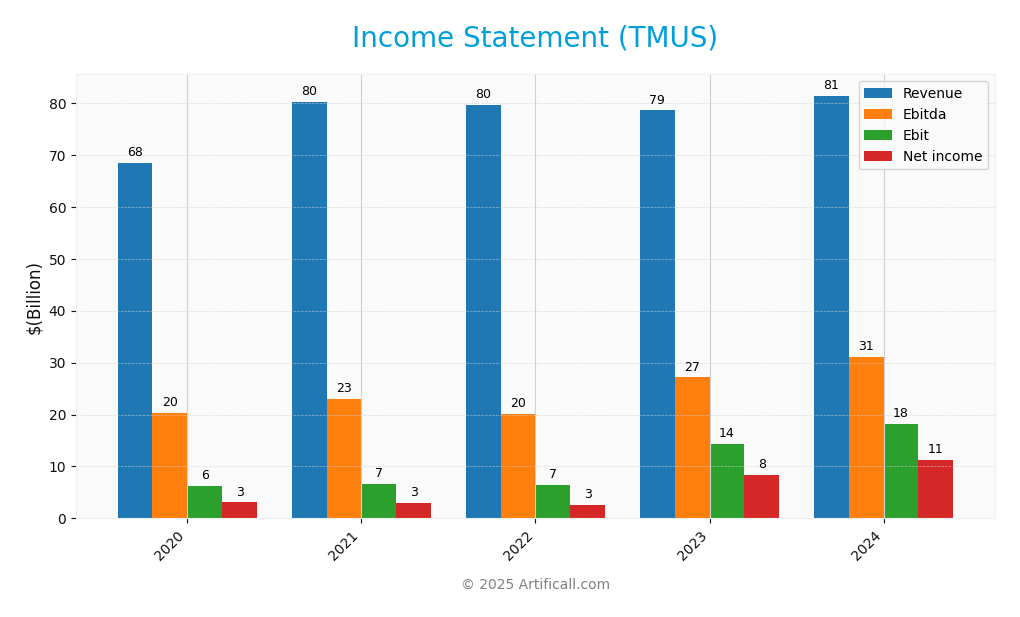
The following table outlines the Income Statement for T-Mobile US, Inc. (TMUS) over the past five fiscal years, providing insight into revenue, expenses, and net income.

| 2020 | 2021 | 2022 | 2023 | 2024 | |
|---|---|---|---|---|---|
| Revenue | 68.40B | 80.12B | 79.57B | 78.56B | 81.40B |
| Cost of Revenue | 28.27B | 36.61B | 36.21B | 30.19B | 29.65B |
| Operating Expenses | 33.50B | 36.62B | 36.82B | 34.10B | 33.74B |
| Gross Profit | 40.13B | 43.51B | 43.37B | 48.37B | 51.75B |
| EBITDA | 20.38B | 23.08B | 20.16B | 27.15B | 31.04B |
| EBIT | 6.23B | 6.69B | 6.51B | 14.33B | 18.12B |
| Interest Expense | 2.70B | 3.34B | 3.36B | 3.34B | 3.41B |
| Net Income | 3.06B | 3.02B | 2.59B | 8.32B | 11.34B |
| EPS | 2.68 | 2.42 | 2.07 | 7.02 | 9.70 |
| Filing Date | 2021-02-23 | 2022-02-11 | 2023-02-14 | 2024-02-02 | 2025-01-31 |
Over the five-year period, T-Mobile US, Inc. has demonstrated a steady increase in revenue from 68.40B in 2020 to 81.40B in 2024, reflecting robust growth strategies. Net income has shown a remarkable upward trajectory, escalating from 3.06B in 2020 to 11.34B in 2024, indicating improved profitability and operational efficiency. The gross profit margin has also slightly improved, suggesting effective cost management. In the most recent year, while revenue growth continued, margins remained stable, and the increase in net income was substantial, indicating a healthy business environment and successful expense management.
Financial Ratios
Here is a summary of T-Mobile US, Inc.’s financial ratios over the last available years:
| Ratio | 2020 | 2021 | 2022 | 2023 | 2024 |
|---|---|---|---|---|---|
| Net Margin | 4.48% | 3.77% | 3.25% | 10.59% | 13.93% |
| ROE | 5.36% | 5.51% | 4.65% | 12.86% | 14.33% |
| ROIC | 4.80% | 4.41% | 3.53% | 10.93% | 10.79% |
| P/E | 50.36 | 47.83 | 67.55 | 22.85 | 22.76 |
| P/B | 2.36 | 2.09 | 2.51 | 2.94 | 4.18 |
| Current Ratio | 1.10 | 0.89 | 0.77 | 0.91 | 0.91 |
| Quick Ratio | 0.98 | 0.78 | 0.69 | 0.83 | 0.83 |
| D/E | 1.64 | 1.57 | 1.60 | 1.76 | 1.85 |
| Debt-to-Assets | 53.58% | 52.68% | 52.90% | 54.81% | 54.99% |
| Interest Coverage | 2.46 | 2.06 | 1.95 | 4.28 | 5.28 |
| Asset Turnover | 0.34 | 0.39 | 0.38 | 0.38 | 0.39 |
| Fixed Asset Turnover | 0.95 | 1.14 | 1.07 | 1.11 | 1.21 |
| Dividend Yield | 0.00% | 0.00% | 0.00% | 0.39% | 1.28% |
Interpretation of Financial Ratios
In 2024, T-Mobile US’s ratios display significant improvements, particularly in net margin and interest coverage, which indicate enhanced profitability and a stronger ability to meet interest obligations. However, the high P/E ratio suggests that the stock may be overvalued relative to earnings, and the elevated D/E ratio raises concerns about leverage and financial risk.
Evolution of Financial Ratios
Over the past five years, T-Mobile’s financial ratios have generally improved, particularly in profitability metrics like net margin and interest coverage. However, the rising P/B and D/E ratios indicate increasing leverage and potentially higher risk, which investors should monitor closely.
Distribution Policy
T-Mobile US, Inc. (TMUS) has a modest dividend payout ratio of 29%, reflecting a commitment to returning value to shareholders, with a current annual dividend yield of approximately 1.28%. The company also engages in share buyback programs, which can enhance shareholder value. However, there are potential risks related to unsustainable distributions if cash flows do not meet expectations. Overall, TMUS’s distribution strategy appears to support long-term value creation, balancing returns with growth investments.
Sector Analysis
T-Mobile US, Inc. is a key player in the telecommunications services industry, known for its competitive pricing and extensive network coverage. The company’s strengths include strong brand recognition and a diverse product portfolio, while weaknesses may involve market saturation and intense competition.
Strategic Positioning
T-Mobile US, Inc. (TMUS) holds a significant market share in the telecommunications services sector, serving approximately 108.7M customers. With a market capitalization of $241.7B, the company faces intense competitive pressure from major players like Verizon and AT&T, which impacts pricing strategies and service offerings. Technological disruption, particularly with the advent of 5G technology, presents both challenges and opportunities; T-Mobile has made substantial investments in infrastructure to enhance its service capabilities. This proactive approach positions the company favorably against competitors, although it must remain vigilant in adapting to evolving market demands and innovations.
Revenue by Segment
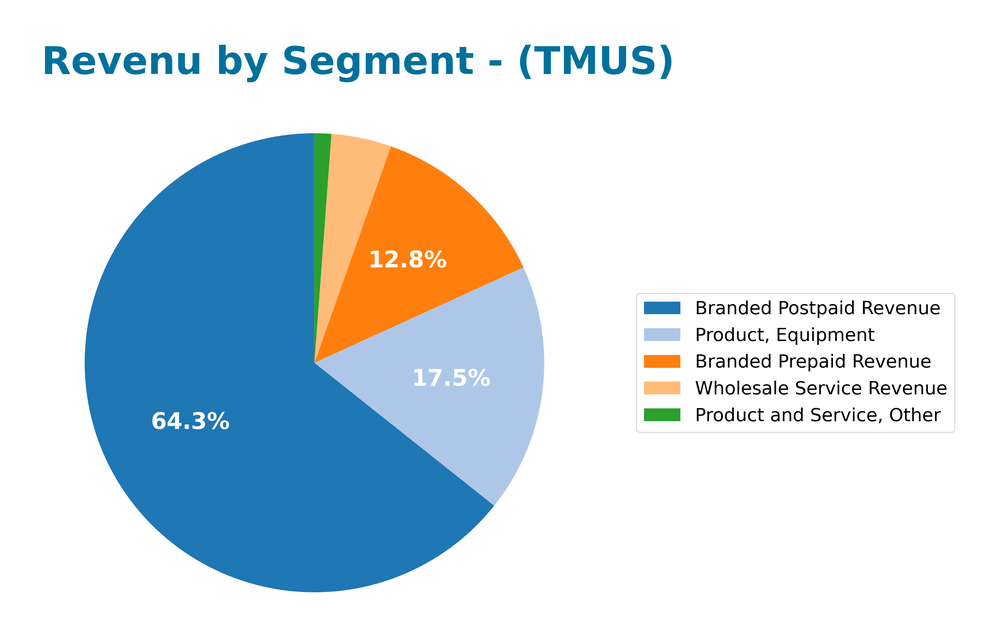
The following chart illustrates T-Mobile US, Inc.’s revenue distribution by segment for the fiscal year ending December 31, 2024.

In 2024, T-Mobile’s revenue segments reflected a robust performance, particularly in Branded Postpaid Revenue, which reached 52.3B, showing a significant year-over-year increase. The Branded Prepaid segment also contributed 10.4B, while Wholesale Service Revenue decreased to 3.4B, indicating a notable shift in revenue dynamics. Despite the overall growth, the Product and Service, Other segment saw a decline to 959M, which may raise concerns about diversification and margin risks going forward. The accelerated growth in key segments suggests strong market traction, although reliance on branded services poses concentration risks.
Key Products
T-Mobile US, Inc. offers a diverse range of products and services tailored to meet the needs of its customers. Below is a table outlining some of the key products provided by the company.
| Product | Description |
|---|---|
| Mobile Plans | Comprehensive postpaid and prepaid mobile plans offering unlimited voice, messaging, and data. |
| Smartphones | A wide selection of latest smartphones from top brands including Apple, Samsung, and Google. |
| Wearables | Connected devices such as smartwatches and fitness trackers that sync with mobile services. |
| Tablets | Portable tablets designed for on-the-go connectivity and entertainment. |
| Home Internet | High-speed internet service providing reliable connectivity for homes and businesses. |
| T-Mobile App | A mobile application that allows customers to manage their accounts, pay bills, and access support. |
| Metro by T-Mobile | A budget-friendly wireless service offering affordable plans with no annual contracts. |
| Accessories | A variety of mobile accessories including cases, chargers, and headphones to enhance user experience. |
These products reflect T-Mobile’s commitment to providing innovative and accessible telecommunications services to its extensive customer base.
Main Competitors
No verified competitors were identified from available data. T-Mobile US, Inc. holds a significant position in the telecommunications sector, serving approximately 108.7M customers across the United States, Puerto Rico, and the U.S. Virgin Islands. Given its market cap of about $242B, T-Mobile is a dominant player in the mobile communications market, particularly in the postpaid and prepaid segments.
Competitive Advantages
T-Mobile US, Inc. (TMUS) boasts several competitive advantages that position it favorably in the telecommunications market. With a robust customer base of 108.7M and a strong market cap of 241.7B, the company benefits from economies of scale. Its commitment to innovation is highlighted by its ongoing rollout of 5G services and expansion into new markets, including rural areas. Additionally, T-Mobile’s diverse product offerings, including smartphones and wearables, and its strong presence in both retail and online channels enhance customer accessibility. Looking ahead, opportunities in IoT and enhanced service plans could further drive growth and solidify its market leadership.
SWOT Analysis
This analysis aims to evaluate the internal and external factors affecting T-Mobile US, Inc. (TMUS) to inform strategic decisions.
Strengths
- Strong market position
- Diverse service offerings
- Solid customer base
Weaknesses
- High competition
- Dependence on technology
- Limited international presence
Opportunities
- 5G expansion
- Growth in wireless devices
- Strategic partnerships
Threats
- Regulatory challenges
- Market saturation
- Economic downturns
The overall SWOT assessment highlights T-Mobile’s robust market presence and growth opportunities, which should inform its strategy for expanding its service offerings and navigating competitive threats effectively.
Stock Analysis
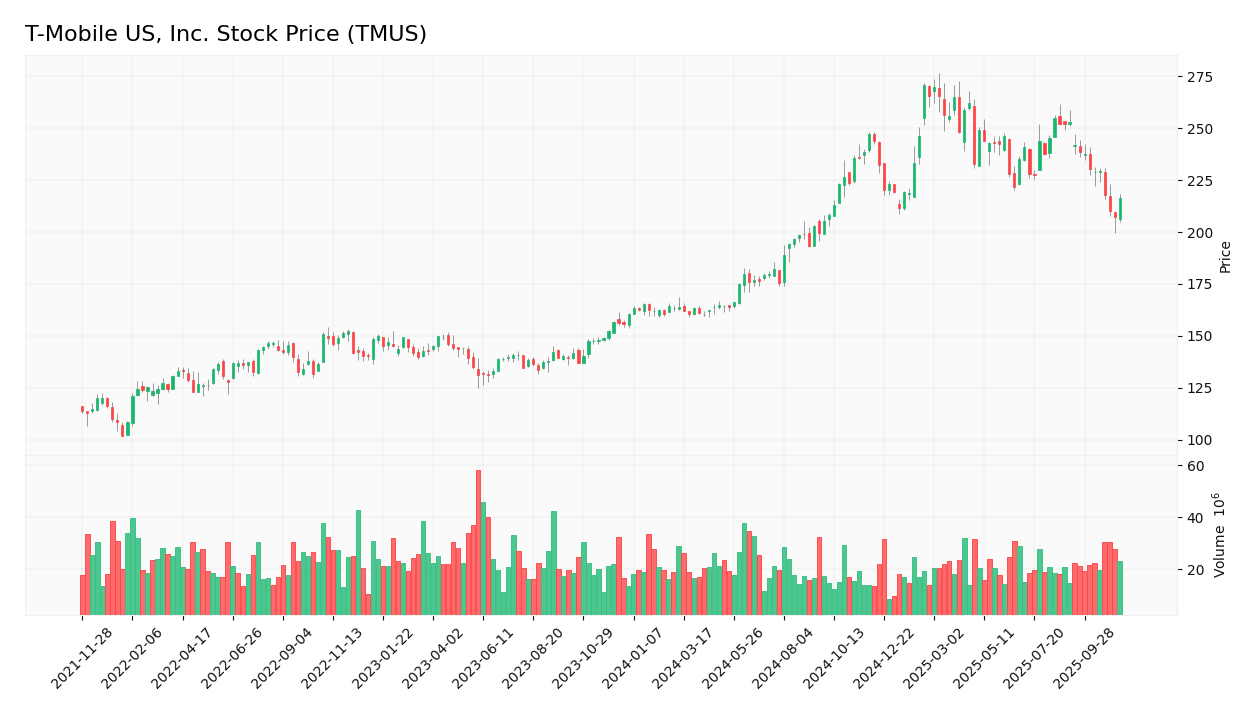
In analyzing T-Mobile US, Inc. (TMUS), the weekly stock price chart reveals significant price movements and trading dynamics over the past year, with a notable bullish trend supported by a substantial percentage increase.

Trend Analysis
Over the past year, TMUS has experienced a price change of +38.77%, indicating a bullish trend. Despite this overall positive movement, recent performance over the last 11 weeks shows a decline of -14.25%, suggesting a bearish trend during this shorter period. The highest price recorded was 270.82, while the lowest reached 155.71. The trend is characterized by deceleration, which may suggest a need for caution among investors, especially with a standard deviation of 35.01 indicating considerable volatility.
Volume Analysis
In the last three months, trading volumes have averaged approximately 22.82M, with buyer activity being seller-dominant, as indicated by an average sell volume of 12.69M compared to an average buy volume of 10.12M. This suggests a slight decline in investor sentiment, despite the overall bullish volume trend. The increasing average volume indicates heightened market participation, which may reflect a cautious approach from investors in light of recent price fluctuations.
Analyst Opinions
Recent analyst recommendations for T-Mobile US, Inc. (TMUS) have been predominantly positive. Analysts rate the stock as a “Buy,” reflecting strong metrics such as a solid return on equity and return on assets. The firm’s discounted cash flow and price-to-earnings scores indicate moderate concerns, but overall, the financial health appears robust. Notably, the analysts emphasize TMUS’s ability to maintain competitive market positioning. The consensus for the current year leans towards a “Buy,” suggesting a favorable outlook for potential investors.
Stock Grades
T-Mobile US, Inc. (TMUS) has recently received consistent evaluations from various reputable grading companies, indicating a stable outlook for the stock.
| Grading Company | Action | New Grade | Date |
|---|---|---|---|
| Tigress Financial | Maintain | Buy | 2025-11-11 |
| Morgan Stanley | Maintain | Overweight | 2025-10-27 |
| Barclays | Maintain | Overweight | 2025-10-24 |
| TD Cowen | Maintain | Buy | 2025-10-24 |
| Wells Fargo | Upgrade | Overweight | 2025-10-16 |
| RBC Capital | Upgrade | Outperform | 2025-10-14 |
| Benchmark | Maintain | Buy | 2025-10-10 |
| Scotiabank | Maintain | Sector Outperform | 2025-10-06 |
| JP Morgan | Maintain | Overweight | 2025-09-30 |
| RBC Capital | Maintain | Sector Perform | 2025-07-25 |
Overall, the trend in grades for TMUS shows a positive sentiment, with multiple upgrades and a majority maintaining strong ratings. This suggests that analysts have confidence in T-Mobile’s performance going forward, making it a potentially attractive option for investors.
Target Prices
The current consensus among analysts for T-Mobile US, Inc. (TMUS) indicates a positive outlook.
| Target High | Target Low | Consensus |
|---|---|---|
| 310 | 263 | 281.71 |
Overall, the target prices suggest that analysts expect T-Mobile to perform well, with a median target reflecting a solid growth potential.
Consumer Opinions
Consumer sentiment surrounding T-Mobile US, Inc. (TMUS) reveals a mix of praise and criticism, reflecting both the strengths and areas for improvement within their services.
| Positive Reviews | Negative Reviews |
|---|---|
| Excellent network coverage and reliability. | Customer service can be slow to respond. |
| Affordable plans with no hidden fees. | Some areas experience inconsistent data speeds. |
| User-friendly app for managing accounts. | Occasional billing issues reported. |
Overall, consumer feedback highlights T-Mobile’s strong network reliability and affordability as major strengths, while customer service response times and occasional billing issues are noted as weaknesses.
Risk Analysis
In evaluating T-Mobile US, Inc. (TMUS), it’s crucial to understand the potential risks that could impact investment decisions. Below is a summary of key risks associated with the company.
| Category | Description | Probability | Impact |
|---|---|---|---|
| Market Competition | Intense competition from Verizon and AT&T could erode market share. | High | High |
| Regulatory Changes | New regulations in the telecom industry may affect operational costs. | Medium | Medium |
| Technological Shift | Rapid technology advancements may require constant investment in infrastructure. | High | High |
| Economic Downturn | A recession could reduce consumer spending on mobile services. | Medium | High |
| Cybersecurity Threats | Increased cyber threats could compromise customer data and trust. | High | High |
In summary, the most probable and impactful risks for TMUS include intense market competition and cybersecurity threats, both of which could significantly affect its financial performance and reputation.
Should You Buy T-Mobile US, Inc.?
T-Mobile US, Inc. has shown strong performance with a net profit margin of 13.93% and a robust return on invested capital (ROIC) of 10.62%, which exceeds its weighted average cost of capital (WACC) of 4.95%. The company benefits from a competitive edge due to its extensive network, innovative services, and growing customer base, although it faces ongoing risks from market competition and regulatory pressures.
Given the current financial metrics—net margin > 0, ROIC > WACC, and a long-term positive trend—the outlook appears favorable for long-term investors. However, with recent trends indicating seller dominance in trading volumes, I recommend waiting for a return of buyer volumes before making any additions to your portfolio.
A specific risk to keep in mind includes the intense competition in the telecom sector, which could pressure margins and growth.
Disclaimer: This article is not financial advice. Each investor is responsible for their own investment decisions.
Additional Resources
- T-Mobile US, Inc. to Present at the Wells Fargo TMT Summit – Business Wire (Nov 11, 2025)
- T-Mobile US Inc (TMUS) Q3 2025 Earnings Call Highlights: Record Postpaid Growth and Strategic … – Yahoo Finance (Oct 23, 2025)
- T-Mobile: Pullback Is Attractive For Long-Term Investors (Rating Upgrade) (NASDAQ:TMUS) – Seeking Alpha (Nov 10, 2025)
- Srinivasan Gopalan Bought 12% More Shares In T-Mobile US – simplywall.st (Nov 12, 2025)
- T-Mobile Is The Most Oversold Mega-Cap Stock—Time to Buy? – Investing.com (Nov 13, 2025)
For more information about T-Mobile US, Inc., please visit the official website: t-mobile.com


