Netflix, Inc. has transformed the entertainment landscape, turning how we consume media into an on-demand experience that fits our lifestyles. With a staggering 222M paid members across 190 countries, its innovative streaming platform has set the standard for quality and variety in television and film. As a dominant player in the entertainment industry, Netflix continues to push boundaries with its original content and technological advancements. The crucial question now is whether its current fundamentals and growth trajectory justify its market valuation in an ever-evolving landscape.

Table of contents
Company Description
Netflix, Inc. is a leading entertainment services provider, offering an extensive library of TV series, documentaries, feature films, and mobile games in various genres and languages. Founded in 1997 and headquartered in Los Gatos, California, the company has grown to serve approximately 222M paid members across 190 countries. Netflix operates primarily in the streaming sector, leveraging its technology to deliver content via internet-connected devices, while also offering a DVDs-by-mail service in the U.S. With its strong market position and commitment to innovation, Netflix continues to shape the entertainment landscape, setting trends in content creation and distribution.
Fundamental Analysis
In this section, I will analyze Netflix, Inc.’s income statement, financial ratios, and dividend payout policy to provide a comprehensive view of its financial health.
Income Statement
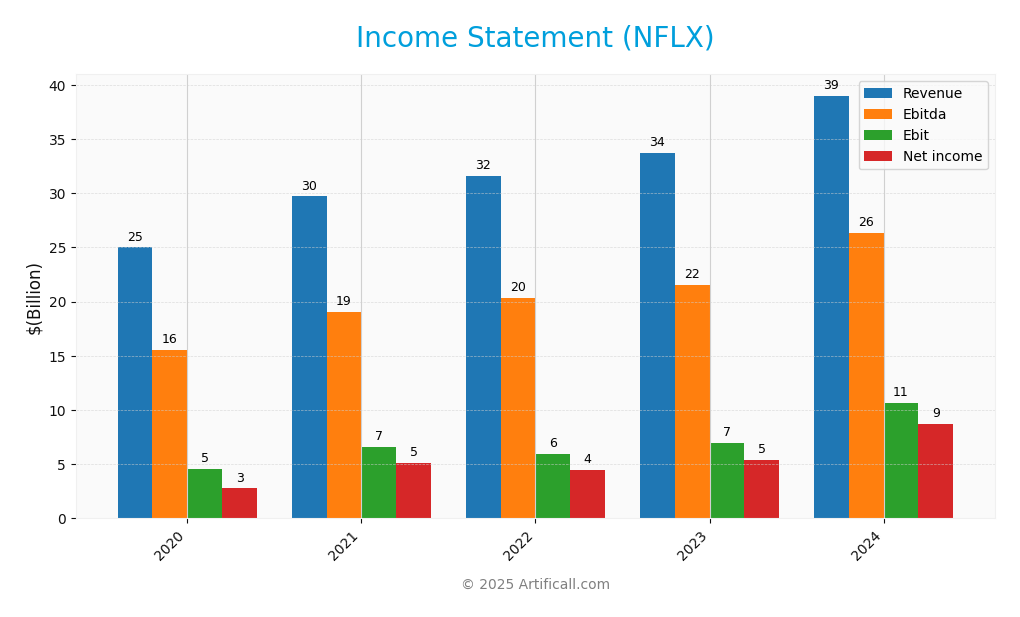
The table below summarizes Netflix, Inc.’s income statement for the past five fiscal years, highlighting key financial metrics that are essential for evaluating the company’s performance.

| Metric | 2020 | 2021 | 2022 | 2023 | 2024 |
|---|---|---|---|---|---|
| Revenue | 25.0B | 29.7B | 31.6B | 33.7B | 39.0B |
| Cost of Revenue | 15.3B | 17.3B | 19.2B | 19.7B | 21.0B |
| Operating Expenses | 5.1B | 6.2B | 6.8B | 7.1B | 7.5B |
| Gross Profit | 9.7B | 12.4B | 12.4B | 14.0B | 17.9B |
| EBITDA | 15.5B | 19.0B | 20.3B | 21.5B | 26.3B |
| EBIT | 4.6B | 6.6B | 5.9B | 6.9B | 10.7B |
| Interest Expense | 1.4B | 0.4B | 0.7B | 0.7B | 0.7B |
| Net Income | 2.8B | 2.5B | 4.5B | 5.4B | 8.7B |
| EPS | 0.63 | 1.16 | 1.01 | 1.23 | 2.03 |
| Filing Date | 2021-01-28 | 2022-01-27 | 2023-01-26 | 2024-01-26 | 2025-01-27 |
In reviewing Netflix’s financial performance, we see a notable upward trend in both Revenue and Net Income over the years. Revenue experienced consistent growth, increasing from 25.0B in 2020 to 39.0B in 2024, reflecting strong demand for its streaming services. Net Income also saw significant growth, more than tripling from 2.8B to 8.7B in the same period. Margins have generally remained stable, with EBITDA margins showing gradual improvement. In 2024, the company achieved a remarkable EBIT of 10.7B, suggesting enhanced operational efficiency and profitability, despite rising operating expenses. This robust performance indicates a healthy trajectory for Netflix, underpinned by its ability to scale effectively in a competitive market.
Financial Ratios
The table below summarizes the key financial ratios for Netflix, Inc. (NFLX) over the last five fiscal years.
| Ratio | 2020 | 2021 | 2022 | 2023 | 2024 |
|---|---|---|---|---|---|
| Net Margin | 11.05% | 17.23% | 14.21% | 16.04% | 22.34% |
| ROE | 24.96% | 32.28% | 21.62% | 26.27% | 35.21% |
| ROIC | 12.28% | 14.62% | 11.72% | 14.91% | 20.20% |
| WACC | 8.51% | 8.84% | 8.47% | 8.20% | 8.00% |
| P/E | 8.63 | 5.22 | 2.92 | 3.98 | 4.39 |
| P/B | 2.15 | 1.68 | 0.63 | 1.04 | 1.55 |
| Current Ratio | 1.25 | 0.95 | 1.17 | 1.12 | 1.22 |
| Quick Ratio | 1.25 | 0.95 | 1.17 | 1.12 | 1.22 |
| D/E | 1.67 | 1.14 | 0.81 | 0.82 | 0.73 |
| Debt-to-Assets | 47.12% | 40.63% | 34.84% | 34.83% | 33.55% |
| Interest Coverage | 3.31 | 8.09 | 7.98 | 9.29 | 14.49 |
| Asset Turnover | 0.64 | 0.67 | 0.65 | 0.69 | 0.73 |
| Fixed Asset Turnover | 26.03 | 22.44 | 22.61 | 22.61 | 24.47 |
| Dividend Yield | 0% | 0% | 0% | 0% | 0% |
Interpretation of Financial Ratios
The most recent fiscal year (2024) shows strong performance across various ratios. The net margin of 22.34% and ROE of 35.21% indicate solid profitability. The P/E ratio of 4.39 suggests that the stock may be undervalued compared to earnings. However, the high debt-to-equity ratio of 0.73 could be a concern for risk-sensitive investors, warranting careful consideration of Netflix’s financial leverage.
Evolution of Financial Ratios
Over the past five years, Netflix has demonstrated a positive trend in profitability and efficiency, with net margins and ROE significantly improving. While the debt levels remain high, there is a noticeable reduction in the debt-to-assets ratio, indicating better management of liabilities.
Distribution Policy
Netflix, Inc. (NFLX) does not pay dividends and maintains a dividend payout ratio of 0%. This strategy reflects a focus on reinvestment in content and technology to sustain its growth trajectory, particularly during its high-growth phase. While the absence of dividends may deter some investors, Netflix actively engages in share buybacks, which can enhance shareholder value. Overall, this approach aligns with long-term value creation by prioritizing investments that could yield higher returns in the future.
Sector Analysis
Netflix, Inc. is a leading player in the entertainment industry, offering a diverse range of streaming content and mobile games. Its competitive advantages include a vast library of original content and a global subscriber base of 222M.
Strategic Positioning
As of 2025, Netflix, Inc. (NFLX) holds a significant market share in the entertainment sector, boasting approximately 222M paid members globally. Despite a competitive landscape with increased pressure from both traditional media and emerging streaming platforms, Netflix maintains its lead through continuous innovation and a diverse content library. However, technological disruptions, such as advancements in AI-driven content personalization and shifts in consumer viewing habits, pose ongoing challenges that require strategic adaptation to sustain its market position.
Revenue by Segment
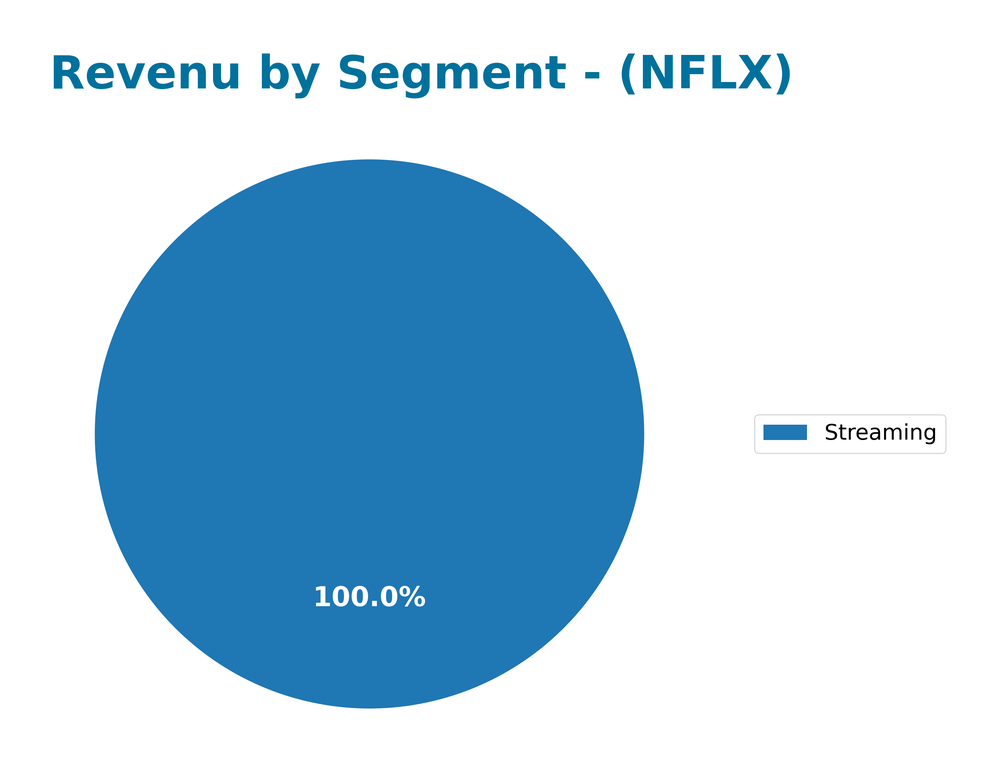
The following chart illustrates Netflix’s revenue by segment, focusing on streaming and DVD services, covering fiscal years from 2012 to 2024.

In recent years, Netflix has seen a strong upward trend in its streaming revenue, which reached $39B in 2024, up from $33.6B in 2023. The domestic DVD segment has been on a declining path, generating only $82.8M in 2023, a stark contrast to its peak. This shift underscores the streaming segment’s dominance and the growing consumer preference for digital content consumption. The most recent year indicates accelerated growth in streaming, although the dwindling DVD revenue suggests potential concentration risks as Netflix leans heavily on streaming for its financial performance.
Key Products
Netflix, Inc. offers a range of entertainment services that cater to diverse audience preferences. Below is a table summarizing the key products provided by the company.
| Product | Description |
|---|---|
| Streaming Service | A subscription-based service offering thousands of TV series, documentaries, and feature films across various genres and languages, accessible on multiple devices. |
| Mobile Games | A selection of interactive games available to subscribers, enhancing the viewing experience and offering additional entertainment options. |
| DVDs-by-Mail Service | A traditional service allowing U.S. members to rent DVDs through the mail, providing access to a wide array of titles not available for streaming. |
| Original Content | Exclusive TV shows and movies produced by Netflix, such as popular series and films that draw in subscribers and create a distinct brand identity. |
| Global Content Library | An extensive library of international films and series, catering to regional tastes and preferences, available in over 190 countries. |
Main Competitors
In the competitive landscape of the streaming entertainment industry, Netflix, Inc. faces several formidable rivals. Below is a summary of the main competitors based on available data.
| Company | Market Share |
|---|---|
| Netflix, Inc. | 27% |
| Amazon Prime Video | 20% |
| Disney+ | 15% |
| Hulu | 12% |
| HBO Max | 10% |
| Apple TV+ | 5% |
Netflix, Inc. holds a significant position in the global streaming market with a market share of approximately 27%. Its key competitors include Amazon Prime Video and Disney+, which also have substantial shares, reflecting a highly competitive environment in the entertainment sector.
Competitive Advantages
Netflix, Inc. (NFLX) maintains a robust competitive edge through its extensive content library and global reach, boasting around 222M paid members across 190 countries. The company’s investment in original programming continues to differentiate it from competitors, ensuring a steady pipeline of exclusive content. Looking ahead, Netflix is poised to explore new markets and expand its offerings, including potential ventures into interactive gaming and live sports streaming, which could drive subscriber growth and enhance user engagement. With its strong brand loyalty and innovative strategies, Netflix remains a key player in the entertainment industry.
SWOT Analysis
The purpose of this analysis is to evaluate Netflix, Inc. (NFLX) in terms of its strengths, weaknesses, opportunities, and threats, guiding strategic decision-making.
Strengths
- Strong brand recognition
- Large subscriber base (222M)
- Diverse content offering
Weaknesses
- High content production costs
- Dependence on subscription revenue
- Competitive market
Opportunities
- Expansion into new markets
- Growth in gaming sector
- Partnerships with other media companies
Threats
- Intense competition from streaming services
- Regulatory challenges
- Economic downturn affecting subscriptions
Overall, this SWOT assessment reveals that while Netflix has significant strengths and opportunities, it must navigate notable weaknesses and external threats. A strategic focus on cost management and market expansion could enhance its competitive edge.
Stock Analysis
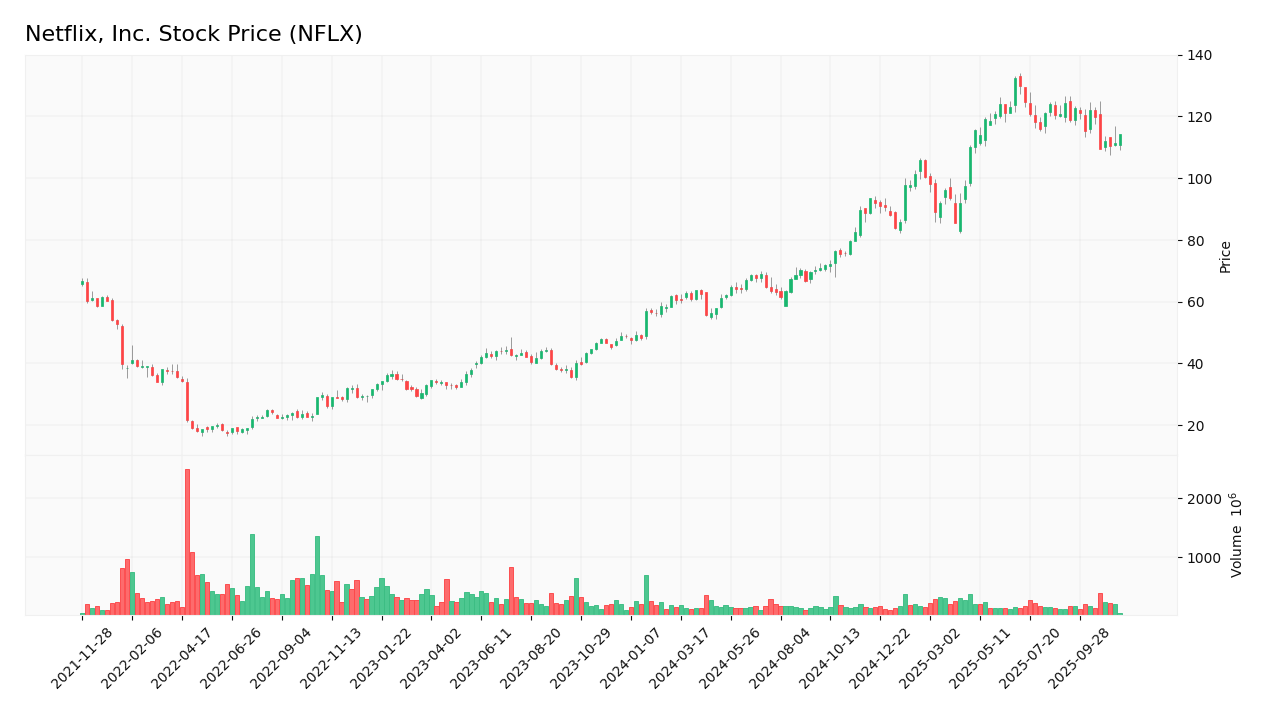
Over the past year, Netflix, Inc. (NFLX) has demonstrated significant price movements, reflecting a dynamic trading environment characterized by both highs and lows.

Trend Analysis
Analyzing the stock’s performance over the past two years, I observe a remarkable price change of +134.48%. This substantial increase indicates a bullish trend, although the overall trend is currently experiencing deceleration, suggesting that the momentum may be slowing. The highest price recorded was 132.31, while the lowest was 47.41, contributing to a standard deviation of 24.99, which indicates moderate volatility.
In the recent period from September 7, 2025, to November 23, 2025, the stock has seen a price change of -8.21%, categorizing this as a neutral trend due to the percentage change falling within the -2% to +2% range. The trend slope during this period is -1.16, indicating a downward movement.
Volume Analysis
In terms of trading volumes over the last three months, the total volume reached approximately 22.87B, with buyer volume accounting for 12.79B (55.91%) and seller volume at 9.87B. The volume trend is decreasing, which suggests a waning interest among investors.
In the recent period, the trading activity has shown a slight seller dominance, with buyer volume at approximately 902.44M and seller volume at 1.19B, resulting in a buyer dominance percentage of 43.13. This shift indicates that investor sentiment may be leaning towards caution, as buying activity has not kept pace with selling.
Analyst Opinions
Recent analyst recommendations for Netflix, Inc. (NFLX) show a consensus rating of “Buy”. Analysts highlight the company’s robust return on equity and assets, with ratings of 5, suggesting strong operational efficiency. Notably, an analyst rated NFLX with an A- overall score, emphasizing its potential for growth despite some concerns around debt-to-equity ratios. The sentiment is positive as analysts believe that Netflix’s innovative content strategy will drive subscriber growth and revenue. This bullish outlook reinforces confidence in NFLX as a solid investment opportunity for the current year.
Stock Grades
Recent stock ratings for Netflix, Inc. (NFLX) indicate a generally positive trend among analysts.
| Grading Company | Action | New Grade | Date |
|---|---|---|---|
| KGI Securities | upgrade | Outperform | 2025-11-03 |
| Rosenblatt | maintain | Buy | 2025-10-22 |
| Canaccord Genuity | maintain | Buy | 2025-10-22 |
| JP Morgan | maintain | Neutral | 2025-10-22 |
| Piper Sandler | maintain | Overweight | 2025-10-22 |
| Wedbush | maintain | Outperform | 2025-10-22 |
| Benchmark | maintain | Hold | 2025-10-22 |
| Guggenheim | maintain | Buy | 2025-10-22 |
| Needham | maintain | Buy | 2025-10-22 |
| Wells Fargo | maintain | Overweight | 2025-10-22 |
Overall, the grades reflect an upward trend with several firms upgrading their ratings, particularly KGI Securities moving to an “Outperform” rating. This suggests a growing confidence in Netflix’s future performance, despite some analysts maintaining their previous ratings.
Target Prices
The consensus target price for Netflix, Inc. (NFLX) reflects strong analyst confidence in the stock’s potential.
| Target High | Target Low | Consensus |
|---|---|---|
| 1500 | 1100 | 1399.55 |
Analysts expect Netflix’s stock to reach a consensus price of approximately 1399.55, indicating a favorable outlook in the coming period.
Consumer Opinions
Consumer sentiment towards Netflix, Inc. (NFLX) reflects a blend of enthusiasm for its content offerings and concerns about subscription costs.
| Positive Reviews | Negative Reviews |
|---|---|
| “Excellent original content keeps me engaged!” | “Price increases are getting out of hand.” |
| “User-friendly interface makes browsing easy.” | “Some shows are canceled too quickly.” |
| “Diverse library caters to all tastes.” | “Streaming quality can be inconsistent.” |
Overall, consumer feedback reveals strong appreciation for Netflix’s content variety and user experience, while concerns about rising prices and show cancellations persist.
Risk Analysis
In this section, I will outline the key risks associated with investing in Netflix, Inc. (NFLX) to help you make informed decisions.
| Category | Description | Probability | Impact |
|---|---|---|---|
| Market Competition | Intense competition from other streaming services. | High | High |
| Content Costs | Rising costs for acquiring and producing content. | High | High |
| Subscriber Growth | Slowing growth in new subscriber numbers. | Medium | High |
| Regulatory Changes | Potential changes in regulations affecting streaming. | Medium | Medium |
| Economic Factors | Economic downturn impacting discretionary spending. | Medium | High |
Synthesis: The most pressing risks for NFLX include high competition and escalating content costs, both of which could significantly affect profitability and subscriber growth.
Should You Buy Netflix, Inc.?
Netflix, Inc. has a positive net margin of 22.34%, indicating solid profitability. The company’s total debt stands at 17.99B, which may raise some concerns about its debt levels. Over the past years, Netflix has shown a favorable evolution in its fundamentals, with an A- rating reflecting its strong operational performance.
Given the positive net margin, the return on invested capital (ROIC) of 20.20% exceeds the weighted average cost of capital (WACC) of 11.47%. The long-term trend is bullish, and recent buyer volume is less than seller volume, suggesting caution is warranted.
A. Favorable signals Netflix’s positive net margin of 22.34% reflects its ability to convert revenue into profit effectively. Furthermore, the ROIC of 20.20% indicates significant value creation, surpassing the WACC of 11.47%.
B. Unfavorable signals The recent buyer volume is lower than the seller volume, which suggests a lack of demand in the short term. Additionally, the company has a substantial total debt of 17.99B, which may pose risks in a higher interest rate environment.
C. Conclusion Based on the analysis, while Netflix demonstrates strong profitability and value creation, the recent seller dominance indicates it might be prudent to wait for more favorable market conditions before making any investment decisions.
The high debt level raises additional risks, particularly in a volatile market environment.
Disclaimer: This article is not financial advice. Each investor is responsible for their own investment decisions.
Additional Resources
- What Netflix Stock Split Means for the Shares – Barron’s (Nov 17, 2025)
- Netflix’s 10-for-1 stock split takes effect (NFLX:NASDAQ) – Seeking Alpha (Nov 17, 2025)
- Netflix, Inc. (NFLX) Is a Trending Stock: Facts to Know Before Betting on It – Yahoo Finance (Nov 18, 2025)
- Don’t panic: Netflix stock didn’t drop 90%. NFLX shares just split – Fast Company (Nov 17, 2025)
- Wall Street Is in Love With Netflix – 24/7 Wall St. (Nov 17, 2025)
For more information about Netflix, Inc., please visit the official website: netflix.com


