Amazon.com, Inc. has revolutionized how we shop, stream, and connect, embedding itself into the fabric of daily life for millions. As a titan in the specialty retail industry, Amazon’s diverse offerings—from e-commerce to cloud computing with AWS—demonstrate its relentless commitment to innovation and quality. With a robust market presence and a reputation for reshaping consumer habits, I find myself questioning whether Amazon’s current fundamentals still align with its lofty market valuation and growth potential.

Table of contents
Company Description
Amazon.com, Inc. (AMZN), founded in 1994 and headquartered in Seattle, WA, is a global leader in specialty retail, engaging in the sale of consumer products and subscriptions through both online and physical stores. Operating primarily in North America and internationally, Amazon’s core activities span three segments: North America, International, and Amazon Web Services (AWS). The company offers a diverse range of products, including electronics like Kindle and Echo, as well as digital media and cloud services. With a workforce of approximately 1.56M employees, Amazon continues to shape the retail landscape through innovation and a robust ecosystem, positioning itself as a key player in e-commerce and technology services.
Fundamental Analysis
In this section, I will analyze Amazon.com, Inc.’s income statement, financial ratios, and dividend payout policy to assess its financial health and investment potential.
Income Statement
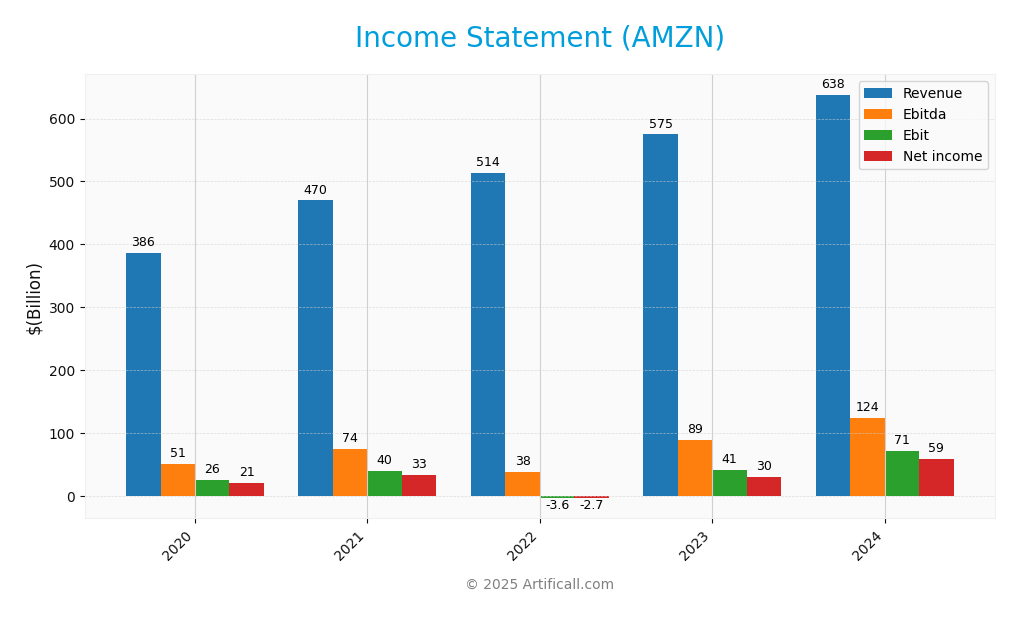
The following table provides a comprehensive overview of Amazon.com, Inc.’s income statement for the last five fiscal years, highlighting key financial metrics that are crucial for assessing the company’s performance.

| Metric | 2020 | 2021 | 2022 | 2023 | 2024 |
|---|---|---|---|---|---|
| Revenue | 386.1B | 469.8B | 514.0B | 574.8B | 638.0B |
| Cost of Revenue | 233.3B | 272.3B | 288.8B | 304.7B | 326.3B |
| Operating Expenses | 129.9B | 172.6B | 212.9B | 233.2B | 243.1B |
| Gross Profit | 152.8B | 197.5B | 225.2B | 270.0B | 311.7B |
| EBITDA | 51.0B | 74.4B | 38.4B | 89.4B | 123.8B |
| EBIT | 25.8B | 39.9B | -3.6B | 40.7B | 71.0B |
| Interest Expense | 1.6B | 1.8B | 2.4B | 3.2B | 2.4B |
| Net Income | 21.3B | 33.6B | -2.7B | 30.4B | 59.2B |
| EPS | 2.13 | 3.3 | -0.27 | 2.95 | 5.66 |
| Filing Date | 2021-02-03 | 2022-02-04 | 2023-02-03 | 2024-02-02 | 2025-02-07 |
Interpretation of Income Statement
Over the past five years, Amazon’s revenue has shown a robust upward trend, increasing from 386.1B in 2020 to 638.0B in 2024, reflecting a compound annual growth rate (CAGR) of approximately 27%. Net income has also rebounded significantly, moving from a loss of 2.7B in 2022 to 59.2B in 2024, indicating a strong recovery. The gross profit margin has improved, signaling better cost management and pricing power. Notably, the most recent year’s performance suggests a solid growth trajectory in both revenue and profitability, with EBITDA and net income margins indicating effective operational efficiencies.
Financial Ratios
Below is a table summarizing the key financial ratios for Amazon.com, Inc. (AMZN) over the past few years:
| Metric | 2020 | 2021 | 2022 | 2023 | 2024 |
|---|---|---|---|---|---|
| Net Margin | 5.53% | 7.10% | -0.53% | 5.29% | 9.29% |
| ROE | 22.84% | 24.13% | -1.86% | 15.07% | 20.72% |
| ROIC | 10.36% | 7.82% | 1.83% | 8.23% | 13.15% |
| P/E | 76.34 | 50.57 | -314.43 | 51.46 | 38.78 |
| P/B | 17.44 | 12.20 | 5.86 | 7.76 | 8.03 |
| Current Ratio | 1.05 | 1.14 | 0.94 | 1.05 | 1.06 |
| Quick Ratio | 0.86 | 0.91 | 0.72 | 0.84 | 0.87 |
| D/E | 0.90 | 0.84 | 0.96 | 0.67 | 0.46 |
| Debt-to-Assets | 26.27% | 27.68% | 30.28% | 25.69% | 20.95% |
| Interest Coverage | 13.90 | 13.75 | 5.17 | 11.58 | 28.51 |
| Asset Turnover | 1.20 | 1.12 | 1.11 | 1.09 | 1.02 |
| Fixed Asset Turnover | 2.56 | 2.17 | 2.03 | 2.08 | 1.94 |
| Dividend Yield | 0% | 0% | 0% | 0% | 0% |
This table provides a clear overview of the company’s financial performance and should assist investors in making informed decisions. Always remember to consider these ratios in conjunction with other financial metrics and market conditions when evaluating potential investments.
Interpretation of Financial Ratios
Analyzing Amazon.com, Inc. (AMZN) for FY 2024, I observe several key financial ratios that indicate its health. The liquidity ratios reflect reasonable short-term financial stability, with a current ratio of 1.06 and a quick ratio of 0.87, suggesting adequate coverage of short-term liabilities. However, the solvency ratio at 0.33 raises some concerns about long-term financial stability. Profitability metrics show a net profit margin of 9.29% and an EBIT margin of 6.54%, indicating that while Amazon is generating profits, the margins may be under pressure. Efficiency ratios, such as the asset turnover of 1.02, indicate effectively utilizing assets for revenue generation. Overall, while there are strengths, the solvency and profitability margins suggest potential caution for investors.
Evolution of Financial Ratios
Over the past five years, Amazon’s financial ratios have shown a mixed trend. While profitability has improved with net profit margins rising from negative to positive, liquidity ratios have remained relatively stable, indicating a consistent approach to managing short-term obligations. However, the solvency ratio has fluctuated, highlighting ongoing financial challenges that need monitoring.
Distribution Policy
Amazon.com, Inc. (AMZN) does not pay dividends, aligning with its strategy of reinvesting profits for growth and innovation. The company focuses on expanding its market share and investing heavily in research and development. While this approach may limit immediate returns to shareholders, it supports long-term value creation. Additionally, Amazon engages in share buybacks, which can enhance shareholder value by reducing share dilution. Overall, this distribution strategy appears to be aimed at sustainable growth rather than short-term payouts.
Sector Analysis
Amazon.com, Inc. is a leading player in the Specialty Retail industry, known for its diverse product offerings and competitive advantages such as a vast logistics network and strong brand loyalty. Key competitors include Walmart and Alibaba, while strengths include its AWS segment and extensive consumer base.
Strategic Positioning
Amazon.com, Inc. (AMZN) holds a dominant position in the e-commerce sector with a substantial market share across its key product segments. Its total market capitalization stands at approximately $2.37T, reflecting its significant influence in the Specialty Retail industry. Competitive pressure from emerging platforms continues to rise, yet Amazon’s robust technological infrastructure, particularly through Amazon Web Services (AWS), enables it to stay ahead. Additionally, the company faces challenges from technological disruptions, but its diversified business model and continuous innovation help mitigate these risks, positioning it favorably for sustained growth.
Revenue by Segment
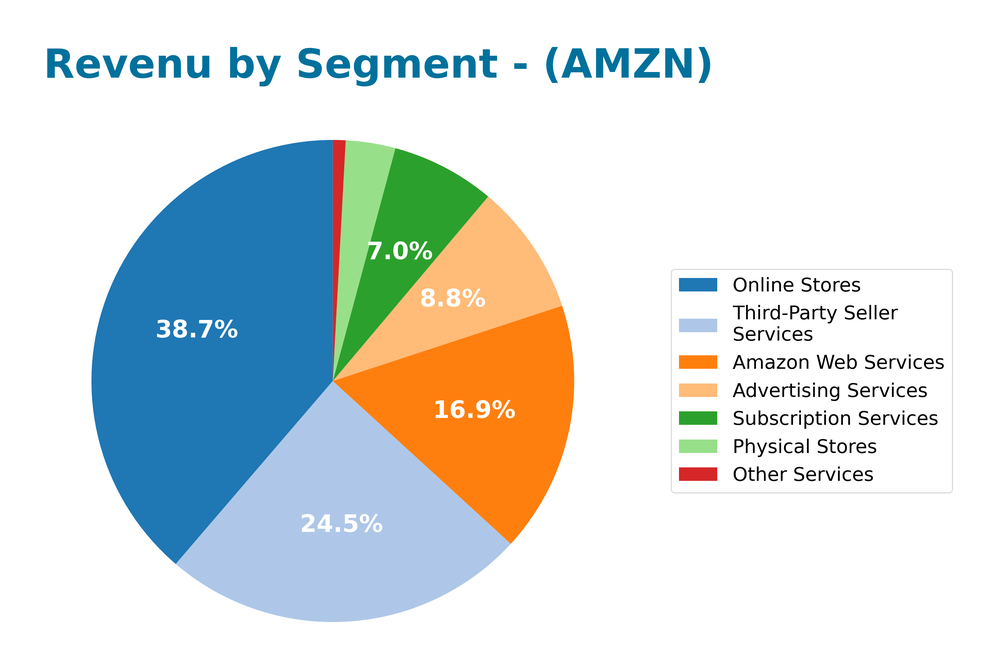
The following chart illustrates Amazon’s revenue segmentation for the fiscal year 2024, highlighting the performance of various business segments.

In FY 2024, Amazon saw substantial revenue growth across key segments, particularly in Online Stores at 247B and Third-Party Seller Services at 156B. Advertising Services also showed strength, increasing to 56B, while AWS climbed to 107B, solidifying its role as a vital growth engine. However, the growth rate has begun to moderate compared to previous years, raising potential concentration risks. Notably, segments like Physical Stores and Other Services, while growing, represent a smaller portion of overall revenue, indicating a continued focus on digital and service-based offerings.
Key Products
Amazon.com, Inc. offers a diverse range of products that cater to various consumer needs. Below is a table summarizing some of the key products offered by the company:
| Product | Description |
|---|---|
| Amazon Prime | A subscription service that provides members with benefits like free shipping, streaming, and more. |
| Kindle | An e-reader device that allows users to download and read e-books, magazines, and newspapers. |
| Fire TV | A media streaming device that enables users to access streaming services like Netflix and Prime Video. |
| Echo | A smart speaker powered by Alexa, designed for voice interaction and smart home control. |
| Amazon Web Services (AWS) | A comprehensive cloud computing platform offering services such as computing power, storage, and machine learning. |
| Ring | A home security product that includes video doorbells and security cameras. |
| Blink | A wireless home security camera system that offers easy installation and monitoring via a mobile app. |
| eero | A home Wi-Fi system designed to provide fast and reliable internet coverage throughout the house. |
These products illustrate Amazon’s commitment to enhancing consumer convenience and advancing technology in everyday life.
Main Competitors
In the competitive landscape of the specialty retail sector, several companies vie for market share alongside Amazon.com, Inc. (AMZN). However, reliable competitor data is limited.
| Company | Market Share |
|---|---|
| No verified competitors were identified from available data. |
As it stands, Amazon holds a significant position in the specialty retail market, leveraging its vast online and physical store presence. The company’s estimated market share is substantial, indicating its dominance in both North American and international markets, despite the lack of specific competitor information.
Competitive Advantages
Amazon.com, Inc. (AMZN) enjoys several competitive advantages that solidify its market position. The company’s extensive logistics network and innovative technology infrastructure, particularly through Amazon Web Services (AWS), enable it to provide unmatched efficiency and scalability. Looking ahead, Amazon is set to expand into emerging markets and enhance its product offerings, including advanced AI technologies and enhanced streaming services. These initiatives will likely open new revenue streams and solidify customer loyalty, positioning Amazon favorably in an increasingly competitive landscape.
SWOT Analysis
This analysis evaluates the strengths, weaknesses, opportunities, and threats related to Amazon.com, Inc. (AMZN) to inform strategic decision-making.
Strengths
- Strong brand recognition
- Diverse revenue streams
- Extensive logistics network
Weaknesses
- Thin profit margins
- Dependence on third-party sellers
- Regulatory scrutiny
Opportunities
- Growth in e-commerce
- Expansion of AWS services
- Increasing digital content consumption
Threats
- Intense competition
- Economic downturns
- Cybersecurity threats
The overall SWOT assessment indicates that while Amazon enjoys significant strengths and opportunities, it must address its weaknesses and remain vigilant against external threats. A balanced strategy focusing on leveraging strengths and seizing opportunities while managing risks will be crucial for sustained growth.
Stock Analysis
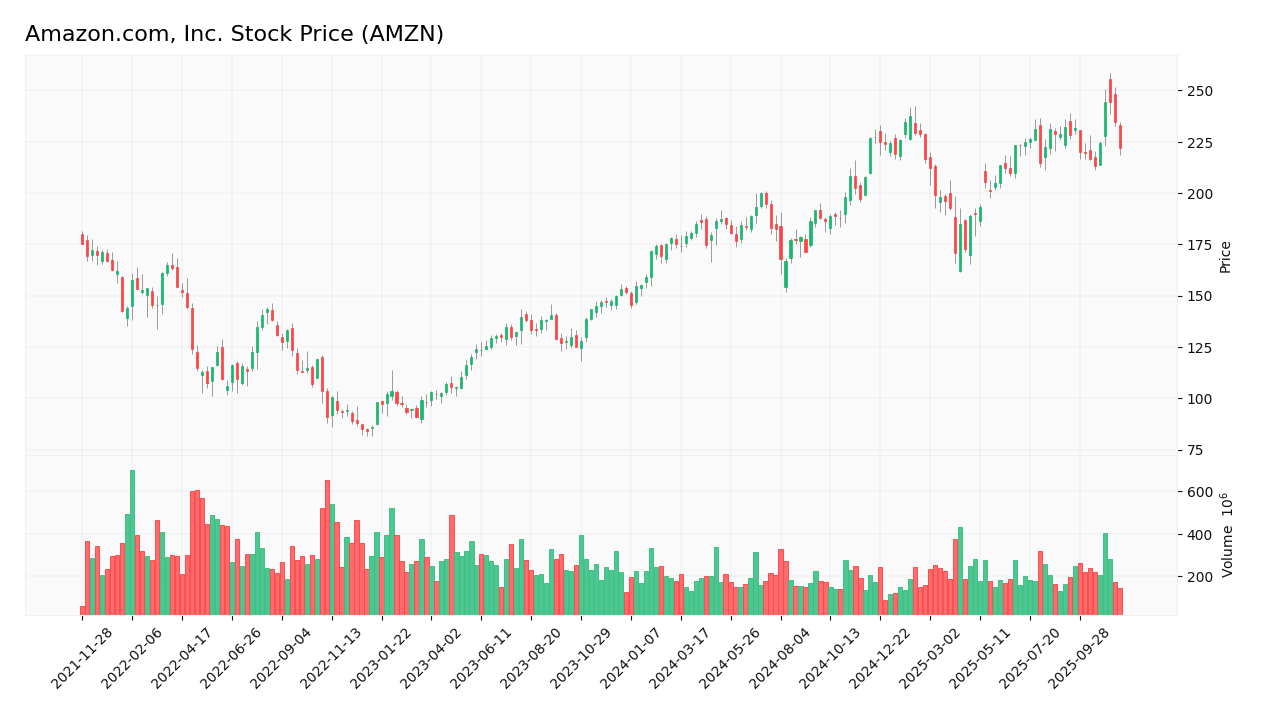
Amazon.com, Inc. (AMZN) has experienced significant price movements over the past year, characterized by a notable bullish trend with a 46.14% increase. However, recent trading dynamics indicate a slight pullback in the latest weeks.

Trend Analysis
Over the past year, AMZN has shown a 46.14% increase, confirming a bullish trend. Despite this overall upward movement, in the recent period from September 7, 2025, to November 23, 2025, the stock has experienced a 4.42% decline, indicating a shift towards a bearish sentiment in this timeframe. The highest price reached was $244.41, while the lowest was $145.24. The overall trend is characterized by a deceleration in price movement, with a standard deviation of 23.46, suggesting some volatility in the stock’s performance.
Volume Analysis
In the last three months, AMZN’s total trading volume was approximately 25.52B shares, with 57.73% of that volume attributed to buyers. However, the overall volume trend is decreasing, indicating waning market participation. In the recent period, buyer volume was about 1.30B, while seller volume stood at 1.45B, reflecting a neutral buyer behavior with 47.29% buyer dominance. This suggests that investor sentiment may be shifting towards caution, as sellers have recently outnumbered buyers.
Analyst Opinions
Recent analyst recommendations for Amazon.com, Inc. (AMZN) have varied, with an overall consensus leaning towards a “buy” rating. Analysts, including experts from notable firms, have highlighted strong return on equity and return on assets scores, indicating robust operational performance. However, concerns regarding the company’s debt-to-equity ratio and price-to-earnings metrics have tempered enthusiasm. Overall, the consensus for 2025 is a “buy,” reflecting confidence in Amazon’s long-term growth prospects despite some caution on valuation metrics.
Stock Grades
Amazon.com, Inc. (AMZN) has recently received a mix of grades from reputable grading companies, reflecting varied sentiments among analysts.
| Grading Company | Action | New Grade | Date |
|---|---|---|---|
| Rothschild & Co | Downgrade | Neutral | 2025-11-18 |
| Mizuho | Maintain | Outperform | 2025-11-04 |
| Rosenblatt | Maintain | Buy | 2025-11-04 |
| UBS | Maintain | Buy | 2025-10-31 |
| B of A Securities | Maintain | Buy | 2025-10-31 |
| DA Davidson | Maintain | Buy | 2025-10-31 |
| Bernstein | Maintain | Outperform | 2025-10-31 |
| TD Cowen | Maintain | Buy | 2025-10-31 |
| Canaccord Genuity | Maintain | Buy | 2025-10-31 |
| JP Morgan | Maintain | Overweight | 2025-10-31 |
The overall trend indicates a cautious sentiment, with Rothschild & Co downgrading AMZN to a Neutral rating, while several other firms maintain positive ratings such as Buy and Outperform. This mixed feedback highlights a potential need for investors to monitor AMZN’s performance closely amidst changing market conditions.
Target Prices
The consensus target price for Amazon.com, Inc. (AMZN) reflects a balanced outlook from analysts.
| Target High | Target Low | Consensus |
|---|---|---|
| 340 | 265 | 299.71 |
Overall, analysts expect AMZN to reach an average price of approximately 299.71, suggesting a moderate growth potential in the near term.
Consumer Opinions
Consumer sentiment towards Amazon.com, Inc. (AMZN) reveals a mix of satisfaction and discontent, reflecting both the company’s strengths and areas for improvement.
| Positive Reviews | Negative Reviews |
|---|---|
| Excellent delivery times and service. | Customer service is often unresponsive. |
| Wide selection of products available. | Frequent issues with third-party sellers. |
| Competitive pricing on many items. | Returns process can be cumbersome. |
Overall, consumer feedback indicates that while Amazon excels in product variety and delivery efficiency, challenges in customer service and the returns process are frequently noted as areas needing improvement.
Risk Analysis
In this section, I will outline key risks associated with investing in Amazon.com, Inc. (AMZN) to help you make informed decisions.
| Category | Description | Probability | Impact |
|---|---|---|---|
| Market Risk | Fluctuations in consumer spending due to economic downturns. | High | High |
| Regulatory Risk | Increasing scrutiny and potential antitrust actions by regulators. | Medium | High |
| Supply Chain Risk | Disruptions in supply chains affecting product availability. | High | Medium |
| Competition Risk | Intense competition from both e-commerce and traditional retailers. | High | Medium |
| Technological Risk | Risks associated with cyberattacks and data breaches. | Medium | High |
In 2023, Amazon faced heightened regulatory scrutiny, emphasizing the potential for significant impacts on operational flexibility and costs. This underscores the importance of considering both market and regulatory risks when evaluating AMZN for your portfolio.
Should You Buy Amazon.com, Inc.?
Amazon.com, Inc. (AMZN) has demonstrated a positive net margin of 8.20% in 2024, but it carries a high debt level with a total debt of 130.9B. The company has shown a robust growth in revenue, increasing from 574.79B in 2023 to 723.95B in 2025. The overall rating for the company is B, indicating a solid performance relative to its peers.
Favorable signals The company has a positive net margin of 8.20%, signifying profitability. Additionally, Amazon has demonstrated solid revenue growth, increasing from 574.79B in 2023 to 723.95B in 2025, reflecting strong demand and operational efficiency. The return on invested capital (ROIC) stands at 13.15%, which exceeds the weighted average cost of capital (WACC) of 9.78%, indicating value creation.
Unfavorable signals Amazon’s total debt amounts to 130.9B, which can be considered a high debt level relative to its equity. Moreover, the recent trend shows a decrease in buyer volume compared to seller volume, suggesting caution. The price-to-earnings ratio (PER) is 38.78, which is below the threshold of 40, but it does imply that the stock may be relatively high in valuation.
Conclusion Given the favorable net margin, revenue growth, and ROIC exceeding WACC, Amazon.com, Inc. could be seen as favorable for long-term investors. However, the high debt level and recent seller dominance in trading could signal the need for caution.
Additional Resources
- Amazon’s Breakout Is Here – Outsized AWS & Advertising Performance (NASDAQ:AMZN) – Seeking Alpha (Nov 19, 2025)
- Amazon Stock Slides Following Rothschild & Co Downgrade – Benzinga (Nov 18, 2025)
- Is Amazon.com Inc. (AMZN) One of the Best Stocks to Invest in, According to Billionaire D.E. Shaw – Yahoo Finance (Nov 03, 2025)
- Insider Sell: Keith Alexander Sells 900 Shares of Amazon.com Inc (AMZN) – GuruFocus (Nov 19, 2025)
- Amazon.com, Inc. (AMZN): Our Calculation of Intrinsic Value – The Acquirer’s Multiple (Nov 13, 2025)
For more information about Amazon.com, Inc., please visit the official website: amazon.com


