Home > Analyses > Technology > Shopify Inc.
Shopify transforms how millions of merchants connect with customers worldwide. Its platform powers seamless commerce across web stores, social media, and physical outlets. Renowned for innovation, Shopify leads the software application space with robust tools for inventory, payments, and analytics. As e-commerce evolves rapidly, I ask whether Shopify’s current fundamentals support its lofty valuation and ambitious growth trajectory in 2026.

Table of contents
Business Model & Company Overview
Shopify Inc., founded in 2004 and headquartered in Ottawa, Canada, operates as a leading commerce platform worldwide. It empowers merchants to build a cohesive sales ecosystem spanning web, mobile, social media, and physical stores. Shopify’s integrated services streamline product management, payments, fulfillment, and customer engagement, creating a seamless experience that defines its core business in the application software sector.
The company’s revenue engine balances subscription-based software solutions with merchant services, including payments and financing, generating recurring cash flow. Shopify has strategically expanded across the Americas, Europe, Asia Pacific, and beyond, capturing diverse markets. Its deep integration across sales channels and merchant tools fortifies a durable economic moat, positioning Shopify as a pivotal force shaping global commerce infrastructure.
Financial Performance & Fundamental Metrics
I analyze Shopify Inc.’s income statement, key financial ratios, and dividend payout policy to gauge its profitability, efficiency, and shareholder returns.
Income Statement
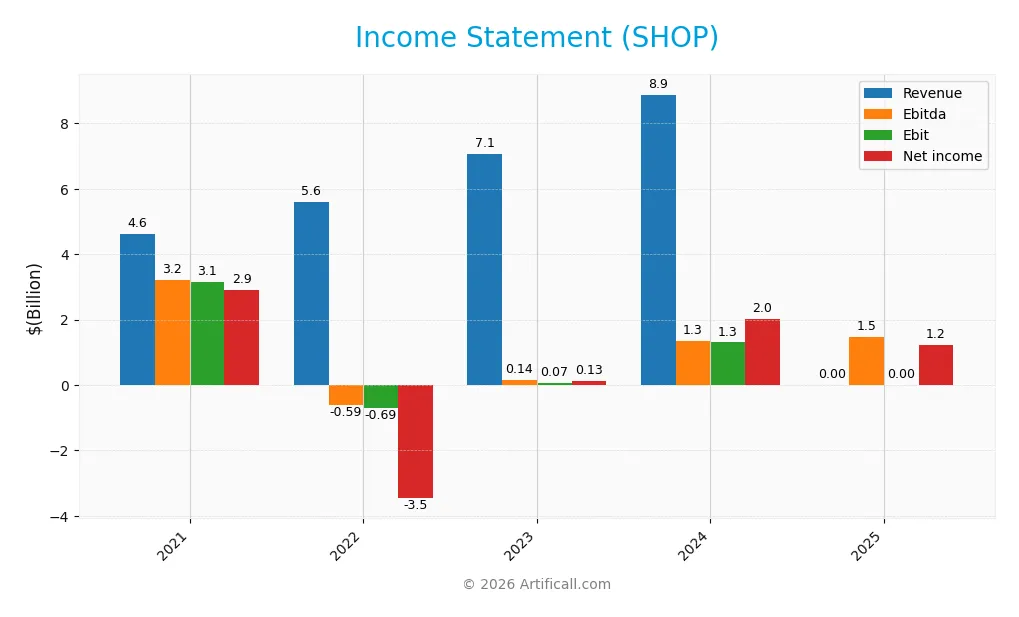
This table presents Shopify Inc.’s key income statement figures for fiscal years 2021 to 2025 in USD. It highlights revenue trends, profitability, and earnings per share evolution.
| 2021 | 2022 | 2023 | 2024 | 2025 | |
|---|---|---|---|---|---|
| Revenue | 4.6B | 5.6B | 7.1B | 8.9B | 0 |
| Cost of Revenue | 2.1B | 2.8B | 3.5B | 4.4B | 0 |
| Operating Expenses | 2.2B | 3.6B | 4.9B | 3.4B | 4.1B |
| Gross Profit | 2.5B | 2.8B | 3.5B | 4.5B | 5.6B |
| EBITDA | 3.2B | -594M | 144M | 1.3B | 1.5B |
| EBIT | 3.1B | -687M | 74M | 1.3B | 0 |
| Interest Expense | 3.5M | 1.2M | 0 | 0 | 0 |
| Net Income | 2.9B | -3.5B | 132M | 2.0B | 1.2B |
| EPS | 2.32 | -2.73 | 0.10 | 1.56 | 0.95 |
| Filing Date | 2022-02-16 | 2023-02-16 | 2024-02-13 | 2025-02-11 | 2026-02-11 |
Income Statement Evolution
Shopify’s revenue declined sharply to zero in 2025 from $8.88B in 2024, a drastic anomaly in its trend. Gross profit rose 24%, but this was from a reported zero revenue, indicating reporting irregularities or restatements. Margins deteriorated overall, with net income falling by 39% year-over-year and net margin shrinking to zero, reflecting significant instability.
Is the Income Statement Favorable?
The 2025 income statement shows mixed signals with positive EBITDA of $1.47B and operating income matching EBITDA, but no reported revenue, which is unusual. Net income fell to $1.23B from $2.02B in 2024, and despite zero interest expense, unfavorable margins and revenue collapse suggest weak fundamentals. The overall income statement is assessed as unfavorable given inconsistent and declining profitability metrics.
Financial Ratios
The following table summarizes key financial ratios for Shopify Inc. over the last five fiscal years to provide a clear view of its operational efficiency, profitability, liquidity, and leverage:
| Ratios | 2021 | 2022 | 2023 | 2024 | 2025 |
|---|---|---|---|---|---|
| Net Margin | 63% | -62% | 2% | 23% | 0% |
| ROE | 26% | -42% | 1% | 17% | 9% |
| ROIC | 2% | -8% | -10% | 8% | 19% |
| P/E | 59 | -13 | 756 | 68 | 170 |
| P/B | 15.4 | 5.3 | 11.0 | 11.9 | 15.5 |
| Current Ratio | 12.2 | 7.1 | 7.0 | 3.7 | 12.9 |
| Quick Ratio | 12.2 | 7.1 | 7.0 | 3.7 | 12.9 |
| D/E | 0.11 | 0.17 | 0.13 | 0.10 | 0.01 |
| Debt-to-Assets | 9% | 13% | 10% | 8% | 1% |
| Interest Coverage | 78 | -715 | 0 | 0 | 0 |
| Asset Turnover | 0.35 | 0.52 | 0.62 | 0.64 | 0.00 |
| Fixed Asset Turnover | 15.3 | 11.5 | 48.0 | 63.4 | 0.0 |
| Dividend Yield | 0% | 0% | 0% | 0% | 0% |
Evolution of Financial Ratios
Shopify’s Return on Equity (ROE) showed volatility, peaking in 2021 before declining sharply by 2025. The Current Ratio climbed steadily, reaching an exceptionally high 12.86 in 2025, indicating strong liquidity. Debt-to-Equity Ratio consistently decreased, falling to 0.01 in 2025, reflecting minimal leverage. Profitability showed instability, with net margins fluctuating and ultimately turning unfavorable by 2025.
Are the Financial Ratios Favorable?
In 2025, Shopify’s liquidity remains strong with a high quick ratio of 12.86, yet the overall current ratio is flagged as unfavorable due to excess. Profitability metrics, including ROE at 9.14% and net margin at 0%, are weak relative to benchmarks. Leverage ratios like debt-to-equity (0.01) and debt-to-assets (1.24%) are favorable, signaling low financial risk. Market valuation ratios such as P/E (169.86) and P/B (15.52) appear stretched. Overall, 71.43% of ratios are unfavorable, indicating a cautious financial profile.
Shareholder Return Policy
Shopify Inc. does not pay dividends, reflecting its reinvestment strategy during a high-growth phase. The company also does not engage in share buybacks, prioritizing capital allocation toward expansion and innovation.
This approach aligns with long-term value creation by focusing resources on growth opportunities. However, investors should monitor profitability trends to assess when shareholder distributions might become viable.
Score analysis
The following radar chart highlights Shopify Inc.’s key financial scores across valuation, profitability, and leverage metrics:
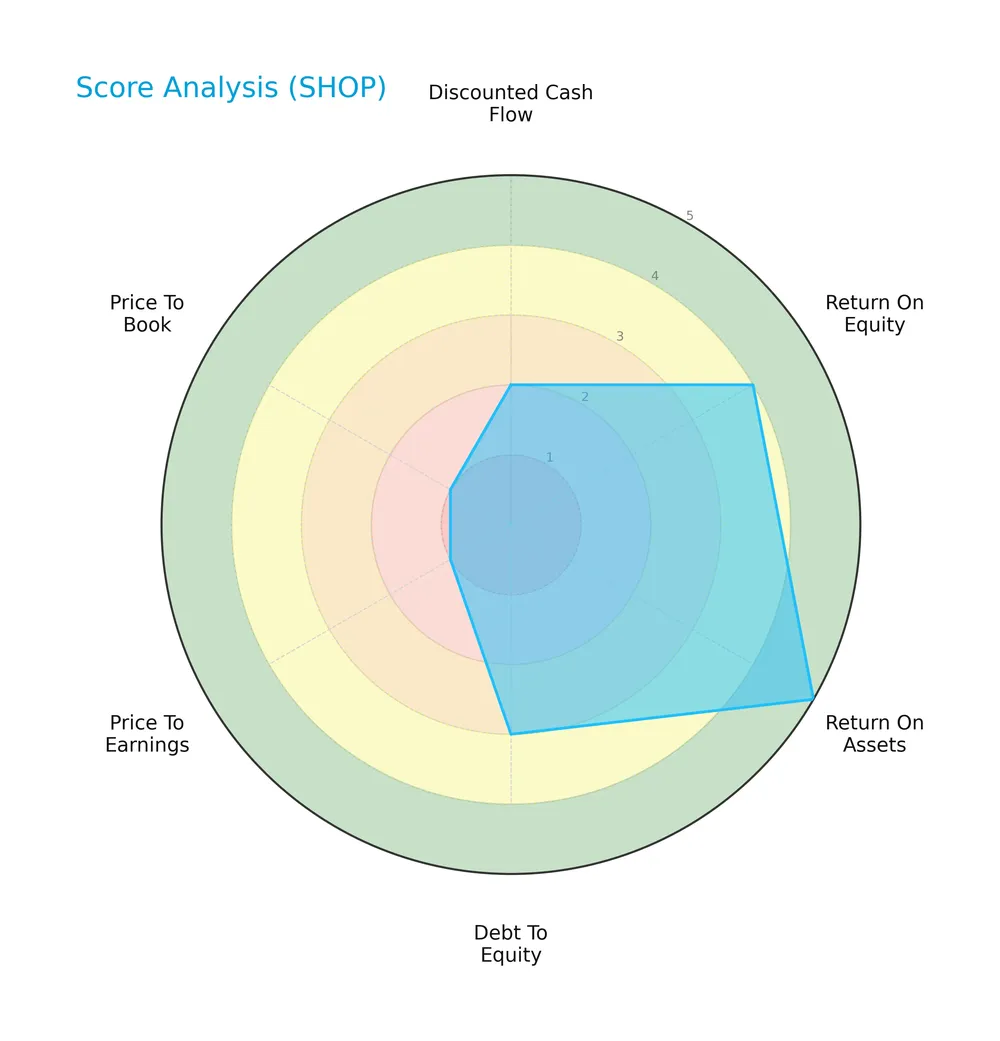
Shopify’s return on assets scores very favorably at 5, signaling efficient asset use. Return on equity is also strong at 4. Debt-to-equity shows moderate leverage at 3. However, valuation metrics—price-to-earnings and price-to-book—are very unfavorable at 1 each, while discounted cash flow is weak at 2.
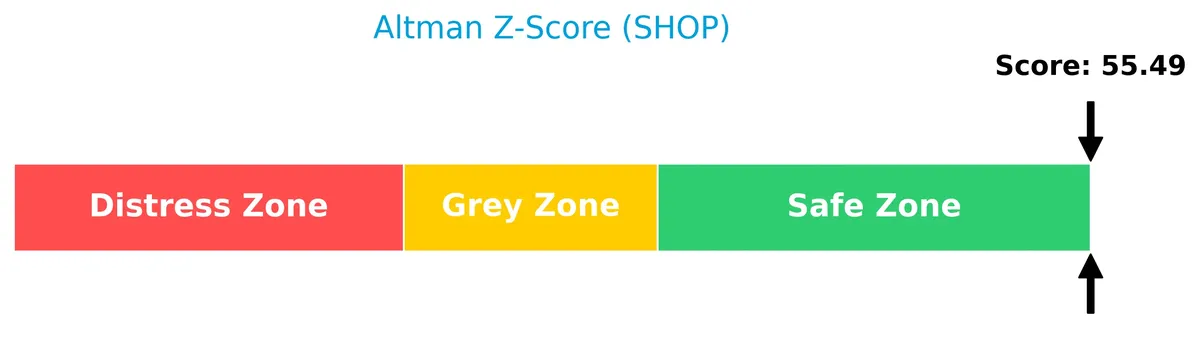
Analysis of the company’s bankruptcy risk
Shopify’s Altman Z-Score places it firmly in the safe zone, indicating a very low bankruptcy risk:
Is the company in good financial health?
This Piotroski diagram illustrates Shopify’s financial health based on its score:

With a Piotroski Score of 6, Shopify demonstrates average financial strength. This suggests the company maintains reasonable profitability and operational efficiency but leaves room for improvement in some areas.
Competitive Landscape & Sector Positioning
This section analyzes Shopify Inc.’s strategic positioning within the software application sector, focusing on revenue streams and key products. I will assess whether Shopify holds a competitive advantage over its main industry rivals.
Strategic Positioning
Shopify concentrates on commerce software with a dual revenue model: subscription services and merchant solutions. It operates globally, generating over $5.4B in the U.S., with significant presence in EMEA, APAC, Canada, and Latin America, reflecting broad geographic diversification.
Revenue by Segment
This pie chart illustrates Shopify Inc.’s revenue breakdown by segment for the fiscal year 2025, highlighting the distribution between Service and Subscription and Circulation revenues.
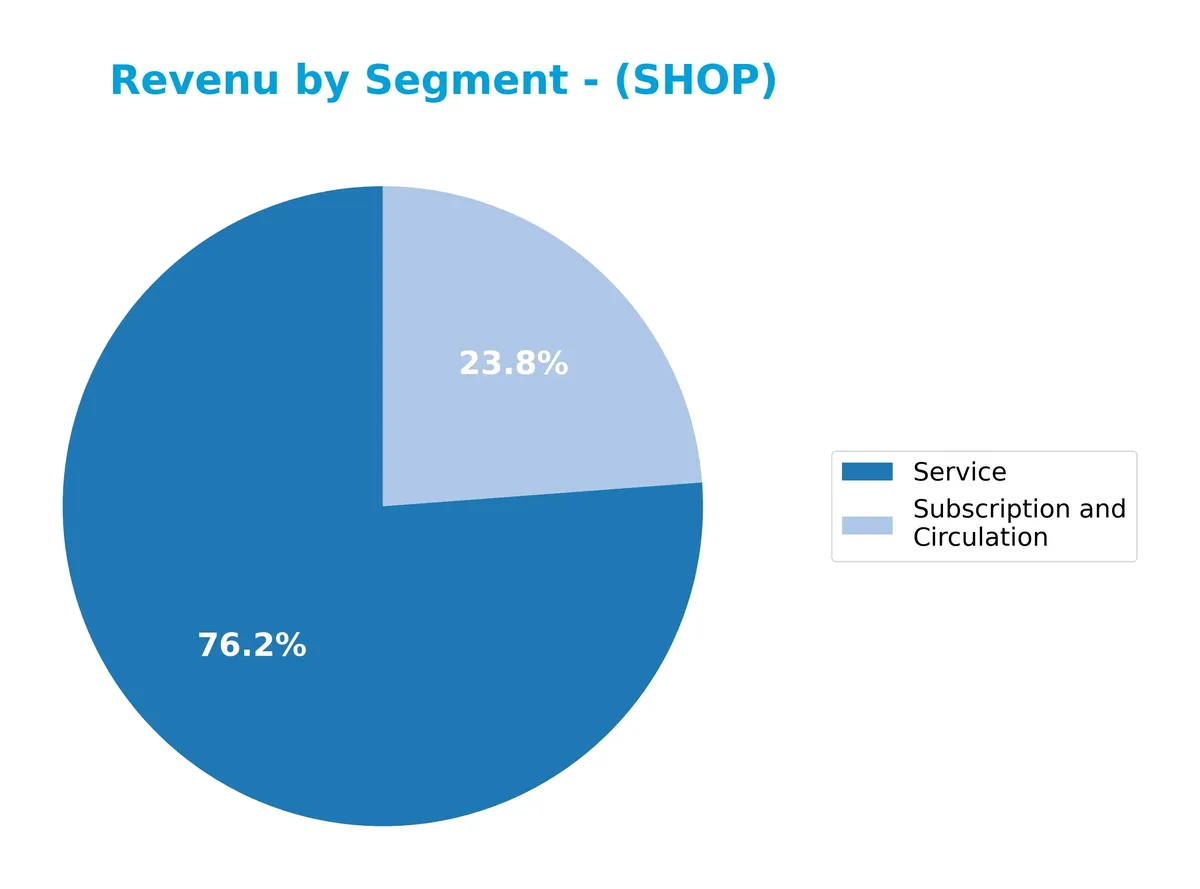
Shopify’s revenue is heavily driven by the Service segment, which reached $8.8B in 2025, up significantly from $6.53B in 2024. Subscription and Circulation also grew, hitting $2.75B. The acceleration in Service revenue underscores the company’s focus on merchant solutions and value-added services. This shift indicates increasing concentration risk but also reflects strong execution in high-margin areas.
Key Products & Brands
The following table outlines Shopify Inc.’s principal products and services by category and function:
| Product | Description |
|---|---|
| Subscription Solutions | Recurring revenue from platform access, including online store subscriptions, themes, apps, and domains. |
| Merchant Solutions | Services supporting payments, shipping, fulfillment, and working capital to merchants using Shopify’s platform. |
Shopify’s revenue primarily derives from Subscription Solutions and Merchant Solutions. Subscription fees provide stable recurring income, while Merchant Solutions scale with merchant transaction volumes, reflecting Shopify’s expanding ecosystem.
Main Competitors
Shopify Inc. faces competition from 33 companies, with the table showing the top 10 leaders by market capitalization:
| Competitor | Market Cap. |
|---|---|
| Salesforce, Inc. | 242B |
| Shopify Inc. | 210B |
| AppLovin Corporation | 209B |
| Intuit Inc. | 175B |
| Uber Technologies, Inc. | 172B |
| ServiceNow, Inc. | 153B |
| Cadence Design Systems, Inc. | 84B |
| Snowflake Inc. | 73B |
| Autodesk, Inc. | 61B |
| Workday, Inc. | 55B |
Shopify ranks 2nd among its 33 competitors, with a market cap 64% of the leader Salesforce. It stands above both the average top 10 market cap of 144B and the sector median of 19B. Shopify’s market cap exceeds its nearest rival by 56.5%, highlighting a solid lead in scale.
Comparisons with competitors
Check out how we compare the company to its competitors:
Does Shopify have a competitive advantage?
Shopify demonstrates a sustainable competitive advantage, consistently creating value with a ROIC exceeding WACC by 2.1%. Its growing ROIC trend signals increasing profitability and efficient capital use.
Looking ahead, Shopify’s platform spans diverse global markets and sales channels. Opportunities include expanding merchant solutions and integrating new commerce technologies to capture further market share.
SWOT Analysis
This SWOT analysis highlights Shopify Inc.’s key internal strengths and weaknesses, alongside external opportunities and threats shaping its strategic outlook.
Strengths
- strong global commerce platform
- very favorable moat with growing ROIC
- low debt and high liquidity
Weaknesses
- unfavorable net margin and earnings growth
- high valuation multiples (PE and PB)
- weak operational efficiency metrics
Opportunities
- expanding international markets, especially US and EMEA
- growing demand for integrated commerce solutions
- potential for new merchant services and fintech integration
Threats
- intense competition in e-commerce software
- macroeconomic uncertainty affecting merchant spending
- regulatory pressures in multiple jurisdictions
Shopify’s solid competitive moat and global reach position it well for long-term growth. However, the company must address profitability challenges and valuation risks to sustain investor confidence.
Stock Price Action Analysis
The weekly stock chart of Shopify Inc. (SHOP) highlights price movements over the past 12 months, showing key levels and volatility patterns:
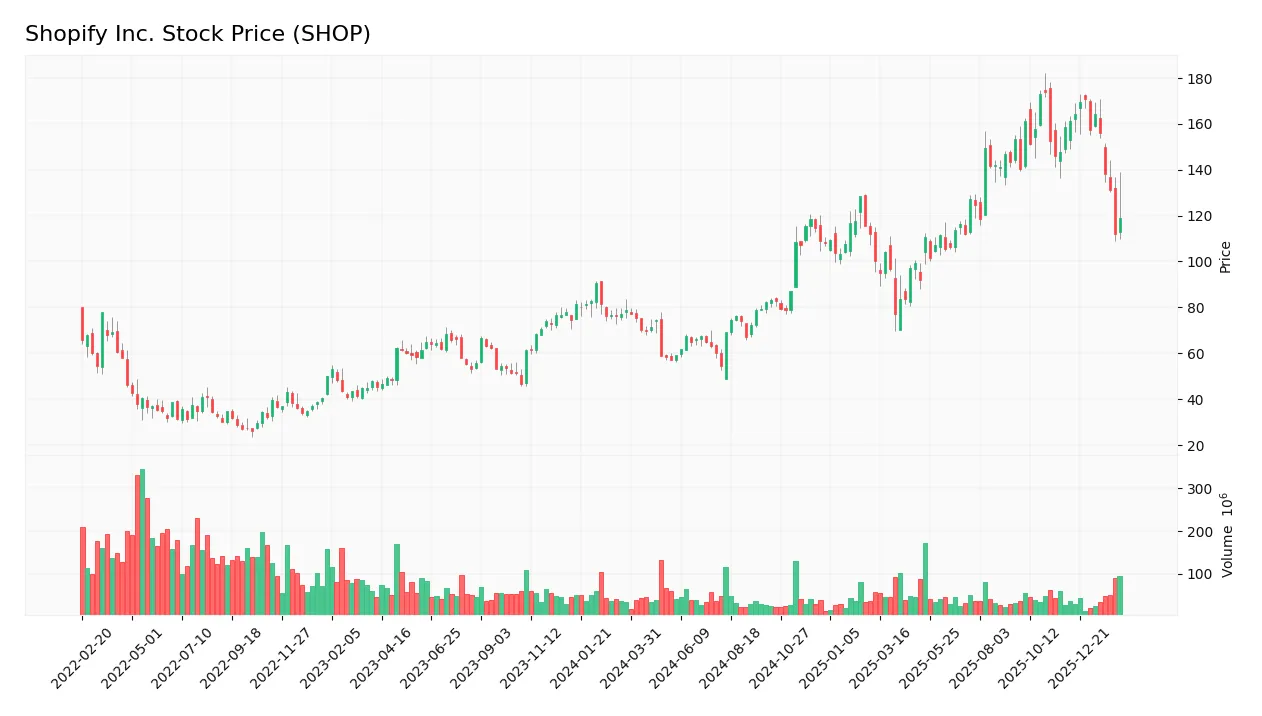
Trend Analysis
Over the past 12 months, Shopify’s stock price rose 50.8%, indicating a bullish trend despite deceleration. The price ranged between 54.43 and 173.86, with a high volatility level (33.43 std deviation). However, a recent 2.5-month period shows a -25.17% decline, signaling a short-term bearish correction.
Volume Analysis
In the last three months, trading volume decreased, with buyers accounting for 52.58%. This mild buyer dominance, combined with neutral buyer behavior, suggests cautious investor sentiment and reduced market participation. The volume trend points to a less active trading environment.
Target Prices
Analysts present a solid target consensus reflecting confidence in Shopify’s growth potential.
| Target Low | Target High | Consensus |
|---|---|---|
| 115 | 200 | 174.55 |
The target range signals bullish sentiment, with expectations for significant upside from current levels.

Don’t Let Luck Decide Your Entry Point
Optimize your entry points with our advanced ProRealTime indicators. You’ll get efficient buy signals with precise price targets for maximum performance. Start outperforming now!
Analyst & Consumer Opinions
This section reviews analyst ratings and consumer feedback to provide insights on Shopify Inc.’s market perception.
Stock Grades
Here are the latest verified stock grades for Shopify Inc. from recognized financial institutions:
| Grading Company | Action | New Grade | Date |
|---|---|---|---|
| Benchmark | Maintain | Buy | 2026-02-10 |
| BMO Capital | Maintain | Outperform | 2026-02-09 |
| Scotiabank | Upgrade | Sector Outperform | 2026-01-08 |
| Wolfe Research | Downgrade | Peer Perform | 2026-01-06 |
| Wells Fargo | Maintain | Overweight | 2025-12-17 |
| BMO Capital | Maintain | Outperform | 2025-11-05 |
| DA Davidson | Maintain | Buy | 2025-11-05 |
| Scotiabank | Maintain | Sector Perform | 2025-11-05 |
| Morgan Stanley | Maintain | Overweight | 2025-11-05 |
| UBS | Maintain | Neutral | 2025-11-05 |
The overall trend shows consistent positive sentiment with most firms maintaining Buy or Outperform ratings. A single downgrade to Peer Perform indicates some divergence but does not outweigh the prevailing optimism.
Consumer Opinions
Shopify Inc. commands strong loyalty among users, yet some frustrations persist in service and pricing.
| Positive Reviews | Negative Reviews |
|---|---|
| “Intuitive platform that simplifies e-commerce setup.” | “Customer support response times can be slow.” |
| “Robust app ecosystem accelerates store growth.” | “Pricing tiers feel steep for small businesses.” |
| “Reliable uptime ensures smooth sales operations.” | “Occasional glitches during high traffic periods.” |
Overall, consumers praise Shopify’s ease of use and extensive features. However, concerns around customer service and cost remain consistent, signaling areas for management to address.
Risk Analysis
Below is a table summarizing key risks facing Shopify Inc., categorized by likelihood and potential impact:
| Category | Description | Probability | Impact |
|---|---|---|---|
| Valuation Risk | Extremely high P/E (170) and P/B (15.5) ratios suggest overvaluation. | High | High |
| Profitability | Zero net margin and low ROE (9.14%) indicate weak earnings. | High | Medium |
| Market Volatility | Beta of 2.82 signals high price volatility versus NASDAQ. | High | Medium |
| Liquidity | Excessively high current ratio (12.86) may indicate inefficient capital use. | Medium | Low |
| Debt & Interest | Minimal debt (D/E 0.01) but zero interest coverage poses risk if leverage rises. | Low | Medium |
| Operational | Zero asset turnover points to poor asset utilization. | Medium | Medium |
The most pressing risks are Shopify’s stretched valuation and absence of profitability, which expose investors to significant downside during market corrections. The company’s high beta amplifies these risks amid tech sector volatility. Despite a strong Altman Z-Score indicating low bankruptcy risk, operational inefficiencies and valuation extremes warrant caution.
Should You Buy Shopify Inc.?
Shopify appears to be generating strong value creation with a very favorable competitive moat, evidenced by growing ROIC well above WACC. Despite a manageable leverage profile and a safe Altman Z-score, valuation metrics suggest caution. Its overall B rating reflects this balanced profile.
Strength & Efficiency Pillars
Shopify Inc. demonstrates solid value creation, with a return on invested capital (ROIC) of 19.19% comfortably exceeding its weighted average cost of capital (WACC) at 17.05%. This indicates the company is a value creator. Despite an unimpressive return on equity (ROE) of 9.14%, the growing ROIC trend highlights improving operational efficiency and a sustainable competitive advantage. The Altman Z-Score firmly places Shopify in the safe zone at 55.49, underscoring the company’s strong solvency profile.
Weaknesses and Drawbacks
Shopify faces significant valuation headwinds, trading at a high price-to-earnings ratio of 169.86 and price-to-book ratio of 15.52, signaling a stretched premium that could pressure future returns. The current ratio of 12.86, while superficially strong, flags potential asset misallocation or liquidity management inefficiencies. Interest coverage is notably weak at zero, raising concerns about debt servicing despite minimal leverage (debt-to-equity at 0.01). These factors introduce risk amid a decelerating stock price trend and decreasing trading volume.
Our Final Verdict about Shopify Inc.
Shopify’s fundamentals suggest a company with long-term value creation potential and a secure solvency position, supported by a bullish overall stock trend. However, recent deceleration and valuation extremes may warrant caution. Despite operational strengths and a solid moat, the current market environment and stretched multiples suggest a wait-and-see approach, as better entry points might emerge.
Disclaimer: This content is for informational purposes only and does not constitute financial, investment, or other professional advice. Investing in financial markets involves a significant risk of loss, and past performance is not indicative of future results.
Additional Resources
- Shopify (SHOP) Reports Q4: Everything You Need To Know Ahead Of Earnings – Yahoo Finance (Feb 10, 2026)
- Shopify soars after AI-boosted results, guides for +30% revenue growth (SHOP:NASDAQ) – Seeking Alpha (Feb 11, 2026)
- Buy, Sell or Hold Shopify Stock? Key Tips Ahead of Q4 Earnings – Zacks Investment Research (Feb 09, 2026)
- Shopify shares slide despite Q4 revenue and EPS beat – Proactive financial news (Feb 11, 2026)
- Shopify: Q4 Earnings Snapshot – king5.com (Feb 11, 2026)
For more information about Shopify Inc., please visit the official website: shopify.com