Every sip of Coca-Cola echoes through the daily lives of millions, making it a cornerstone of refreshment in the beverage industry. With a portfolio that spans from classic soft drinks to innovative health-oriented options, The Coca-Cola Company has established itself as a titan of non-alcoholic beverages. Its relentless pursuit of quality and innovation continues to set market trends. As we analyze its current market standing, the key question arises: do its solid fundamentals and growth potential still justify the existing market valuation?
Table of contents
Company Description
The Coca-Cola Company, founded in 1886 and headquartered in Atlanta, Georgia, is a global leader in the non-alcoholic beverage industry. With a market capitalization of approximately 306B, it offers a diverse portfolio of products, including sparkling soft drinks, water, coffee, tea, and plant-based beverages. The company operates through a vast network of independent bottling partners and distributors, ensuring widespread market penetration across various geographic regions. Its flagship brands, such as Coca-Cola, Fanta, and Sprite, are household names. By continually innovating and adapting to consumer preferences, Coca-Cola plays a pivotal role in shaping beverage trends and promoting sustainability within the industry.
Fundamental Analysis
In this section, I’ll conduct a fundamental analysis of The Coca-Cola Company, focusing on its income statement, financial ratios, and dividend payout policy.
Income Statement
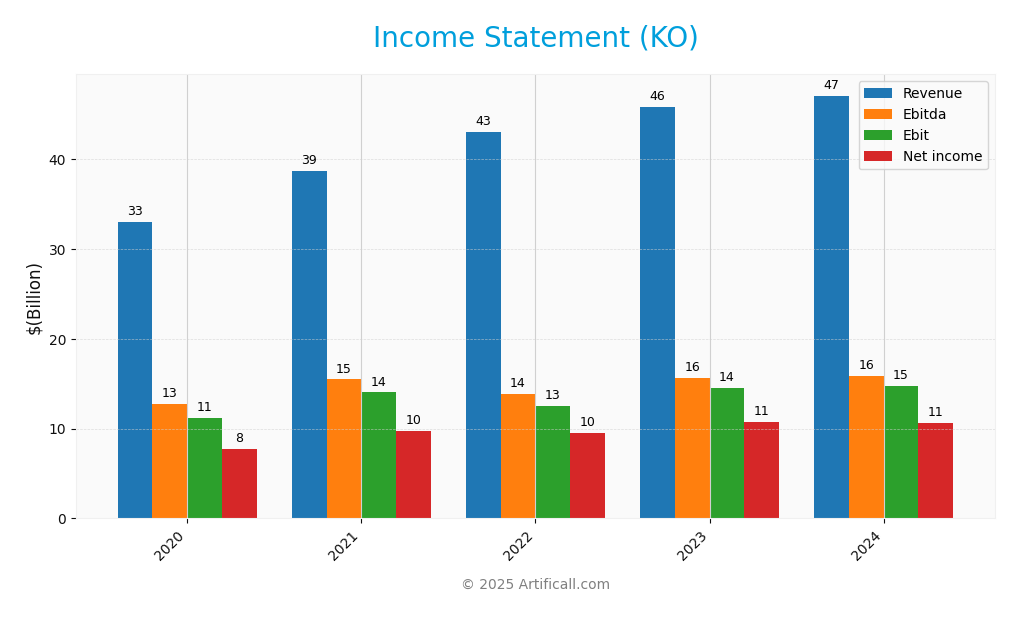
The following table provides a comprehensive overview of The Coca-Cola Company’s income statement for the past five years, illustrating key financial metrics that reflect its performance.
| Metric | 2024 | 2023 | 2022 | 2021 | 2020 |
|---|---|---|---|---|---|
| Revenue | 47.06B | 45.75B | 43.00B | 38.66B | 33.01B |
| Cost of Revenue | 18.32B | 18.52B | 18.00B | 15.36B | 13.43B |
| Operating Expenses | 18.75B | 15.92B | 14.10B | 12.99B | 10.58B |
| Gross Profit | 28.74B | 27.23B | 25.00B | 23.30B | 19.58B |
| EBITDA | 15.82B | 15.61B | 13.83B | 15.47B | 12.72B |
| EBIT | 14.74B | 14.48B | 12.57B | 14.02B | 11.19B |
| Interest Expense | 1.66B | 1.53B | 0.88B | 1.60B | 1.44B |
| Net Income | 10.63B | 10.71B | 9.54B | 9.77B | 7.75B |
| EPS | 2.47 | 2.48 | 2.20 | 2.26 | 1.80 |
| Filing Date | 2025-02-20 | 2024-02-20 | 2023-02-21 | 2022-02-22 | 2021-02-25 |
Over the past five years, Coca-Cola’s revenue has shown a steady upward trend, increasing from 33.01B in 2020 to 47.06B in 2024, reflecting a compound annual growth rate (CAGR) of approximately 10%. Net income has also remained relatively stable, peaking at 10.63B in 2024, indicating a robust demand for its products. The gross profit margin has slightly improved, suggesting better cost management. In 2024, despite rising operating expenses, the company maintained its profitability, demonstrating resilience in a competitive environment. Overall, the outlook remains positive, although investors should monitor potential risks related to market conditions and cost inflation.
Financial Ratios
Below is a summary of key financial ratios for The Coca-Cola Company (KO) over the last five fiscal years.
| Ratios | 2020 | 2021 | 2022 | 2023 | 2024 |
|---|---|---|---|---|---|
| Net Margin | 23.5% | 25.3% | 22.2% | 23.4% | 22.6% |
| ROE | 24.1% | 20.5% | 20.6% | 21.6% | 20.2% |
| ROIC | 13.5% | 12.1% | 11.5% | 12.4% | 11.8% |
| P/E | 30.4 | 26.1 | 28.9 | 23.8 | 25.2 |
| P/B | 12.2 | 11.1 | 11.4 | 9.8 | 10.8 |
| Current Ratio | 1.32 | 1.13 | 1.15 | 1.13 | 1.03 |
| Quick Ratio | 1.09 | 0.96 | 0.93 | 0.95 | 0.84 |
| D/E | 2.30 | 1.92 | 1.68 | 1.67 | 1.84 |
| Debt-to-Assets | 50.9% | 46.9% | 43.8% | 44.4% | 45.5% |
| Interest Coverage | 6.26 | 6.45 | 12.4 | 7.41 | 6.03 |
| Asset Turnover | 0.38 | 0.41 | 0.46 | 0.47 | 0.47 |
| Fixed Asset Turnover | 3.06 | 3.90 | 4.37 | 4.95 | 4.10 |
| Dividend Yield | 3.0% | 2.8% | 2.8% | 3.1% | 3.1% |
Interpretation of Financial Ratios
In 2024, Coca-Cola’s financial ratios exhibit a mixed performance. The net margin of 22.6% suggests solid profitability, yet the declining ROE of 20.2% raises concerns about shareholder returns. Additionally, the high P/E ratio of 25.2 indicates potentially overvalued stock prices relative to earnings, while a current ratio below 1 indicates potential liquidity issues.
Evolution of Financial Ratios
Over the past five years, Coca-Cola has shown a gradual decline in net margin and ROE, indicating a potential decrease in profitability and efficiency. However, the interest coverage ratio remains stable, suggesting the company can manage its debt obligations effectively despite the rising debt-to-equity ratio.
Distribution Policy
The Coca-Cola Company (KO) maintains a robust dividend policy, with a current payout ratio of approximately 78.6% and a steady annual dividend yield of about 3.12%. The dividend per share has shown consistent growth, reflecting the company’s commitment to returning value to shareholders. Additionally, KO engages in share buybacks, further signaling confidence in its financial health. However, investors should monitor the sustainability of these distributions in light of potential economic fluctuations. Overall, this distribution approach appears supportive of long-term value creation for shareholders.
Sector Analysis
The Coca-Cola Company operates in the non-alcoholic beverage industry, offering a diverse portfolio of drinks while facing competition from major brands like PepsiCo and Nestlé. Its competitive advantages include strong brand recognition, extensive distribution networks, and innovative product development.
Strategic Positioning
The Coca-Cola Company (KO) holds a significant market share in the non-alcoholic beverage sector, driven by its diverse product portfolio including iconic brands like Coca-Cola, Sprite, and Fanta. With a market cap of approximately $306B, Coca-Cola faces competitive pressure from both traditional soda brands and emerging health-focused beverages. Technological advancements in distribution and sustainability practices are reshaping the industry landscape, pushing Coca-Cola to innovate continuously. The company’s relatively low beta of 0.398 indicates less volatility compared to the broader market, which may appeal to risk-averse investors.
Revenue by Segment
The following pie chart illustrates the revenue breakdown by segment for The Coca-Cola Company for the fiscal year 2024.
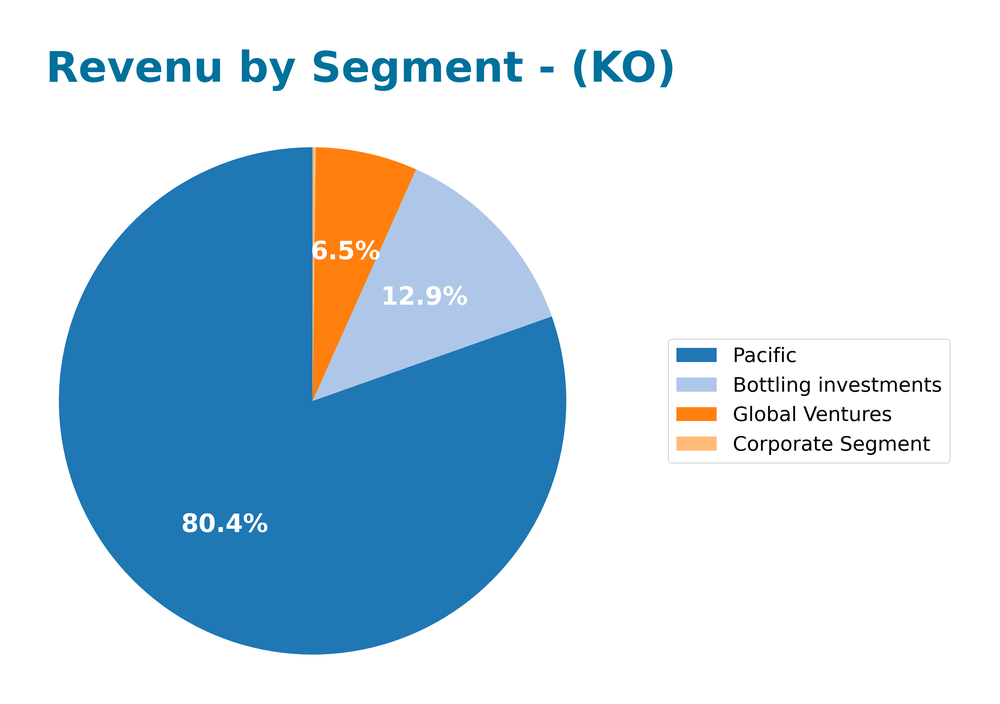
In FY 2024, the Pacific segment remained the primary revenue driver, generating 38.8B, reflecting a steady growth trend. Bottling investments contributed 6.2B, while Global Ventures added 3.1B. Notably, the Corporate Segment showed minimal revenue at 97M. The overall performance indicates a solid foundation in the Pacific region, although the growth rate may face pressures due to market saturation and competition. The slight decline in Bottling investments could signal potential concentration risks if not managed effectively in future quarters.
Key Products
The Coca-Cola Company offers a diverse range of beverages that cater to various consumer preferences. Below is a table summarizing some of the key products:
| Product | Description |
|---|---|
| Coca-Cola | The flagship carbonated soft drink known for its classic taste. |
| Diet Coke | A sugar-free version of Coca-Cola, offering a lighter alternative. |
| Coca-Cola Zero Sugar | A zero-calorie soft drink that maintains the classic Coca-Cola flavor. |
| Fanta Orange | A fruity, orange-flavored soda popular among younger consumers. |
| Sprite | A lemon-lime flavored soda, caffeine-free and refreshing. |
| Dasani | Bottled water brand known for its clean taste and convenience. |
| Minute Maid | A line of juices and juice drinks, including orange and apple varieties. |
| Powerade | A sports drink designed to hydrate and replenish electrolytes. |
| Costa Coffee | A premium coffee brand offering a range of coffee beverages and products. |
| BODYARMOR | A sports drink enriched with vitamins and coconut water. |
These products reflect Coca-Cola’s strategy to diversify its offerings and cater to varying consumer tastes and health considerations.
Main Competitors
In the competitive landscape of the non-alcoholic beverage industry, The Coca-Cola Company faces several formidable rivals. Below is a table of the main competitors based on their market share:
| Company | Market Share |
|---|---|
| PepsiCo, Inc. | 24% |
| Nestlé S.A. | 15% |
| The Coca-Cola Company | 12% |
The non-alcoholic beverage sector is highly competitive, with Coca-Cola holding a significant market share alongside PepsiCo and Nestlé. The competition primarily operates in the global market, where consumer preferences continue to evolve toward healthier beverage options.
Competitive Advantages
The Coca-Cola Company (KO) boasts significant competitive advantages, including its extensive brand portfolio and global distribution network. With a market cap of $306.25B, KO benefits from strong consumer loyalty and a wide range of products, from sparkling beverages to plant-based options. Looking ahead, the company is poised to capitalize on emerging markets and health-conscious trends, launching new products that cater to evolving consumer preferences. This adaptability positions KO favorably for sustained growth and profitability in the dynamic beverage industry.
SWOT Analysis
The purpose of this analysis is to evaluate the strengths, weaknesses, opportunities, and threats facing The Coca-Cola Company (KO) in the current market environment.
Strengths
- Strong brand recognition
- Diverse product portfolio
- Global distribution network
Weaknesses
- Dependency on carbonated drinks
- Vulnerability to commodity price fluctuations
- Limited growth in mature markets
Opportunities
- Expansion into healthier beverage options
- Growing demand for plant-based products
- Emerging markets growth potential
Threats
- Intense competition in the beverage industry
- Regulatory challenges
- Changing consumer preferences
Overall, the SWOT assessment indicates that while Coca-Cola possesses significant strengths and opportunities, it must navigate several weaknesses and external threats. A focus on diversifying its product offerings and expanding in emerging markets could solidify its competitive position.
Stock Analysis
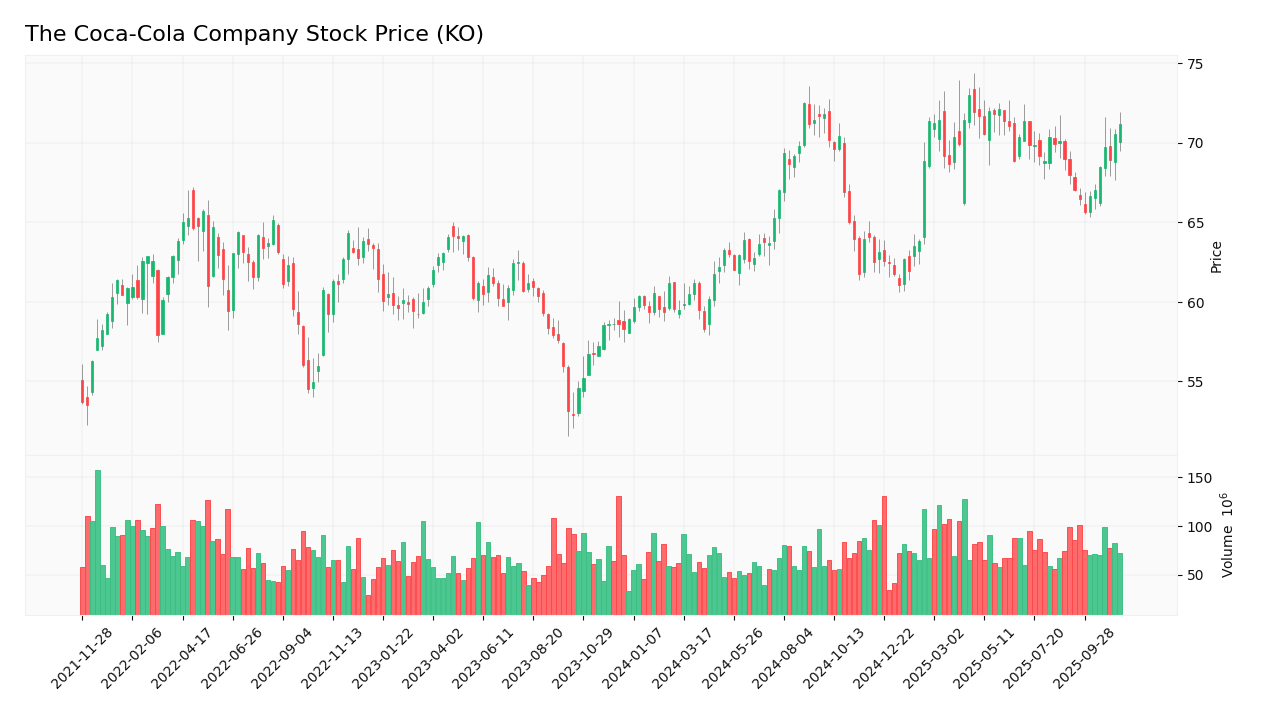
Over the past year, The Coca-Cola Company’s stock (KO) has demonstrated significant price movements, culminating in a bullish trend characterized by a notable increase of 22.02%. The trading dynamics reflect a robust performance and an acceleration in price movements.
Trend Analysis
Analyzing the price change over the past year, KO’s stock has appreciated by 22.02%. This percentage change indicates a bullish trend, supported by notable highs of $73.00 and lows of $58.28. The trend shows acceleration, with a standard deviation of 4.43, suggesting some volatility in the stock’s price movements.
Volume Analysis
Examining the trading volumes over the last three months reveals an average volume of approximately 81.51M shares. The activity appears to be seller-driven, with average sell volume at 42.73M shares compared to an average buy volume of 38.78M shares. Furthermore, the volume trend is currently bearish, indicating deceleration with a trend slope of -860688.15. This suggests a cautious investor sentiment as market participation may be waning.
Analyst Opinions
Recent analyst recommendations for The Coca-Cola Company (KO) indicate a consensus rating of “Buy.” Analysts, including those from reputable firms, have assigned a B+ rating, highlighting strengths in discounted cash flow, return on equity, and return on assets. Specifically, the firm’s solid financial metrics suggest robust performance potential despite a lower score in price-to-earnings and price-to-book ratios. Caution is advised, but the overall sentiment leans positively towards KO as a viable addition to investment portfolios in 2025.
Stock Grades
The latest stock ratings for The Coca-Cola Company (KO) reflect a consistent positive outlook among several reputable grading firms.
| Grading Company | Action | New Grade | Date |
|---|---|---|---|
| B of A Securities | maintain | Buy | 2025-11-07 |
| Barclays | maintain | Overweight | 2025-10-23 |
| TD Cowen | maintain | Buy | 2025-10-22 |
| Wells Fargo | maintain | Overweight | 2025-10-22 |
| Piper Sandler | maintain | Overweight | 2025-10-22 |
| Wells Fargo | maintain | Overweight | 2025-09-25 |
| UBS | maintain | Buy | 2025-09-11 |
| JP Morgan | maintain | Overweight | 2025-07-23 |
| UBS | maintain | Buy | 2025-07-23 |
| BNP Paribas | maintain | Outperform | 2025-07-21 |
Overall, the trend in grades for Coca-Cola shows a stable and optimistic sentiment, with multiple firms maintaining their positive recommendations. This reflects strong confidence in the company’s performance and market position.
Target Prices
The consensus target price for The Coca-Cola Company (KO) indicates a balanced outlook from analysts.
| Target High | Target Low | Consensus |
|---|---|---|
| 82 | 76 | 79 |
Overall, analysts expect the stock to stabilize around the consensus price of 79, reflecting a moderate growth outlook.
Consumer Opinions
Consumer sentiment about The Coca-Cola Company is a blend of enthusiasm and critique, reflecting the diverse experiences of its customers.
| Positive Reviews | Negative Reviews |
|---|---|
| “Refreshing taste that I love every time!” | “Too much sugar in their drinks.” |
| “Great variety of flavors available.” | “Prices have been rising consistently.” |
| “Iconic brand that never disappoints.” | “Customer service could be improved.” |
| “Sustainability efforts are commendable.” | “I wish they offered more low-calorie options.” |
Overall, consumer feedback reveals strong appreciation for Coca-Cola’s flavor variety and brand reliability, while concerns about sugar content and rising prices are frequently noted.
Risk Analysis
In evaluating The Coca-Cola Company’s potential investments, it’s crucial to consider various risks that may impact performance. Below is a summary of identified risks:
| Category | Description | Probability | Impact |
|---|---|---|---|
| Market Risk | Fluctuations in consumer preferences and behaviors. | High | High |
| Regulatory Risk | Changes in health regulations affecting product sales. | Medium | High |
| Supply Chain Risk | Disruptions in raw material supply affecting production. | High | Medium |
| Currency Risk | Exchange rate volatility impacting international sales. | Medium | Medium |
| Competition Risk | Increased competition from emerging beverage brands. | High | Medium |
The most likely and impactful risks revolve around market dynamics and regulatory changes, which have significant implications for Coca-Cola’s sales and profitability. The beverage industry is highly competitive, and consumer preferences can shift rapidly, necessitating a proactive approach to risk management.
Should You Buy The Coca-Cola Company?
The Coca-Cola Company (KO) boasts a solid net profit margin of 22.59%, a return on invested capital (ROIC) of 19.59%, and a weighted average cost of capital (WACC) of 5.28%. Its flagship products continue to dominate the beverage market, while recent risks include increased competition and supply chain challenges.
Given that the net profit margin is positive and substantially exceeds the WACC, alongside a favorable long-term trend and strong buyer volumes, I find the current setup appears favorable for long-term investors looking to add KO to their portfolios. However, I recommend monitoring market conditions closely, as recent trends indicate seller dominance in buyer behavior.
Specific risks to consider include intensified competition and market dependence on consumer preferences, which could impact future revenue growth.
Disclaimer: This article is not financial advice. Each investor is responsible for their own investment decisions.
Additional Resources
- KO – Coca-Cola Co Stock Price and Quote – Finviz (Nov 14, 2025)
- Assessing Coca-Cola’s Value After Recent International Expansion and 15% Year-To-Date Gain – simplywall.st (Nov 17, 2025)
- Coca-Cola Consolidated Repurchases All Outstanding Shares Held by The Coca-Cola Company – The Coca-Cola Company (Nov 07, 2025)
- Sluggish Volume Trends Affected The Coca-Cola Company (KO) in Q3 – Insider Monkey (Nov 12, 2025)
- Coca-Cola (KO): Buy, Sell, or Hold Post Q3 Earnings? – Yahoo Finance (Nov 12, 2025)
For more information about The Coca-Cola Company, please visit the official website: coca-colacompany.com

