In a world increasingly driven by technology, Synopsys, Inc. stands at the forefront of electronic design automation, shaping how integrated circuits are designed and tested. With its innovative Fusion Design and Verification Continuum Platforms, Synopsys not only streamlines complex design processes but also empowers industries ranging from automotive to healthcare. As I delve into a detailed investment analysis, I will explore whether the fundamentals of Synopsys continue to justify its current market valuation and growth prospects in an evolving landscape.

Table of contents
Company Description
Synopsys, Inc. is a leading provider of electronic design automation (EDA) software, specializing in tools for the design and testing of integrated circuits. Founded in 1986 and headquartered in Mountain View, California, the company operates primarily in the technology sector, serving major markets including electronics, automotive, financial services, and healthcare. Its core offerings include the Fusion Design Platform for digital design implementation and the Verification Continuum Platform for virtual prototyping and verification. With a workforce of approximately 20,000 employees, Synopsys positions itself as an innovator in the EDA landscape, continually influencing the industry through advancements in software and security solutions that enhance the development lifecycle for its clients.
Fundamental Analysis
In this section, I will analyze Synopsys, Inc.’s income statement, key financial ratios, and payout policy to provide insights into its overall financial health and investment potential.
Income Statement
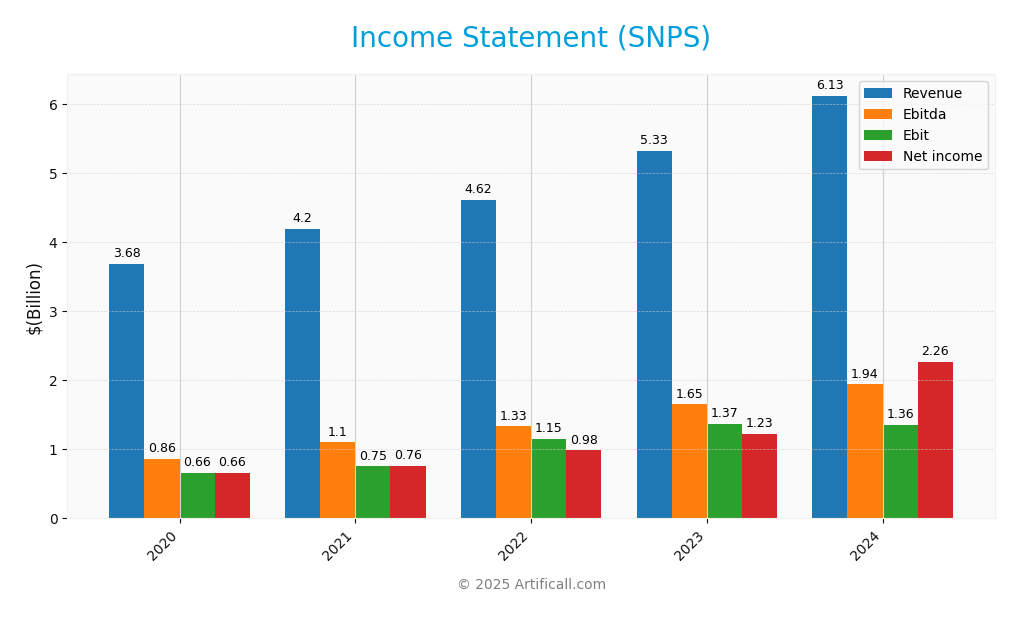
The following table summarizes the income statement for Synopsys, Inc. (ticker: SNPS) over the past five fiscal years, illustrating key financial metrics that can guide investment decisions.

| Metric | 2020 | 2021 | 2022 | 2023 | 2024 |
|---|---|---|---|---|---|
| Revenue | 3.68B | 4.20B | 4.62B | 5.33B | 6.13B |
| Cost of Revenue | 833M | 896M | 898M | 1.23B | 1.25B |
| Operating Expenses | 2.19B | 2.55B | 2.57B | 2.73B | 3.53B |
| Gross Profit | 2.85B | 3.30B | 3.72B | 4.10B | 4.88B |
| EBITDA | 857M | 1.10B | 1.33B | 1.65B | 1.94B |
| EBIT | 656M | 754M | 1.15B | 1.37B | 1.36B |
| Interest Expense | 5M | 3.36M | 1.70M | 1.18M | 35.16M |
| Net Income | 664M | 758M | 985M | 1.23B | 2.26B |
| EPS | 4.40 | 4.96 | 6.44 | 8.08 | 14.78 |
| Filing Date | 2020-12-15 | 2021-12-13 | 2022-12-12 | 2023-12-12 | 2024-12-19 |
Over the five-year period, Synopsys has demonstrated a consistent upward trend in both revenue and net income, indicating strong operational growth. The revenue has increased from $3.68 billion in 2020 to $6.13 billion in 2024, representing a compound annual growth rate (CAGR) of approximately 20%. Net income saw a remarkable rise, nearly tripling from $664 million to $2.26 billion. The gross profit margin has stabilized around 79%, reflecting efficient cost management. In the most recent fiscal year, while revenue growth continued, the slight dip in operating income suggests potential increases in operational costs that investors should monitor closely. Overall, Synopsys appears to be on a strong growth trajectory, but vigilance regarding expense management is warranted.
Financial Ratios
The following table provides an overview of the financial ratios for Synopsys, Inc. (SNPS) over the last five fiscal years.
| Ratio | 2020 | 2021 | 2022 | 2023 | 2024 |
|---|---|---|---|---|---|
| Net Margin | 18.03% | 18.04% | 21.33% | 23.08% | 36.94% |
| ROE | 13.54% | 14.31% | 17.85% | 20.01% | 25.17% |
| ROIC | 11.14% | 11.89% | 17.29% | 18.58% | 13.01% |
| P/E | 48.65 | 66.49 | 45.46 | 58.07 | 34.75 |
| P/B | 6.59 | 9.51 | 8.12 | 11.62 | 8.75 |
| Current Ratio | 1.19 | 1.16 | 1.09 | 1.15 | 2.44 |
| Quick Ratio | 1.10 | 1.07 | 1.01 | 1.04 | 2.30 |
| D/E | 0.14 | 0.13 | 0.12 | 0.11 | 0.08 |
| Debt-to-Assets | 8.26% | 7.62% | 6.97% | 6.56% | 5.24% |
| Interest Coverage | 127.68 | 223.96 | 676.51 | 1159.09 | 38.56 |
| Asset Turnover | 0.46 | 0.48 | 0.49 | 0.52 | 0.47 |
| Fixed Asset Turnover | 3.88 | 4.35 | 4.43 | 4.80 | 5.43 |
| Dividend Yield | 0% | 0% | 0% | 0% | 0% |
Interpretation of Financial Ratios
In 2024, Synopsys, Inc. presents strong financial ratios, particularly in net margin (36.94%) and ROE (25.17%), indicating effective profitability and return on equity. However, the P/E ratio of 34.75 may suggest overvaluation compared to historical trends. The interest coverage ratio has declined sharply to 38.56, which might indicate increasing debt servicing challenges if earnings do not continue to grow.
Evolution of Financial Ratios
Over the past five years, Synopsys has shown a notable improvement in net and return margins, signaling robust profitability growth. Conversely, the decline in interest coverage raises concerns about potential risks associated with debt management, warranting close attention moving forward.
Distribution Policy
Synopsys, Inc. does not pay dividends, reflecting a strategic focus on reinvestment to fuel growth and innovation. In its high-growth phase, the company prioritizes research and development, positioning itself for long-term shareholder value creation. Despite the absence of dividends, Synopsys engages in share buybacks, which can enhance shareholder returns. Overall, this approach appears aligned with sustainable growth, although investors should remain cautious of potential market volatility and competitive pressures.
Sector Analysis
Synopsys, Inc. operates within the Software – Infrastructure industry, providing essential electronic design automation tools and solutions for integrated circuits, competing with key players like Cadence and Mentor Graphics. Its competitive advantages include a robust product portfolio and a strong focus on innovation, complemented by a thorough SWOT analysis that highlights strengths, weaknesses, opportunities, and threats.
Strategic Positioning
Synopsys, Inc. holds a significant market share in the electronic design automation (EDA) software industry, particularly through its Fusion Design Platform and Verification Continuum Platform. As of late 2023, the company faces competitive pressure from key players like Cadence and Mentor Graphics, yet maintains a strong position due to its robust product offerings and innovation in areas such as security and IP solutions. The technological landscape is rapidly evolving, with advancements in AI and machine learning presenting both opportunities and challenges. I remain cautious, focusing on Synopsys’s ability to adapt and sustain its competitive edge amidst potential disruptions.
Key Products
Below is a table summarizing the key products offered by Synopsys, Inc., which play a vital role in the electronic design automation (EDA) industry.
| Product | Description |
|---|---|
| Fusion Design Platform | A comprehensive suite that provides digital design implementation solutions for integrated circuits. |
| Verification Continuum Platform | Offers virtual prototyping, static and formal verification, simulation, and emulation tools. |
| FPGA Design Products | Specialized tools designed for programming field programmable gate arrays (FPGAs) for specific tasks. |
| Intellectual Property (IP) Solutions | Includes IP for various applications such as USB, PCI Express, and Bluetooth for enhanced design efficiency. |
| Analog IP | Features data converters, audio codecs, and other components essential for analog signal processing. |
| Security IP Solutions | Provides tools for enhancing security in designs, ensuring protection against vulnerabilities. |
| Platform Architect Solutions | Tools for analyzing and optimizing system-on-chip (SoC) architectures, enhancing performance. |
| HAPS FPGA-based Prototyping Systems | High-performance prototyping systems that facilitate the rapid development of complex designs. |
| Configurable Processor Cores | Application-specific instruction-set processor tools for embedded applications across various sectors. |
| Software Security Testing Services | Managed services and training that help identify and remediate security vulnerabilities in software development. |
These products collectively empower designers and engineers across various industries, including electronics, automotive, and healthcare, ensuring they have the tools necessary for developing innovative solutions.
Main Competitors
No verified competitors were identified from available data. However, I can provide insights into Synopsys, Inc.’s estimated market share and competitive position. As a leader in the electronic design automation (EDA) industry, Synopsys holds a significant market share, supported by its comprehensive suite of software products and solutions. The company is dominant in its sector, particularly in North America, where it serves a wide array of industries including electronics, automotive, and financial services.
Competitive Advantages
Synopsys, Inc. holds significant competitive advantages in the electronic design automation (EDA) sector, primarily due to its robust product portfolio and innovative solutions. Its Fusion Design and Verification Continuum platforms offer comprehensive tools for digital design and verification, making them essential for the semiconductor industry. The company’s focus on integrating security into the software development lifecycle further enhances its value proposition. Looking ahead, Synopsys is well-positioned to explore new markets and expand its offerings, particularly in areas like automotive and artificial intelligence, where demand for advanced design tools is expected to surge. This forward momentum presents considerable opportunities for growth and market leadership.
SWOT Analysis
The purpose of this analysis is to assess Synopsys, Inc.’s strategic position and inform investment decisions.
Strengths
- Strong market position
- Diverse product offerings
- Robust R&D capabilities
Weaknesses
- High dependency on specific markets
- Limited brand recognition outside tech
- High competition in software
Opportunities
- Growth in semiconductor demand
- Expansion into emerging markets
- Increasing need for cybersecurity solutions
Threats
- Rapid technological changes
- Economic downturns affecting clients
- Intense competition from other tech firms
Overall, Synopsys, Inc. demonstrates a solid strategic position with significant strengths and opportunities that could drive future growth. However, the company must navigate its weaknesses and potential threats effectively to sustain its competitive edge in the evolving technology landscape.
Stock Analysis
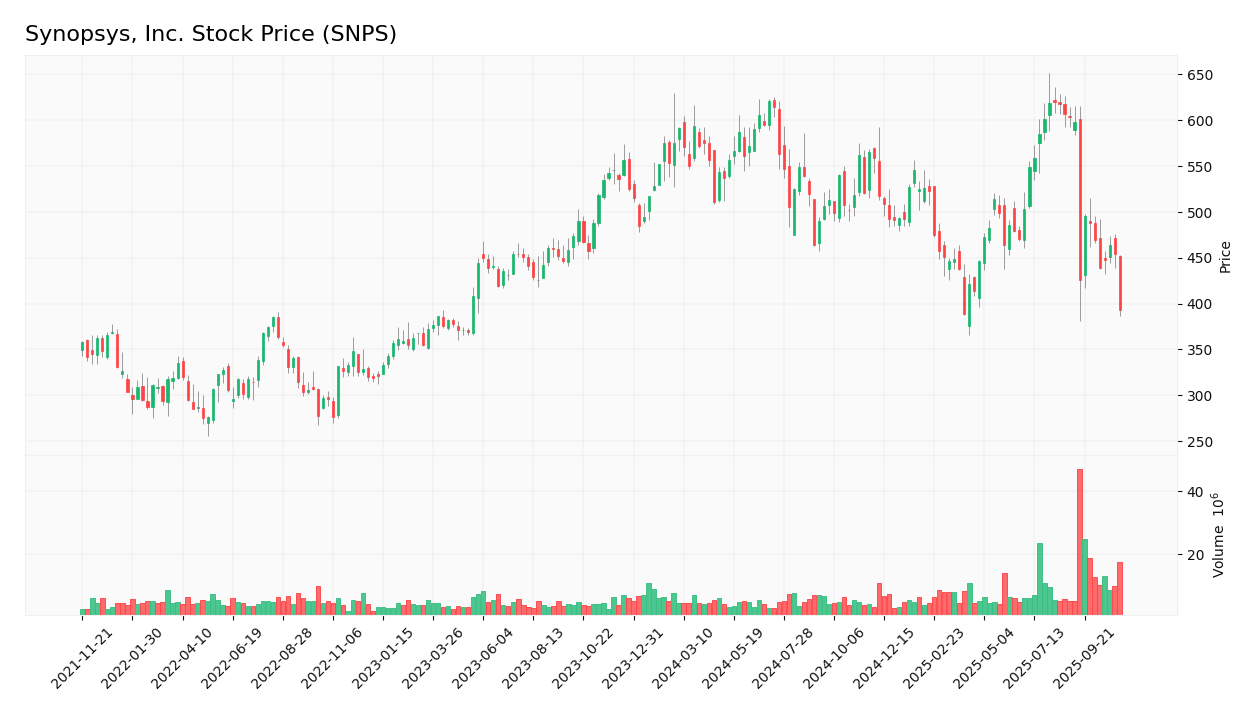
Over the past year, Synopsys, Inc. (SNPS) has experienced significant price movements, reflecting a bearish sentiment in the market. The stock has notably declined, indicating a shift in trading dynamics that traders should monitor closely.

Trend Analysis
Analyzing the stock over the past year, Synopsys, Inc. has seen a percentage change of -29.27%, indicating a bearish trend. The stock hit a notable high of $621.30 and a low of $388.13 during this period. Additionally, the trend is characterized by deceleration, suggesting a slowing rate of decline, with a standard deviation of 54.54 indicating considerable volatility in price movements.
Volume Analysis
In the past three months, the average trading volume for Synopsys has been approximately 14.68M shares. The trading activity appears seller-driven, with a significant average sell volume of 11.52M compared to an average buy volume of 3.16M. This suggests a bearish sentiment among investors, although the overall volume trend remains bullish, reflecting potential interest from buyers despite the current seller dominance.
Analyst Opinions
Recent analyst recommendations for Synopsys, Inc. (SNPS) have indicated a mixed outlook. On November 7, 2025, analysts rated the stock as “Neutral” overall, with a specific “Buy” recommendation based on its discounted cash flow (DCF) analysis and return on assets (ROA). However, concerns about debt levels and price-to-earnings (PE) ratios led to “Strong Sell” ratings in those areas. The consensus currently leans towards a cautious approach, suggesting a “Hold” strategy for investors looking to balance risk with potential returns.
Stock Grades
No verified stock grades were available from recognized analysts for Synopsys, Inc. (SNPS). This limitation makes it challenging to assess the current sentiment and market position of the stock based solely on grading data. However, it is important to consider other factors such as market trends, company performance, and broader economic indicators when evaluating potential investment opportunities.
Target Prices
No verified target price data is available from recognized analysts for Synopsys, Inc. (SNPS). The current market sentiment appears to be cautious, reflecting uncertainty in the tech sector.
Consumer Opinions
Consumer sentiment surrounding Synopsys, Inc. (SNPS) reflects a dynamic mix of praise and criticism, illuminating the company’s strengths and areas for improvement.
| Positive Reviews | Negative Reviews |
|---|---|
| Excellent software tools for design and verification. | Customer support could be more responsive. |
| Strong innovation pipeline keeps products relevant. | Pricing is perceived as high by some users. |
| User-friendly interface boosts productivity. | Some features require steep learning curves. |
Overall, consumer feedback on Synopsys highlights the company’s robust software capabilities and innovation as key strengths, while concerns about customer support and pricing persist as notable weaknesses.
Risk Analysis
In assessing the investment potential of Synopsys, Inc. (SNPS), it is crucial to understand the associated risks. The following table outlines the primary risks, their likelihood, and potential impact.
| Category | Description | Probability | Impact |
|---|---|---|---|
| Market Risk | Fluctuations in technology sector demand. | High | High |
| Regulatory Risk | Changes in regulations affecting software tools. | Medium | High |
| Competition Risk | Increasing competition from other tech firms. | High | Medium |
| Operational Risk | Potential disruptions in supply chain or services. | Medium | Medium |
| Cybersecurity Risk | Threats to data security and intellectual property. | High | High |
The most significant risks for Synopsys involve high market volatility and cybersecurity threats, especially given the rapid evolution of technology and increased regulatory scrutiny in recent years.
Should You Buy Synopsys, Inc.?
Synopsys, Inc. has positioned itself as a leader in software development and electronic design automation (EDA), with flagship products that cater to various aspects of chip design and verification. As of the most recent data, the company boasts a net margin of 36.94%, a return on invested capital (ROIC) of 13.01%, and a weighted average cost of capital (WACC) of 11.50%. Despite these robust financial metrics, the company is currently facing a bearish trend in its stock price and heightened seller volumes.
Based on the latest financial performance, with a net margin exceeding 0 and ROIC surpassing WACC, the fundamentals indicate a favorable position for Synopsys. However, the negative long-term trend and the current seller-dominant volume suggest that it may be more prudent for investors to wait for a bullish reversal or an increase in buyer volumes before considering an addition to their portfolio.
Specific risks to consider include intense competition in the EDA space, potential supply chain disruptions, and the company’s valuation given its current market multiples.
Disclaimer: This article is not financial advice. Each investor is responsible for their own investment decisions.
Additional Resources
- Jackson Square Partners LLC Raises Holdings in Synopsys, Inc. $SNPS – MarketBeat (Nov 09, 2025)
- Synopsys (SNPS) Stock Sinks As Market Gains: Here’s Why – Yahoo Finance (Nov 05, 2025)
- Synopsys, Inc. (SNPS) Investors with Substantial Losses – GlobeNewswire (Nov 08, 2025)
- Synopsys, Inc. (SNPS) Faces Securities Class Action Amid Q325 Results Revealing IP Business Problems — Hagens Berman – PR Newswire (Nov 06, 2025)
- Synopsys Announces Earnings Release Date for Fourth Quarter and Fiscal Year 2025 – Synopsys (Oct 30, 2025)
For more information about Synopsys, Inc., please visit the official website: synopsys.com


