Imagine transforming how we experience beauty and fashion with just a swipe on our screens. Perfect Corp. is pioneering this shift, revolutionizing the beauty industry with its innovative software solutions that blend artificial intelligence and augmented reality. Renowned for its flagship products like YouCam and an array of virtual try-on technologies, Perfect Corp. stands out as a formidable force in the application software sector. As we delve into this analysis, I will explore whether the company’s robust fundamentals continue to justify its market valuation and growth potential.

Table of contents
Company Description
Perfect Corp., founded in 2015 and headquartered in New Taipei City, Taiwan, is a pioneer in SaaS solutions that integrate artificial intelligence and augmented reality within the beauty and fashion technology sectors. The company specializes in a wide array of innovative products, including virtual makeup try-ons, AI-driven skin analysis, and personalized beauty solutions via its YouCam app suite. Operating primarily in North America and Asia, Perfect Corp. positions itself as a leader in the software application industry, catering to both consumers and businesses. With a strong emphasis on technological innovation, Perfect Corp. continues to shape the beauty and fashion landscape through its cutting-edge offerings and strategic focus on enhancing user experience.
Fundamental Analysis
In this section, I will evaluate Perfect Corp.’s financial health by examining its income statement, key ratios, and dividend payout policy.
Income Statement
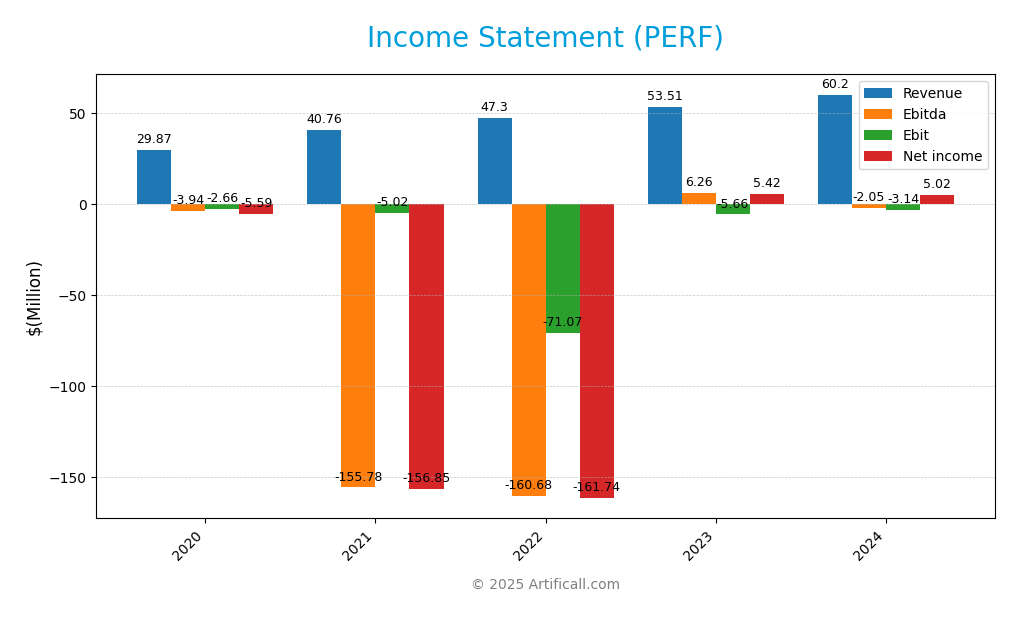
The following table summarizes Perfect Corp.’s income statement for the last five years, highlighting the company’s financial performance across key metrics.

| Metric | 2020 | 2021 | 2022 | 2023 | 2024 |
|---|---|---|---|---|---|
| Revenue | 29.87M | 40.76M | 47.30M | 53.51M | 60.20M |
| Cost of Revenue | 3.96M | 5.74M | 7.13M | 10.40M | 13.26M |
| Operating Expenses | 28.57M | 40.04M | 111.24M | 48.77M | 50.09M |
| Gross Profit | 25.91M | 35.02M | 40.17M | 43.11M | 46.94M |
| EBITDA | -3.94M | -155.78M | -160.68M | 6.26M | -2.05M |
| EBIT | -2.66M | -5.02M | -71.07M | -5.66M | -3.14M |
| Interest Expense | 0.009M | 0.009M | 0.008M | 0.015M | 0.007M |
| Net Income | -5.59M | -156.85M | -161.74M | 5.42M | 5.02M |
| EPS | -0.047 | -1.33 | -1.37 | 0.05 | 0.05 |
| Filing Date | N/A | N/A | N/A | 2024-03-29 | 2025-03-28 |
Over the years, Perfect Corp. has shown a positive trend in revenue growth, with a notable increase from $29.87 million in 2020 to $60.20 million in 2024. However, the net income has exhibited volatility, moving from significant losses in prior years to a modest profit of $5.02 million in 2024. The gross profit margin has remained relatively stable, suggesting effective cost management. In 2024, while revenue growth continued, the EBITDA turned negative, indicating challenges in operating profitability. It will be crucial to monitor how the company addresses these operational inefficiencies moving forward.
Financial Ratios
The table below summarizes the key financial ratios for Perfect Corp. (ticker: PERF) over the last five years.
| Ratio | 2020 | 2021 | 2022 | 2023 | 2024 |
|---|---|---|---|---|---|
| Net Margin | -0.187 | -3.848 | -3.420 | 0.101 | 0.083 |
| ROE | 0.156 | -1.764 | -0.889 | 0.039 | 0.034 |
| ROIC | -0.037 | -0.073 | -0.383 | -0.040 | -0.021 |
| P/E | -214 | -7.427 | 4.720 | 62.000 | 56.600 |
| P/B | -33.440 | -6.117 | 4.641 | 2.409 | 1.933 |
| Current Ratio | 6.371 | 4.419 | 8.395 | 5.836 | 5.523 |
| Quick Ratio | 6.365 | 4.415 | 8.393 | 5.835 | 5.523 |
| D/E | -0.010 | -0.003 | 0.002 | 0.006 | 0.003 |
| Debt-to-Assets | -0.010 | -0.007 | 0.002 | 0.005 | 0.003 |
| Interest Coverage | -296 | -557 | -8884 | -377 | -449 |
| Asset Turnover | 0.346 | 0.458 | 0.225 | 0.314 | 0.332 |
| Fixed Asset Turnover | 38.746 | 39.688 | 77.288 | 43.606 | 57.942 |
| Dividend Yield | 0 | 0 | 0 | 0 | 0 |
Interpretation of Financial Ratios
In 2024, the financial ratios of Perfect Corp. indicate a mixed performance. While the company exhibits a solid current and quick ratio, reflecting strong liquidity, the negative net margin and return on equity (ROE) raise concerns. The high price-to-earnings (P/E) ratio suggests that investors might be paying a premium for the stock despite its profitability challenges.
Evolution of Financial Ratios
Over the past five years, Perfect Corp. has shown significant volatility in its financial ratios. The company initially faced severe profitability issues, as indicated by negative net margins and returns, but has recently improved its liquidity ratios, demonstrating a better short-term financial position. However, profitability remains a concern.
Distribution Policy
Perfect Corp. does not currently pay dividends, focusing instead on reinvesting in high-growth opportunities and research and development. This strategy aligns with their objective of creating long-term shareholder value, particularly as they navigate a challenging financial landscape. The company is actively engaged in share buybacks, which could enhance shareholder returns. Overall, while the lack of dividends may seem unfavorable, the approach supports sustainable growth, reflecting a commitment to future value creation.
Sector Analysis
Perfect Corp. operates in the Software – Application industry, specializing in AI and augmented reality solutions for beauty and fashion, facing competition from other tech firms while leveraging unique technology and innovative applications.
Strategic Positioning
Perfect Corp. operates within the rapidly evolving Software – Application sector, focusing on artificial intelligence and augmented reality solutions for beauty and fashion. Currently, the market share of its key products, especially the AR makeup virtual try-on technology, positions it favorably against competitors. Despite facing significant competitive pressure from established players and new entrants, Perfect Corp. continues to innovate, particularly in AI-driven applications. However, the threat of technological disruption remains a constant challenge, necessitating vigilance and adaptability in its strategies to maintain its market position.
Key Products
Below is a table showcasing some of the key products offered by Perfect Corp., highlighting their innovative solutions in the beauty and fashion tech space.
| Product | Description |
|---|---|
| AR Makeup Virtual Try-On | A feature that allows users to virtually apply makeup using augmented reality technology, enhancing the online shopping experience. |
| AI Foundation Shade Finder | A tool that accurately matches users with the ideal foundation shade based on their skin tone, using advanced AI algorithms. |
| YouCam Makeup | A mobile application providing virtual makeup application, tutorials, and effects for users to experiment with different looks. |
| AI Skin Analysis | An AI-driven service that analyzes skin conditions and provides personalized skincare recommendations. |
| Virtual Hair Color Try-On | Allows users to experiment with different hair colors in real-time, making it easier to choose a new look without commitment. |
| YouCam Nails | An app offering virtual nail art try-ons and tutorials, enabling users to explore various nail designs. |
| AI Face Analyzer | An AI solution that assesses facial features and provides insights for beauty and skincare enhancements. |
| In-Store Barcode Try-On | A feature that enables users to scan product barcodes in-store to utilize AR try-on capabilities on their mobile devices. |
| AR Jewelry Virtual Try-On | Allows customers to try on rings, earrings, bracelets, and other jewelry items virtually, enhancing the online shopping experience. |
These products exemplify Perfect Corp.’s commitment to leveraging technology to enhance beauty and fashion experiences for consumers.
Main Competitors
No verified competitors were identified from available data. However, I can provide some insights into Perfect Corp.’s estimated market share and competitive position. As a player in the Software – Application sector, Perfect Corp. focuses on SaaS solutions in the beauty and fashion tech industry, particularly with innovative offerings in augmented reality and artificial intelligence. While the exact market share is not specified, the company has carved out a niche in its market, indicating strong potential for growth and innovation in a competitive landscape.
Competitive Advantages
Perfect Corp. stands out in the software application industry through its innovative use of artificial intelligence and augmented reality in the beauty and fashion sectors. Its diverse product offerings, such as virtual try-on solutions and AI-driven tools, cater to a growing consumer demand for personalized experiences. Looking ahead, the company has significant opportunities to expand into new markets and develop additional products, potentially enhancing its market share and driving revenue growth. With a solid foundation and a forward-thinking approach, Perfect Corp. is well-positioned for future success.
SWOT Analysis
The SWOT analysis provides an overview of Perfect Corp.’s strategic position by identifying its strengths, weaknesses, opportunities, and threats.
Strengths
- Innovative technology
- Strong brand presence
- Diverse product offerings
Weaknesses
- Limited market reach
- High competition
- Dependence on technology trends
Opportunities
- Growing demand for AR solutions
- Expansion into new markets
- Potential partnerships with beauty brands
Threats
- Rapid technological changes
- Economic downturns
- Regulatory challenges
Overall, the SWOT assessment indicates that while Perfect Corp. has strong innovative capabilities and market opportunities, it must address its weaknesses and potential threats to enhance its strategic positioning and ensure sustainable growth.
Stock Analysis
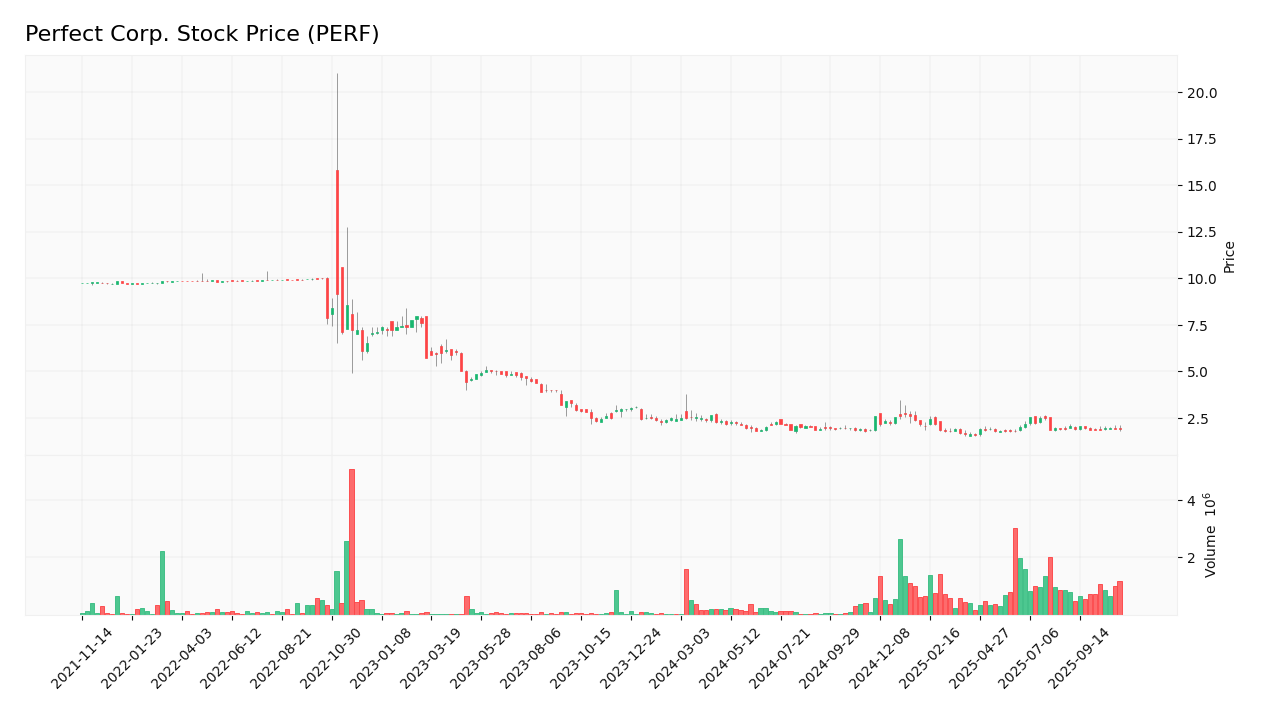
Over the past year, Perfect Corp. (ticker: PERF) has experienced notable price movements characterized by significant volatility, culminating in a bearish trend with a price decrease of 35.02%.

Trend Analysis
Analyzing the stock’s performance over the past two years, we see a price change of -35.02%, indicating a bearish trend. The stock has exhibited acceleration in its downward movement, with the highest price reaching 3.1 and the lowest at 1.61. The standard deviation of 0.32 reflects a moderate level of volatility, suggesting that while the stock price has been generally declining, there have been fluctuations along the way.
Volume Analysis
In the last three months, the average trading volume has increased to approximately 793.91K, with average buy volume at 247.65K and sell volume at 546.26K. This indicates a seller-dominant market, as evidenced by the higher selling activity. The overall volume trend remains bullish, suggesting a potential increase in market participation, despite the prevailing bearish price action. The trend slope of 32.94K points to an acceleration in volume, reflecting heightened investor activity around this stock.
Analyst Opinions
Recent analyst recommendations for Perfect Corp. (PERF) suggest a cautious stance. On November 7, 2025, an analyst rated the stock with a “B-” and a “Sell” recommendation. The main concerns revolve around weak ROE and debt metrics, which received “Strong Sell” ratings. However, the company’s DCF score indicates a “Strong Buy,” highlighting potential undervaluation. Despite mixed signals, the overall consensus leans towards a “Sell” for the current year. Therefore, investors should approach with caution, considering both growth potential and underlying risks.
Stock Grades
No verified stock grades were available from recognized analysts for Perfect Corp. (ticker: PERF). As such, I recommend investors proceed with caution and consider other fundamental and technical factors when evaluating this stock.
Target Prices
No verified target price data is available from recognized analysts for Perfect Corp. (PERF). The current market sentiment appears cautious, with investors awaiting more definitive guidance on the company’s future performance.
Consumer Opinions
Consumer sentiment around Perfect Corp. (ticker: PERF) reveals a mix of appreciation and criticism, showcasing the diverse experiences of its user base.
| Positive Reviews | Negative Reviews |
|---|---|
| “The app is user-friendly and intuitive!” | “Customer service needs improvement.” |
| “Great features for enhancing photos!” | “Frequent bugs and crashes.” |
| “Excellent value for the subscription price.” | “Limited options for customization.” |
Overall, consumer feedback highlights strengths in the app’s user-friendliness and features, while common concerns involve customer service and technical issues.
Risk Analysis
In evaluating the potential investment in Perfect Corp. (PERF), it’s essential to consider the various risks that could impact its performance.
| Category | Description | Probability | Impact |
|---|---|---|---|
| Market Risk | Fluctuations in the tech sector can affect stock performance. | High | High |
| Regulatory Risk | Changes in regulations regarding data privacy and AI could impact operations. | Medium | High |
| Competition Risk | Intense competition from other tech firms may erode market share. | High | Medium |
| Operational Risk | Potential disruptions in supply chains or technology failures. | Medium | Medium |
| Financial Risk | Dependence on investments and cash flow can lead to vulnerabilities. | Medium | High |
Given the current market dynamics, market and regulatory risks are notably high, with potential significant impacts on Perfect Corp.’s future performance.
Should You Buy Perfect Corp.
Perfect Corp. has shown a mixed performance with recent financial metrics indicating a net profit margin of 8.34% and a return on invested capital (ROIC) of -2.11%, which is below the weighted average cost of capital (WACC). The company has competitive advantages in its flagship products, although recent risks include a bearish overall market trend and a concerning volume of selling activity.
Given the current net margin of 8.34%, which is positive, I would typically consider this a favorable signal for long-term investment. However, the ROIC of -2.11% being below the WACC suggests that the company is not generating sufficient returns on its capital. Additionally, the long-term trend is bearish, and the recent volume analysis indicates a seller-dominant market with high average sell volume compared to buy volume. Therefore, I recommend waiting for a bullish reversal and for buyer volumes to return before considering an investment in Perfect Corp.
Specific risks include intense competition within the tech sector, potential supply chain disruptions, and the company’s dependence on market performance, which may affect its valuation.
Disclaimer: This article is not financial advice. Each investor is responsible for their own investment decisions.
Additional Resources
- Perfect Corp (PERF): Exploring Valuation as Shares Lose Momentum – Yahoo Finance (Oct 21, 2025)
- Evaluating Perfect Corp (PERF): Is There Value in the Recent Share Price Recovery? – simplywall.st (Nov 01, 2025)
- Perfect Corp. Partners with Louis Vuitton to Power Innovative Virtual Try-On for New Makeup Line – Business Wire (Oct 29, 2025)
- Perfect Corp. (NYSE: PERF) posts $18.7M Q3 revenue, records first operating profit – Stock Titan (Oct 28, 2025)
- Is Perfect Corp. stock recession proof – Trade Analysis Report & Intraday High Probability Alerts – fcp.pa.gov.br (Nov 06, 2025)
For more information about Perfect Corp., please visit the official website: perfectcorp.com


